Health
Vol.4 No.10A(2012), Article ID:24265,4 pages DOI:10.4236/health.2012.430151
The nature of proteins in influenza
![]()
1Department of Biotechnology, Periyar Maniammai University, Thanjavur, India
2School of Biotechnology and Health Sciences, Karunya University, Coimbatore, India; *Corresponding Author: ersekaran@gmail.com
Received 15 September 2012; revised 13 October 2012; accepted 25 October 2012
Keywords: Carbon Distribution; Influenza Virus; H1N1; Carbon Study; Protein Analysis; Swine Flu; Proteomics; Transcriptomics
ABSTRACT
Mutation can alter the structure of viral proteins to form different structure. Carbon distribution is responsible for these changes in structure. The carbon distribution in proteins of human Influenza A virus is analyzed here. Results reveal that the carbon contents are high in surface proteins, optimum in polymerase proteins and less in nuclear proteins. Polymerase proteins have better carbon distribution pattern than the other proteins. Thymine distribution in different frames of mRNAs are checked as it has link with carbon distribution pattern in the corresponding proteins. Results show that frame 4 is violating from thymine distribution. This is responsible for production of protein with different carbon distribution. Unusual thymine distribution in frame 3 are observed. The thymine distributions are different in viral mRNA compared to normal one. Minimizing the excess thymine in H1N1 mRNAs might improve the protein performance. Mutational study based on carbon distribution should be better exploited for further improving the protein stability, activity and ultimately for gene therapy.
1. INTRODUCTION
Viruses penetrate into animal cells, produce RNAs and proteins and multiply. The body sometimes produces antibodies to prevent replication that ultimately give up the infection. On the vaccine side the viruses that stimulate the body’s defenses to fight infection. Viruses are classified depending on the nucleic acid constituents. Influenza viruses are negative single stranded RNA used for synthesizing mRNAs. Influenza A viruses are pandemic due to sudden mutation/variation in surface proteins. There are records of evidence that the Influenza A virus may mutate into a form that can be transmitted to human easily. The mutations lead to different forms of surface proteins that form different structure. The carbon content and distribution leads to formation of these many structures on mutation [1,2]. Earlier studies on protein mutations reveal that carbon distribution is responsible for diseases and different functions [3,4]. The carbon distribution analysis on proteins of Influenza A virus is carried out here. Particularly the H1N1 proteins are analyzed.
2. MATERIALS AND METHODS
The protein sequences of human Influenza A (H1N1) virus is taken from NCBI web site. The sequences are Hemagluttinin (HA), Neuraminidase (NA), Nucleoprotein (NP), Matrix 1 (M1), Matrix 2 (M2), Non-structural protein 1 (NS1), Non-structural protein 2 (NS2), Polymerase acidic (PA), RNA polymerase basic 1 (PB1) and RNA polymerase basic 2 (PB2). The Table 1 gives the protein ID and other relevant details. The corresponding mRNA sequences are also collected for composition analysis. The thymine distribution in different frames is also calculated since it is responsible for introducing large hydrophobic residues in the sequence.
The carbon distribution in individual proteins is computed using CARd program [5]. The input parameters including outer length = 255, inner length = 35 and step size = 15 are used for analysis. The carbon distribution plots are obtained for comparison.
In the same sub type (H1N1) the other set of proteins are downloaded from http://www.ncbi.nlm.
nih.gov/ge-nomes/FLU/Database/nphselect.cgi?go=genomeset for comparison. The download selection includes the Indian human influenza A H1N1 virus. There are 7 sets, each containing 10 sequences. The protein sequences are analyzed for amino acid composition and counted the fraction of large hydrophobic residues (F, I, L, M and V).
The mRNA sequences of different proteins are analyzed for base composition as shown in Figure 1. The average base composition is also calculated. The thymine
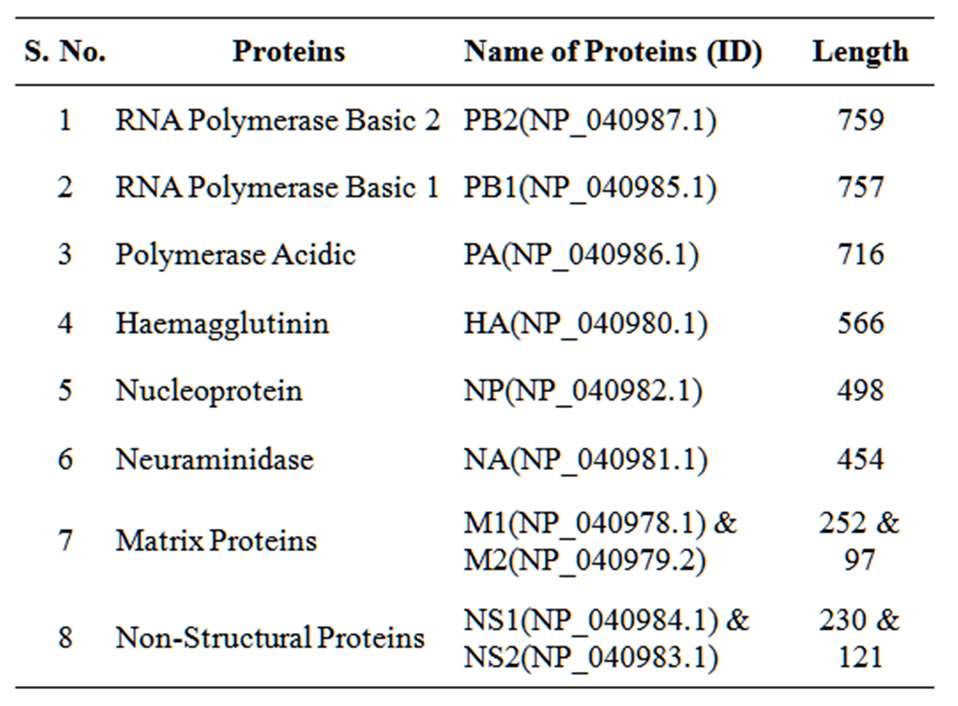
Table 1. The list of human Influenza A virus proteins taken for carbon distribution analysis with their ID and length.
 (a)
(a) (b)
(b)
Figure 1. (a) Average ACGT composition in different mRNAs of human Influenza A virus. (1-HA, 2-NA, 3- NP, 4-M1, 5-M2, 6-NS1, 7-NEP, 8-PA, 9-PB1 and 10- PB2). Note that highest content of adenine in all mRNAs. Different combination of mRNAs can selected based on thymine distribution for normal protein synthesis; (b) Average base composition in entire viral mRNA.
distribution in different are frames computed separately [as in ref. 1] since it is important for production of proteins with adequate large hydrophobic residues.
Mutational study based on carbon distribution is carried out to at site V715 of PB1 protein. The CARd program is used with parameters of 255 atoms (~17 aa) as outer length and 35 atoms as inner length. The results are plotted for comparison in native and mutational form.
3. RESULTS AND DISCUSSION
3.1. Carbon Distribution in Proteins of Influenza A Virus
The carbon distribution plots for polymerase proteinsPB1, PB2 and PA (Figure 2), surface proteins, HA and NA (Figure 3) and nuclear proteins, NP, M1, M2, NS1 and NS2 (Figure 4) are obtained using CARd program. The carbon fraction above of 0.3145 are considered as hydrophobic in nature. That is higher carbon content regions. The statistical carbon content is high in surface proteins, optimum in polymerase proteins and less in nuclear proteins. PB2 has uniform carbon distribution all along the sequence. But for long stretch of sequence (about 110 aa from 526), there were very high carbon content. This may be active site of interest. Both Nand C-terminals are in hydrophilic regions. Generally it has normal carbon distribution along the sequence. PB1 also has normal carbon distribution along the sequence with minor variation at 180 - 244 which are hydrophilic stretch. The N-terminal residues are in hydrophobic regions. But taken the first few residue it is hydrophilic. Again the first 110 amino acids posses significan hydrophobic residues. The PA protein has some unusual distribution. Stretches, 1 - 80, 280 - 350 and 366 - 438 are having higher number hydrophobic residues. The Nand C-

Figure 2. Carbon distribution in polymerase proteins (PB2, PB1 and PA). Optimum amount of carbon content is observed. The line at 0.3145 indicates the scale of measurement of carbon content. X-axis: Amino acid number and Y-axis: Mean carbon fraction.
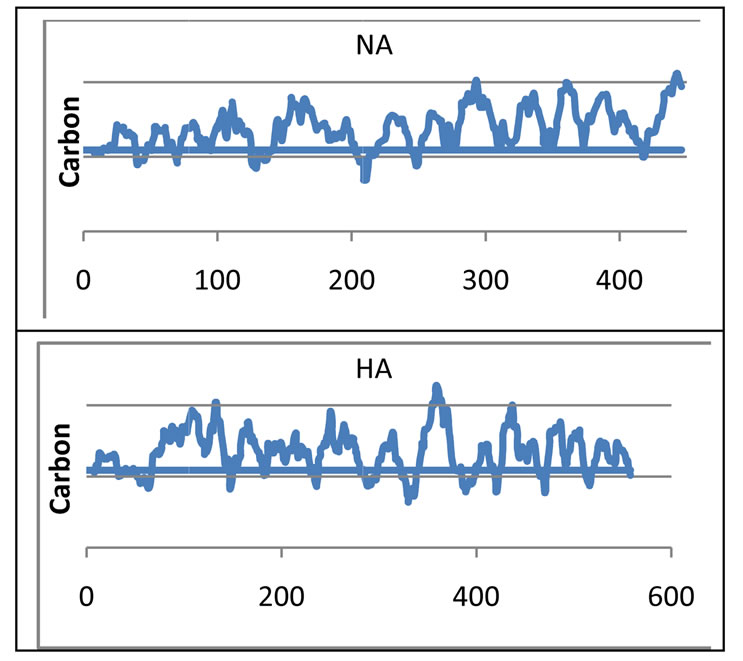
Figure 3. Carbon distribution in surface proteins (HA and NA). Higher carbon content is observed. The residue numbers are given in X-axis and carbon fraction in Y-axis. The lines in Y-axis are 0.26, 0.31 and 0.36 respectively. Blue line at middle (at 0.3145) is the scale hydrophobicity.

Figure 4. Carbon distribution in nuclear proteins (NP, M1, M2, NS1 and NS2). Less carbon observed. hydrophilic. Again the first 110 amino acids posses significan hydrophobic residues. The PA protein has some unusual distribution. Stretches, 1 - 80, 280 - 350 and 366 - 438 are having higher number hydrophobic residues. The Nand C-terminals are unusually hydrophobic. The terminals are not available protein degradation.
terminals are unusually hydrophobic. The terminals are not available protein degradation.
As expected the surfase proteins HA and NA have carbon distribution of up and down stretches. That is hydrophobic and hydrophilic stretches are repeated at defined interval. NA is relatively higher hydrophobic than HA. Stretch 66 - 150 of HA is not available external for interation as it is buried due to hydrophobic character. The Nand C-terminals are hydrophilic in character. The stretch, 140 - 200 of NA is buried inside and again not available for external interaction.
The nuclear proteins are generally hydrophilic. The hydrophobicities are increases and decreases for long stretch though the ups and down are observed within this large stretch. This may be required for wrap up the nucleic acid. The hydrophilic stretches for considerable length may required for the wrap up. M2 and NS2 are too small to do this wraping around. This can be removed while applying for gene therapy.
3.2. Adenine in mRNA Sequence
The average base composition of different RNAs of human Influenza A virus are given in Figure 1. The values are calculated over all seven sets of H1N1 virus. It is noted that the adenine is higher in all mRNAs. It is argued that during evolution the AT contents are reduced and GC contents are increased in animals [6]. But the virus, particularly the negative stranded viruses are excellent sources of AT rich genes. It is a natural way of adding AT rich sequences. This can be better exploited for introduction of normal proteins into host cell.
3.3. Thymine Distribution in Different Frames of Coding mRNA Sequences
The thymine distribution in different frames of Influenza A virus (H1N1) is computed as it is responsible for carbon distribution in proteins. The results are not shown. It is expected for normal protein synthesis the mRNAs should contain definite amount of thymine in frame 1 for including 27% of large hydrophobic residues [4]. The frame 3 should have least amount of thymine. Frame 4 at the strand 2 should not exceed the value of frame 1. Frames 2 and 6 can have any amount of thymine. Most these principle are not followed in this Influenza virus. Though closely related number of thymine is present in frame 1, the other frames never followed the thymine distribution. In particular the frame 4 has highest number of thymine in all mRNAs of Influenza A. This gives different set of amino acid that ultimately gives different carbon distribution. This is one of the major concerns in viral proteins. Minimizing this excess thymine might give normal proteins. Frame 3 contains higher thymine than expected numbers. Because of this, more number of residues that are having higher carbon is introduced in the sequence. PB1, NA and NS1 have somewhat better thymine distribution in frame 3.
Figure 5. Comparison of carbon distribution at position 715 in native and mutated (V715S) form.
3.4. Carbon Based Mutational Study in PB1 Protein
The mutational study on any site of interest can be carried out by CARd program. One example is given here. That is mutation of valine with serine at position 715 of PB1 protein is carried out. The comparison plots are given in Figure 5. The X-axis shows the carbon fraction and the y-axis shows frequency. When the distribution is normal and centered at 0.3145 then the stretch is having normal carbon distribution. Shift in left side means it is hydrophilic in nature and the right shift means hydrophobic. Oscillation from normal distribution is also considered as abnormal carbon distribution. Here the native protein shows a normal and no waver. The maximum is at left side means hydrophilic in nature. In mutant protein, it is waver but maximum at 0.3145. It is balancing one way or the other. So according to the plot, there is not much change in mutational effect due to carbon distribution. This is in agreement experimental report that the mutation is not significant [7]. This kind of mutational study can be carried out to bring the protein into normal.
4. CONCLUSION
The role of carbon distribution in proteins of Influenza A virus is investigated here. Generally the large hydrophobic residues are the major contributors for the carbon content. Relatively the carbon contents are high in surface proteins, optimum in polymerase proteins and less in nuclear proteins. Polymerase proteins have better carbon distribution than the other proteins. The burried or exposed stretches can be better viewed from carbon distribution analysis. The analysis of mRNA sequence of Influenza A virus reveal that the adenine content is higher in all sequences. Further thymine distribution in different frames are checked. Most important observation of excess thymine in frame 4 of strand 2 is observed. This is responsible for production of protein with different amino acid composition. Unusual thymine distribution in frame 3 are observed. The thymine distribution are different in viral mRNAs compared to animals. Minimizing this excess thymine might give normal proteins. The mutational study on any site of interest for protein stabilization is also carried out. This technique can be better exploited for further improving the protein stability, activity and ultimately for gene therapy. The viral infection techniques demonstrate that the addition of CpG island in human genome can be altered by introducing mRNAs for production of proteins with adequate carbon content and distribution. CARd program can be utilised for adding appropriate proteins.
REFERENCES
- Rajasekaran, E., Asha J. and Klaus, H. (2012) Magnitude of thymine in different frames of messenger RNAs. International Journal of Bioinformatics Research, 5, 273- 275.
- Rajasekaran, E., Akila, K. and Vennila, J. (2011) Carbon contents of H1N1 proteins. International Conference on Bioscience, Biochemistry and Bioinformatics, Singapore, 26-28 February 2011, 27-28.
- Mamboya, F.A., Nsimama, P.D., Amri, E., Sharmila, J.S. and Rajasekaran, E. (2012) Carbon distribution analysis on mutations responsible for Li-Fraumeni syndrome. Journal of Biosciences, 1, 2.
- Nsimama, P.D., Mamboya, A.F., Amri, E. and Rajasekaran, E. (2012) Correlation between the mutated colour tunings and carbon distributions in luciferase bioluminescence. Computational Intelligence in Bioinformatics, 5, 105-112.
- Rajasekaran, E. (2012) CARd: Carbon distribution analysis program for protein sequences. Bioinformation, 8, 508- 512. doi:10.6026/97320630008508
- Jayaraj, V., Suhanya, R., Vijayasarathy, M., Anandagopu, P. and Rajasekaran, E. (2009) Role of large hydrophobic residues in proteins. Bioinformation, 3, 409-412. doi:10.6026/97320630003409
- Sugiyama, K., Obayashi, E., Kawaguchi, A., Suzuki, Y., Tame, J.R.H., Nagata, K. and Park, S.-Y. (2009) Structural insight into the essential PB1-PB2 subunit contact of the Influenza virus RNA polymerase. EMBO Journal, 28, 1803-1811. doi:10.1038/emboj.2009.138