Engineering
Vol. 3 No. 1 (2011) , Article ID: 3741 , 4 pages DOI:10.4236/eng.2011.31011
A QoE Assessment System in Distance Education*
1Institute of Signal Processing and Transmission, Nanjing University of Posts and Telecommunications (NUPT), Nanjing, China
2College of Computer, Nanjing University of Posts and Telecommunications, Nanjing, China
E-mail: zhangdy@njupt.edu.cn, xuyy9@yahoo.cn, chengcl@njupt.edu.cn
Received June 8, 2010; revised September 1, 2010; accepted December 17, 2010
Keywords: Binarization, Distance Education, Edge Detection, Quality of Experience (QoE)
ABSTRACT
It is a challenging task to improve the real-time property and objectivity of the effect assessment for the distance education. This paper presents a QoE (Quality of Experience) assessment system based on the attention of online user. The system captures the video frames from two cameras periodically and synchronously, using the adaptive image binarization based on the linear average threshold for the pretreatment, then processing with edge detection and filtering in the cross-directions at the same time. System gets the position of computer screen and user eyeball. Analyzing the detection results comprehensively obtains the attention of online user by some judging conditions, and finally acquires the quality of user experience. Experimental results demonstrate the feasibility and efficiency.
1. Introduction
Quality of Experience (QoE) is proposed based on the Quality of Service (QoS) [1-3]. It refers to the degree of which the service meets the users’ expectations, mainly from the users’ perspective to evaluate the performance of service. Around the world today, the network infrastructure and the environment of electronic commerce have already well advanced. Service providers attach great importance to monitor the quality of service, regarding the improving of the quality of user experience as one of the primary competition methods. With the continuous development of information network and the improvement of the network transmission speeds, QoE must be the final standard to measure the quality of network and service. Obviously, research on the QoE is of great theoretical and practical significance.
Distance education is a process to create and provide access to learning when the source of information and the learners are separated by time and distance, or both. This emerging technology is becoming widely used in universities and institutions around the globe [4,5]. The assessment of distance education has been studied by some other investigators; however, these traditional studies have almost been based upon statistical approaches. It simply collects and analyzes some basic data when the students are learning, such as the length of learning time, the question-answer situation and the satisfaction to the content of courses [6-8]. This can not objectively reflect the real feelings of students during the learning process. In many cases, students may just click on the buttons of ‘Start’ and ‘Stop’ on the page without seriously attitude. The length of learning time counted from these records can not truly reflect the learning situation or the teaching effect during the period. Students are likely to do something else in front of the computer, even have left the computer.
In order to overcome this defect, some distance education systems use video monitoring system. As the number of students participated in is large, not all the details can be noticed by the teacher or staff in time. On the other hand, face recognition is used to verify whether the user is right in front of the computer. However, most of these systems just consider if the user face is towards the screen. Actually, user can put his eyes in the other direction at the same time. Consequently, the results based only on facial features, can not fully reflect whether the user is concerning about the services provided. Therefore, this paper presents a new QoE assessment system to meet the efficient and real-time requirements.
The paper is organized as follows: Section 2 describes the design of QoE assessment system; In Sections 3 and 4, the improved algorithms used in the system are described in detail and compared; Section 5 shows the experimental results and analysis; and the last section is the conclusion.
2. Design of QoE Assessment System
The distance education generally use the B/S architecture, composed by the computer (front-end) that the user is using and the network server (back-end) which stores the teaching content. The QoE assessment system proposed in this paper adopts the acquisition system at the frontend as shown in Figure 1. It captures the video frames from two Bluetooth cameras placed on the user helmet periodically and synchronously to get the user learning statuses.
The basic principle of the system is: the system use two cameras; camera one is parallel with user sight, capturing the computer screen that the user is using; the other one is right opposite to the user’s right eye, capturing the movement of user’s eyeball. They take photos simultaneously and send the images to the computer by Bluetooth for further processing. During the initialization, user should first adjust the helmet and the cameras and records the position of the screen and user eyeball as the basic statuses for further reference. The system captures two images periodically when it works. After image processing the system compares the current condition with the basic statuses, system obtains whether the user concentrate on learning by the change of the orientation of user’s head and sight. The assessment results will be send to server by network immediately, and system keeps every record to acquire the changes of attention during the study. According to the results, teachers and staff can adjust the teaching contents and methods in time. The main steps of the assessment system are as follows:
Step 1: At the system initialization, user provides some parameters through the configuration interface, such as the computer type and screen size. Then the user manually adjusts the orientation of cameras, so that the computer screen and the eye is right in the center of each video image shown in the system interface when user is in natural posture using the computer. After the adjustment, system records the positions of the screen and the eyeball as the basic statuses.
Step 2: The two cameras on the helmet capture the video images of computer screen and user eye periodically and synchronously. For extracting the objects from the original images, system adopts the adaptive image
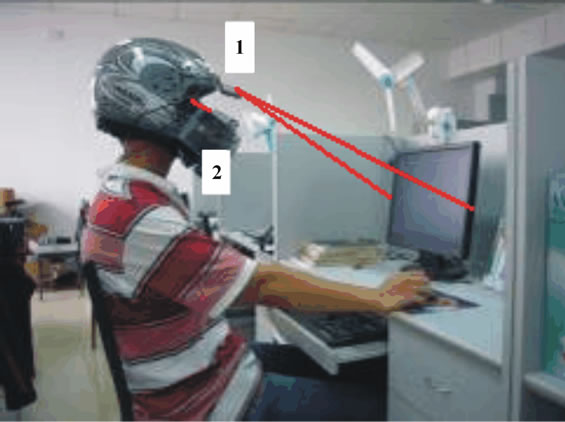
Figure 1. Front-end acquisition system.
binarization based on the linear average threshold for the pretreatment. After that, for screen binary image, processing with edge detection and filtering in the crossdirections at the same time, then the system extracted the four vertices of the screen to get the screen position; for user eye binary image, the system uses the circular Hough transform for eyes detection in facial images [9,10] to get the eyeball position in the orbit, then analyzes the direction of user sight.
Step 3: Comparing the detection results with the basic statuses, system obtains the user learning states and the QoE assessment results by some judging conditions.
Step 4: The assessment results are delivered to backend server through network for statistics and analysis. Front-end can also display the results and appropriate information.
Above all, the key to the assessment system is the real-time and efficient processing on the images captured by cameras. It concludes the image binarization, edge detection and filtering.
3. Adaptive Image Binarization Based on the Linear Average Threshold
In computer vision, segmentation refers to the process of partitioning a digital image into multiple segments (Target objects and the background). Thresholding is the simplest method of image segmentation [11-14]. From a grayscale image, thresholding can be used to create binary images, and the formulation is as follows.
 (1)
(1)
Where T is the average threshold;  is the grayscale image;
  is the processed image.
Traditional thresholding methods mainly include global thresholding and local thresholding [11]. The global thresholding obtains globally optimal threshold from the entire information of the image. And the latter method separates the original image into several subimages and determines each optimal threshold on each sub-image using the global thresholding, and then comprehensive obtains the final threshold. The drawback of the global thresholding is that, for some images, in particular small target images, it is difficult to separate the target objects from background with threshold obtained from the whole image histogram because the gray information makes small contribution to target image, while the local threshold method could make good result at this situation. The shortage of local thresholding is slow processing, and it could not guarantee the image connectivity and is easy to generate artifacts. Bernsen [15] is a typical local thresholding algorithm. The center pixel of window is given the average value of the maximum and minimum value of pixels in the window in gray level. But the processing result has obvious ghosts.
The QoE assessment system requires real-time processing and analysis on the images captured synchronously by two cameras. It is necessary to improve the system efficiency and reduce resource consumption. This paper provides an adaptive image binarization based on the linear average threshold which combines with the advantages of the global thresholding and the local thresholding. First set n (n ≥ 0) horizontal lines and m (m ≥ 0) vertical lines (n = 9, m = 9 here), keeping equal distance between adjacent lines. The threshold of the whole image is the average grayscale threshold of these lines. It is calculated as follows,
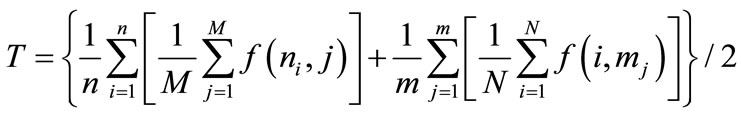 (2)
(2)
Where N and M are rows and columns of the image respectively,  is the grayscale of the pixel
 ,
,  is the abscissa of horizontal line
  while
while  is the ordinate of vertical line
 .
.
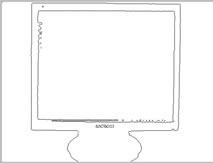
In Windows XP, with the CPU of 1.6 G Core Duo processor and 2 G RAM, the codes of each algorithm run in matlab 7.10.0 for the comparison of the processing effectiveness. The processing time depends on the image size and algorithm. The original image is 640 × 480. Image binarization results and the processing time are shown in Figure 2 and Table 1. It can be learned that the improved method improves system efficiency on the premise of ensuring the image’s quality.
4. Filtering and Edge Detection in the Cross-Directions
There are still many noises after the original image binaryzation. Linear smoothing filtering and median filtering are generally adopted to eliminate the image noise.
 (a)
(a) (b)
(b) (c)
(c)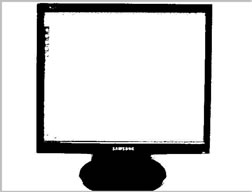 (d)
(d)
Figure 2. Binarization results: (a) Original Image, (b) Global Thresholding, (c) Local Thresholding (Bernsen, w=3), (d) Improved Binarization.
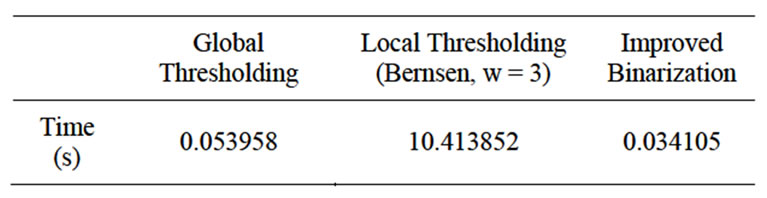
Table 1. Average processing time.
Linear smoothing filtering is easy to design and performs well in the occasions where the spectral characteristics of signal and noise are significantly different. But while dealing with the signal with steep edges (that is, a very wide spectrum), the image edge will be blurred and the pulse noise can not be completely eliminated. Median filter keeps the edge out of disturbing when it removes impulse noise. But as for large areas of noise pollution (such as white Gaussian noise), it is less able to smooth the noise under the mean-square error criterion [16-18]. And among the numbers of edge detection algorithms, Soble [19] is widely used but easy to misjudge the edge points.
The images processed in this paper, such as computer screen and user eye, are continuous and have a certain length. The objects of the image, including slashes, have a certain width and consist of pixels mutually perpendicular. In order to further weaken excess noises of the image and improve system efficiency and reduce resource consumption in the mean time, this paper presents edge detection and filtering in the cross-directions (left, right, up and down) on the image after binaryzation. Algorithm steps are as follows, where g(x, y) is the binary image after treatment, and h(x, y) is used to store the final image.
Step 1: Scan pixels one by one. If the current pixel g(x,y) is 0, turn to step 2; otherwise repeat step 1 until the end.
Step 2: If the pixel g(x-1,y) = 1 and g(x+1,y) = 0, g(x,y) is the left of edge; set h(x,y) = 0, return to step 1;
If the pixel g(x-1,y) = 0 and g(x+1,y) = 1, g(x,y) is the right of edge; set h(x,y) = 0, return to step 1;
If the pixel g(x-1,y) = 0 and g(x+1,y) = 0, g(x,y) is inside some object; set h(x,y) = 1, return to step 1;
If the pixel g(x-1,y) = 1 and g(x+1,y) = 1, g(x,y) is blank; set h(x,y) = 0, turn to step 3;
Step 3: If the pixel g(x,y-1) = 1 and g(x,y+1) = 0, g(x,y) is the top of edge; set h(x,y) = 0, return to step 1;
If the pixel g(x,y-1) = 0 and g(x,y+1) = 1, g(x,y) is the bottom of edge; set h(x,y) = 0, return to step 1;
If the pixel g(x,y-1) = 0 and g(x,y+1) = 0, g(x,y) is inside the object; set h(x,y) = 1, return to step 1;
If the pixel g(x,y-1) = 1 and g(x,y+1) = 1, g(x,y) is the top of edge; set h(x,y) = 0, return to step 1;
After the processing, the system gets the edge of the images and removes the discrete noise.
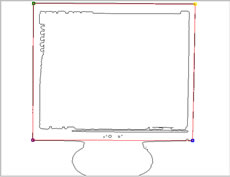
The comparison of each algorithm runs in matlab. Image filtering and edge detection results and the processing time are shown in Figure 3 and Table 2.
As shown in the Figure 3 and the Table 2, while the detection result is good, the improved algorithm can reduce the processsing time to raise the efficiency of whole QoE assessment system in distance education, which requires large quantity of continuous image processing for long time.
5. Experimental Results and Analysis
5.1. The Results of Screen-Position Detection
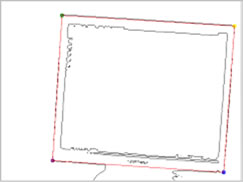
The assessment system captures the screen images periodically when user is learning. After processing with the binarization and edge detection method this paper presents, the system obtains the screen position. It can be found that there are four typical statuses of user head as shown in Figure 4 to Figure 7.
 (a)
(a)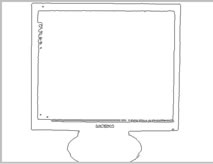 (b)
(b)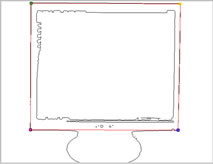 (c)
(c)
Figure 2. Binarization results: (a) Original Image, (b) Global Thresholding, (c) Local Thresholding (Bernsen, w = 3), (d) Improved Binarization.
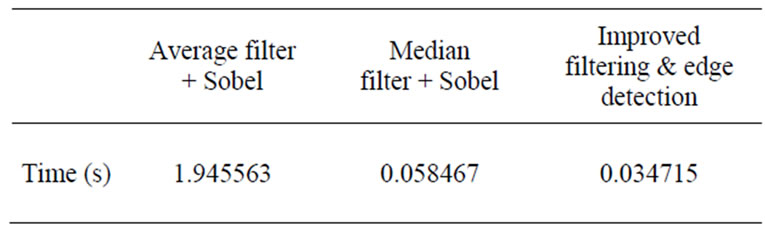
Table 2. Average processing time.
 (a)
(a)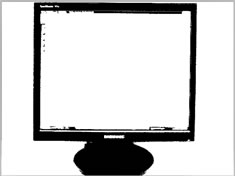 (b)
(b) (c)
(c)
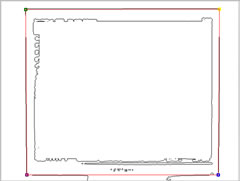
Figure 4. Towards the screen (basic statuses): (a) Original Image, (b) Binarization, (c) Filtering & edge detection.
 (a)
(a)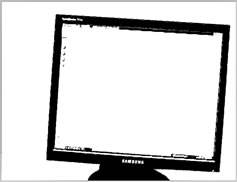 (b)
(b) (c)
(c)
Figure 5. Move leftward: (a) Original Image, (b) Binarization, (c) Filtering & edge detection.
 (a)
(a)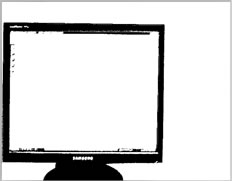 (b)
(b)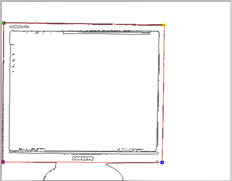 (c)
(c)
Figure 6. Move rightward: (a) Original Image, (b) Binarization, (c) Filtering & edge detection.
 (a)
(a)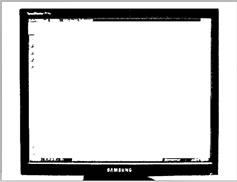 (b)
(b) (c)
(c)
Figure 7. Move forward and backward: (a) Original Image, (b) Binarization, (c) Filtering & edge detection.
When the screen is beyond the scope that the camera can capture, the user can not watch the computer screen normally. This shows that the user has had the face towards the outside of the screen, no attention to current learning content.
From the processed image, the system extracted the coordinates of four vertices of the screen. Afterward the system calculates the length of the upper edge of the screen and compares it with the corresponding edge of the basic state to get the forward or backward movement of user head; Calculating and comparing the slope of the upper edge of the screen to get the inclination of user head; Calculating and comparing the coordinates of the screen diagonal midpoint (the center of the screen) to get the movement of the screen and deflection of user head. By summarizing the results the system gets the details of the direction of user head.
5.2. The Results of Sight Detection
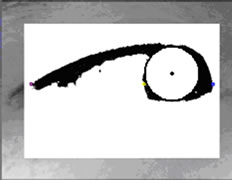
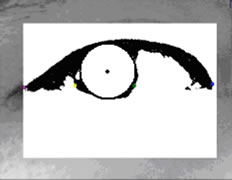
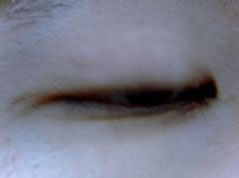
Analyzing the eye images while the user is studying normally, there are some typical states of sight as shown in Figure 8 to Figure 11. Detection results are four cases, corresponding to the four statuses of user sight: forward, to the left, to the right, and blink or eye closed.
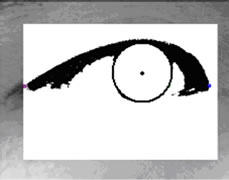
The eye detection takes the size of eyeball of basic status as reference standard because it changes little when user is learning normally. If there is too much difference between the detection result and the reference standard, it shows that the user is blinking or the eye is closed, and the user does not concern about the learning content.
After the processing, system obtains the coordinates of the user eyeball center, and compares them with the basic status to get the movement of user eyeball, finally judges the direction of user sight at this moment.
 (a)
(a) (b)
(b)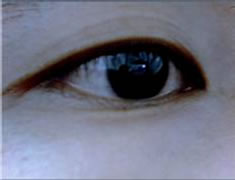 (c)
(c)
Figure 8. Original position(basic status) : (a) Original Image, (b) Binarization, (c) Eye detection.
 (a)
(a)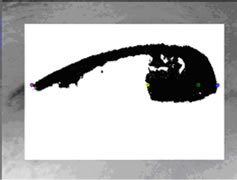 (b)
(b)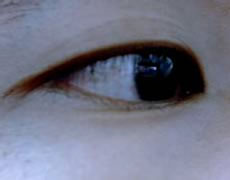 (c)
(c)
Figure 9. Move leftward: (a) Original Image, (b) Binarization, (c) Eye detection.
 (a)
(a)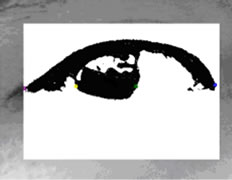 (b)
(b)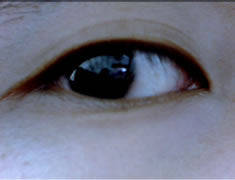 (c)
(c)
Figure 10. Move rightward: (a) Original Image, (b) Binarization, (c) Eye detection.
 (a)
(a) (b)
(b)
Figure 11. Blink or eye closed: (a) Original Image, (b) Binarization.
5.3. Basic Judging Conditions and the Results Analysis
By comprehensively analyzing the change of the orientation of user’s head and the direction of sight, the system obtains how the user concentrates on learning. After comparing the detection results with the basic statuses, some basic judging conditions and QoE results can be learned as shown in Table 3.
According to the basic judging conditions mentioned above, the system analyzes the results of detection. Based on the magnitude of the changes of directions of user’s head and sight, it can be learned whether the user is paying attention to the content the distance education provided. This paper adopts 5-point scale to describe the QoE assessment results. The experimental system shows the results of detection and appropriate information as in Figure 12.
This QoE experimental assessment system has been tested in NUPT campus network environment with the course of Software Engineering. The system and the instructional software are installed on the server of one campus laboratory while 105 students accept the distance education with the front-end acquisition system in the other campus 50 kilometers away, connected by the campus LAN. One course lasts 90 minutes. Considering the differences of individual and network busyness at different times, the tests are arranged in the morning, afternoon and evening respectively. A total of 10 tests is conducted. The system sampling interval is 10 seconds and for every student there are 540 testing results for every course. The statistical results are listed in Table 4. It shows that in more than 80% of the time, the students pay their attentions on the teaching content. It is consistent with the remote monitoring of the actual situation.
The user wears the experimental helmet. When user moves his head, changes facial expressions or the illumination changes, the position of the computer screen and the user eyeball can be detected well. And the comprehensive analysis of the results is satisfactory. System is not sensitive to the change of facial expressions but the front light and side light have certain effect. When the head turns too fast, the accuracy will decrease due to fuzzy images taken.
6. Conclusion
Along with the continuous improvement of network popularization, QoE has become one of the standards to measure the quality of network service. This paper designs a QoE assessment system to obtain real-time quality of experience for the users in network distance education. In order to meet the system’s efficient and real-time
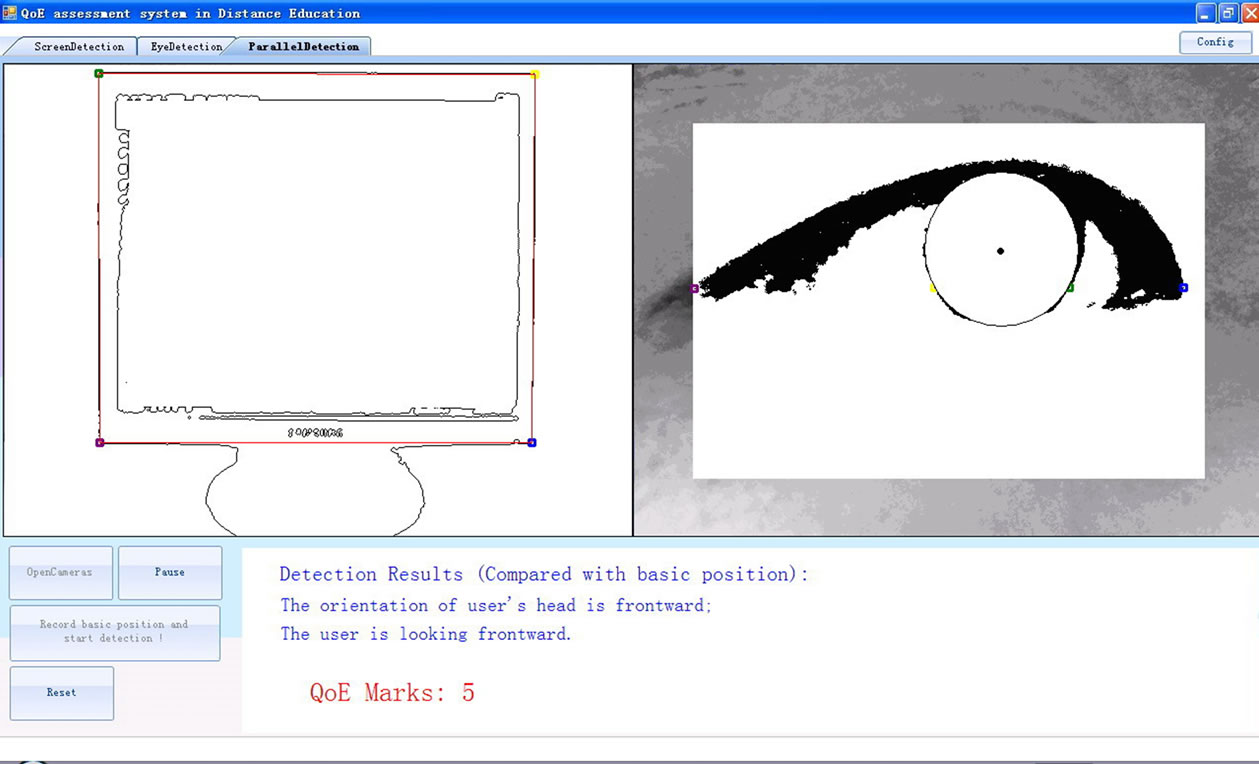
Figure 12. Final results.

Table 3. Basic judging conditions and QoE result.
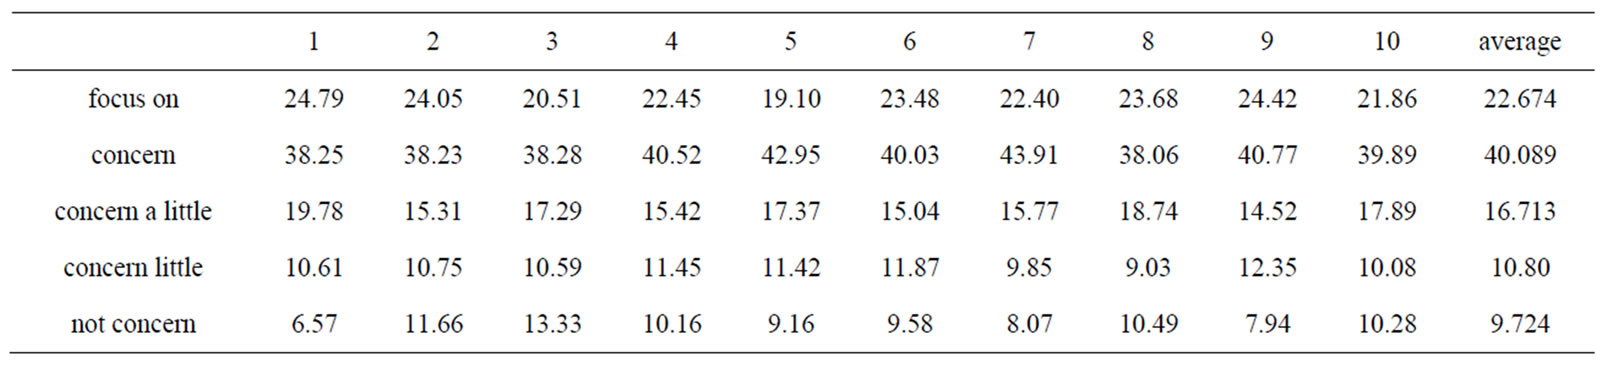
Table 4. The statistical results from tests (% of test time).
requirements, the paper proposes an adaptive image binarization based on the linear average threshold and edge detection and filtering in the cross-directions. The results show that this QoE assessment system works well. It can be applied to network services, such as distance education, online VOD and web shopping. With this assessment system, service providers can get the quality of user experience through the changing of users’ concern for the services provided and adjust the services timely.
7. Acknowledgment
The authors would like to thank Prof. Haibo Li in Signal Processing in the Department of Applied Physics and Electronics (TFE), Umeå University, Sweden, for his recommendations, constant support and encouragement to write the paper.
8. REFERENCES
- M. Fiedler, T. Hossfeld and T. G. Phuoc, “A Generic Quantitative Relationship between Quality of Experience and Quality of Service,” IEEE Transactions on Network, Vol. 24, No. 2, March-April 2010, pp. 36-41.
- H. J. Kim and S. G. Choi, “A Study on a QoS/ QoE Correlation Model for QoE Evaluation on IPTV Service,” The 12th International Conference on Advanced Communication Technology (ICACT), Vol. 2, February 2010, pp. 1377-1382.
- J. Y. Zhang, Y. G. Wang and B. Rong, “QoS/QoE Techniques for IPTV Transmissions,” IEEE International Symposium on Broadband Multimedia Systems and Broadcasting (BMSB’09), Vol. 5, May 2009, pp. 1-6. doi:10.1109/ISBMSB.2009.5133817
- B. Towie, “Distance Learning on the Rise,” Metro Canada, November 2008.
- D. A. Harris and C. Krousgrill, “Distance Education: New Technologies and New Directions,” Proceedings of the IEEE, Vol. 96, No. 6, 2008, pp. 917-930. doi:10.1109 /JPROC.2008.921612
- C. H. Muntean, “Improving Learner Quality of Experience by Content Adaptation Based on Network Conditions,” Computers in Human Behavior, Vol. 24, No. 2, July 2008, pp. 1452-1472. doi:10.1016/j.chb.2007.07.016
- R. Acevedo, F. Martinez and D. Gonzalez, “Case-Based Reasoning and System Identification for Control Engineering Learning,” IEEE Transactions on Education, Vol. 51, No. 2, May 2008, pp. 271-281. doi:10.1109/TE.2007. 909361
- A. A. Hopgood and A. J. Hirst, “Keeping a DistanceEducation Course Current Through E-Learning and Contextual Assessment,” IEEE Transactions on Education, Vol. 50, No. 1, 2007, pp. 85-96. doi:10.1109/TE.2006.88 8905
- W. M. K. W. M. Khairosfaizal and A. J.Nor'aini, “Eyes Detection in Facial Images Using Circular Hough Transform,” Proceedings of 2009 5th International Colloquium on Signal Processing and Its Applications, Vol. 3, March 2009, pp. 238-242.
- J. G. Gao, S. Q. Zhang and W. Lu, “Application of Hough Transform in Eye Tracking and Targeting,” 9th International Conference on Electronic Measurement & Instruments (ICEMI'09), Vol. 3, August 2009, pp. 751- 754.
- A. Dawoud and M. S. Kamel, “Iterative Multimodel Subimage Binarization for Handwritten Character Segmentation,” IEEE Transactions on Image Processing, Vol. 13, No. 9, pp. 1223-1230, 2004. doi:10.1109/TIP.2004.8331 01
- R. Medina-Carnicer, F. J. Madrid-Cuevas, N. L. Fernández-García and A. Carmona-Poyato, “Evaluation of Global Thresholding Techniques in Non-Contextual edge Detection,” Pattern Recognition Letters, Vol. 26, No. 10, July 2005, pp. 1423-1434. doi:10.1016/j.patrec. 2004.11.024
- K. L. Chung, W. J. Yang, W. M. Yan and C. C. Wang, “Demosaicing of Color Filter Array Captured Images Using Gradient Edge Detection Masks and Adaptive Heterogeneity-Projection,” IEEE Transactions on Image Processing, Vol. 17, 2008, pp. 2356-2367. doi:10.1109/ TIP.2008.2005561
- R. Medina-Carnicer and F. J. Madrid Cuevas, “Unimodal Thresholding for Edge Detection,” Pattern Recognition, Vol. 41, No. 7, July 2008, pp. 2337-2346. doi:10.1016/j. patcog.2007.12.007
- J. Bernsen, “Dynamic Thresholding of Gray Level Image,” ICPR’86: Proceedings of International Conference on Pattern Recognition, Berlin, 1986, pp. 1251-1255.
- K. K. V. Toh, H. Ibrahim and M. N. Mahyuddin, “Saltand-Pepper Noise Detection and Reduction Using Fuzzy Switching Median Filter,” IEEE Transactions on Consumer Electronics, Vol. 54, No. 4, November 2008, pp. 1956-1961. doi:10.1109/TCE.2008.4711258
- Z. Pan, G. Healey, M. Prasad and B. Tromberg, “Face Recognition in Hyperspectral Images,” IEEE Transactions on Pattern Analysis and Machine Intelligence, Vol. 25, No. 12, December 2003, pp. 1552-1560. doi:10.1109/ TPAMI.2003.1251148
- P. Y. Chen and C. Y. Lien, “An Efficient Edge-Preserving Algorithm for Removal of Salt-and-Pepper Noise,” IEEE Signal Processing Letters, Vol. 15, pp. 833-836, 2008. doi:10.1109/LSP.2008.2005047
- I. Sobel and G. Feldman, “A 3x3 Isotropic Gradient Operator for Image Processing,” Pattern Classification and Scene Analysis, 1973, pp. 271-272.
NOTES
*This work was supported by Joint European Project ICT Learning Pentagram [CD_JEP-32162-2004], Swedish Research Links [No.348- 2008-6212], the National Natural Science Foundation of China [61071093], and the project sponsored by SRF for ROCS, SEM [NJ209002].