Circuits and Systems
Vol.07 No.09(2016), Article ID:68334,11 pages
10.4236/cs.2016.79191
Fuzzy Based Intelligent Monitoring of Critical Lines in the Restructured Power Market
S. Rajasekaran1*, S. Sathiyamoorthy2
1Department of Electrical & Electronics Engineering, M.A.M College of Engineering and Technology, Anna University, Chennai, India
2Department of Electronics & Instrumentation Engineering, J.J College of Engineering and Technology, Anna University, Chennai, India

Copyright © 2016 by authors and Scientific Research Publishing Inc.
This work is licensed under the Creative Commons Attribution International License (CC BY).
http://creativecommons.org/licenses/by/4.0/


Received 9 April 2016; accepted 5 May 2016; published 14 July 2016
ABSTRACT
Restructured electric market environment allows the power wheeling transactions between the power producers and customers to meet the growing load demand. This will lead to the possible of congestion in the transmission lines. The possible contingencies of power components further worsen the scenario. This paper describes the methodology for the identification of critical transmission line by computing the real power and reactive power performance indices. It also demonstrates the importance of fuzzy logic technique used to rank the transmission lines according to the severity and demonstrated on IEEE-30 bus system.
Keywords:
Contingency Analysis, Active Power Performance Index, Reactive Power Performance Index, Fuzzy Logic, Wheeling Transaction

1. Introduction
Most of the electric utilities across the world are undergoing restructured process to meet the growing load demand. This will introduce competition in generation, transmission and distribution sectors. This competitive environment provides the platform to deliver the power efficiently by the power producers at affordable price for the customers. This restructured power market structure allows the power transactions between the power producers and customers through wheeling transactions [1] [2] . Generally, wheeling transactions are classified into bilateral and multilateral entities. The feasibility of wheeling transaction in the competitive restructured power market is very high. In the power exchange structure, the system operator allows the wheeling transactions without major tasks, but in the power pool structure the system operator has to check out the security of the transmission lines by allowing these transactions. Hence the system operator must do the power flow analysis with the transactions and check out the feasibility condition of the network.
Real power performance index is the measure of real power carried by the transmission lines with respect to its capacity. Many researchers have described the importance and necessity of real power performance index applied to practical utility system [1] - [3] . Since the transmission system carries the reactive power also, it is mandatory to compute the feasibility of reactive power index by permitting the wheeling transactions. Christie et al. presented the operation, analysis and management of power flow in restructured power market [1] . It also explores the capability of the transmission system in the restructured environment. The chances of congestion due to wheeling transaction are explained on the practical utility system.
Sood et al. presented the detailed literature survey about the concept of wheeling and it impacts on the power flow in restructured power market. The methodologies, regulatory issues, future planning of the restructured power market are explained with the supportive papers [2] . This paper also had provided a review on utilities and independent system operator (ISO). Dommel et al. proposed a method to solve the power flow using Newton’s method and also provided the solution for optimal adjustment of control parameters using gradient method [3] . Fu et al. described the ranking of transmission lines using contingency analysis based on severity index. The paper explains the stability of rotor angle of the generating units during contingency analysis [4] . Davis et al. proposed two methodologies namely impact tracking structure (ITS) and overload tracking structure (OTS) to screen multiple outage contingencies [5] . Peng et al. proposed efficient contingency ranking of transmission lines using real power performance index. Artificial neural network (ANN) is used to do the contingency ranking for the practical power system [6] .
Kamwa et al. proposed a Dynamic Security Assessment (DSA) for contingency ranking with the help of short term Fourier transform. A hybrid intelligent technique is introduced using fuzzy logic and neural network to improve the assessment of reliability and security [7] . Othman et al. proposed a method of contingency ranking for a critical generators using participation factor index [8] . Many authors explored the role of voltage assessment for the practical utility system is demonstrated during contingency conditions [9] - [11] . Li et al. proposed a global power flow analysis based transmission contingency analysis, which integrates both the transmission and distribution power flow [12] . A solution was given to reduce the communication burden also discussed. Gnanadass et al. proposed an optimal power flow for congestion management with bilateral and multilateral transactions. An evolutionary programming algorithm was introduced to relieve the congestion by taking into account of bids in the generators [13] . Paramasivam et al. proposed a Dynamic Voltage Control Area (DVCA) method to classify dynamic contingencies into different clusters based on their behavioral patterns [14] . The computation of real power performance index for a sample network is detailed in [15] . Ashwanikumar et al. proposed the importance of reactive power computation index is demonstrated on the power market for different credible condition [16] . Yih Hsu et al. proposed fuzzy based decision for ranking the critical transmission lines using real power index and the magnitude of voltages at the different buses of the power system are also explained [17] . Ozdemir et al. proposed fuzzy based decision for ranking the critical transmission lines using MW contingency ranking at the different buses is explained [18] .
The intuition of this paper is to identify the critical lines and monitor the power flow in the restructured power market environment with wheeling transactions. Ranking the critical lines using real power index and reactive power index leads to masking effect. Hence the fuzzy logic technique is used to identify the critical lines in the market using the real power performance index (PIp) and reactive power performance index (PIv) of the system.
2. Methodology
The objective of the work is to determine the power flow in all the transmission lines.
 (1)
(1)
where, Ni―Number of transmission lines;
Pi―Number of generators in MW.
The system constraint is given as follows,
 (2)
(2)
where Pd is the total load of the system and Pl is the transmission losses of the system.
The power flow equation of the power network
 (3)
(3)
where,

where,
Pi and Qi are respectively calculated real and reactive power for PQ bus i;
 and
and  are respectively specified real and reactive power for PQ bus i;
Pm and  are respectively calculated and specified real power for PV bus m; and
 and q are voltage magnitude and phase angles of different buses.
The inequality constraint on real power generation Pgi of each generation i
 (4)
(4)
where,
 and
and  are minimum and maximum value of real power generation allowed at generator i respectively.
The inequality constraint on voltage of each PQ bus
 (5)
(5)
where,
 and
and  are respectively minimum and maximum voltage at bus i.
Power limit on transmission line
 (6)
(6)
where,
 is the maximum rating of transmission line connecting bus p and q.
3. Contingency Analysis
Contingency analysis is the simulation analysis that employs various contingencies associated with probable events, to come up with the most optimal responses under the circumstances. By analyzing the effects of contingency events in advance, problems and unstable situations can be identified, critical configurations can be recognized, operating constraints & limits can be applied and corrective actions can be planned. The ranking of dangerous or unstable contingencies according to their order of severity is known as contingency ranking. By contingency ranking the system operator can be cautioned about the vulnerable lines present in the system and he can preset the corrective measures in case of outage of that line.
In this type of analysis, the objective is to find overloads or voltage violations under such contingencies and the proper measures that are needed to alleviate these violations. Identification of these contingencies and determination of the corrective actions often involve exhaustive load flow calculations. Contingency analysis is an important aspect of power system security assessment. As various probable outages compose a “contingency set”, some cases in the contingency-set may lead to transmission line over loads or bus voltage limit violations during power system operations. Such critical contingencies should be quickly identified for further detailed evaluation or, where possible, corrective measures taken. The process of identifying these critical contingencies is referred to as “contingency analysis”.
3.1. Performance Index
The objective of steady state contingency analysis is to investigate the effects of transmission unit outages on MVA line flows and bus voltage magnitudes. For this purpose performance indices values of bus voltage magnitude and apparent power are calculated with masking effect taken into account. An index for quantifying the extent of line overloads may be defined in terms of performance index. Contingencies are ranked in an approximate order of a scalar performance index (PI). These indices are calculated using the conventional power flow algorithms for individual contingencies. It is a scalar value. The structure of the PI and the proper choice of the valuation criterion are the key to the quality of the automatic contingency selection. PI serves as a penalty function for limit violations. As a measure of the impact of each contingency on the system, the PI should have essentially two aspects of functions:
There are two kinds of performance index namely active power performance index (PIp) and reactive power performance index (PIv) respectively.
3.1.1. Active Power Performance Index (PIp)
PIp reflects the violation of line active power flow
 (7)
(7)
where,
Pi is active power flow in line i;
Pimax is maximum active power flow in line i;
m is the masking factor;
L is the total number of transmission lines in the system.
The value of maximum power flow in each line is calculated using the formula
 (8)
(8)
where,
Vi = Voltage at bus i obtained from FDLF solution;
Vj = Voltage at bus j obtained from FDLF solution;
X = Reactance of the line connecting bus i and bus j.
3.1.2. Reactive Power Performance Index (PIv)
Another performance index parameter which is used is reactive power performance index corresponding to bus voltage magnitude violations. It is mathematically denoted using the formula given below.
 (9)
(9)
where Vi = Voltage of bus i;
Vimax and Vimin are maximum and minimum voltage limits;
Vinom is average of Vimax and Vimin;
Npq is total number of buses in the system;
m is the masking factor.
The reactive power performance index (PIv) can be calculated using the maximum and minimum voltage limits, generally a margin of ±5% is kept for assigning the limits i.e., 1.05 p.u. for maximum and 0.95 p.u. for minimum. It is to be renowned that the above performance indices are supportive for performing the contingency selection for line contingencies only. The PI value can be obtained for each contingency the lines in the bus system are being numbered as per convenience, then a particular transmission line at a time is simulated for outage condition and the individual power flows and the bus voltages are being calculated with the help of Newton Raphson load flow solution.
4. Fuzzy Logic Based Ranking of Critical Transmission Lines
Fuzzy logic is a form of many-valued logic or probabilistic logic; it deals with reasoning that is approximate rather than fixed and exact. In contrast with traditional logic, they can have varying values, where binary sets have two-valued logic, true or false, fuzzy logic variables may have a truth value that ranges in degree between 0 and 1. Fuzzy logic has been extended to handle the concept of partial truth, where the truth value may range between completely true and completely false. Furthermore, when linguistic variables are used, these degrees may be managed by specific functions. Fuzzy logic began with the 1965 proposal of fuzzy set theory by Lotfi Zadeh [19] . Fuzzy logic has been applied to many fields, from control theory to artificial intelligence.
The fuzzy set theory is developed for contingency ranking of power system. It is necessary to examine whether a power system can remain in a secure and reliable operating state under contingency conditions. Then Newton Raphson load flow method is performed to estimate post-contingent quantities (line flows, bus voltages) for other contingency cases. Based on system operators’ past experience, each post-contingent quantity is assigned a degree of severity according to the potential damage that could be imposed on the power system by the quantity, should the contingency occurs. Since human experts tend to use linguistic variables to describe the degree of severity, uncertainty or imprecision exists in knowledge representation, an approach based on fuzzy set theory is developed to deal with the imprecision of linguistic terms. With the degree of severity for each quantity in a contingency case described by a fuzzy set, a set of fuzzy reasoning procedures are developed to generate the real power performance index (PIp) and reactive power performance index (PIv) for each contingency case. Ranking the critical lines using real power index and reactive power index leads to masking effect. Hence the fuzzy logic technique is used to identify the critical lines in the market. Those contingency cases with high degree of severity are provided to system operators for further examination in order to decide the appropriate actions that should be taken in the real time before the system moves towards instability. The step by step procedure to incorporate the contingency ranking analysis in the restructured power market is given in the Figure 1.
5. Results & Discussion
The main intuition of the work is to perform the contingency selection process, by calculating active and reactive power performance indices PIp and PIv respectively. The computation of these indices has been carried out by load flow analysis using Newton Raphson method. The study has been carried out and demonstrated on IEEE 30 bus test system. The bus data and line data for the IEEE 30 bus system are taken from [20] . The IEEE 30 bus system has 6 generators, 24 load buses, 41 transmission lines and the load of 283.4 MW. The contingency analysis is carried out on the 10 No’s of critical transmission lines identified by the magnitude of power flow in the system. In all other lines, the impact of the contingency is not significant.
The following case studies are carried out on the test system to demonstrate the importance of contingency ranking and the simulation is carried out in the power system tool box in MATLAB environment.
5.1. Contingency Analysis without Wheeling Transaction
The active and reactive power performance indices are calculated using the formula given in Equation (7) and (9) by considering the outage of (n − 1) line and the calculated indices are tabulated in Table 1. It was observed that the ranking of PIp and PIv is different for all the contingency cases. In order to incorporate the impact of real and reactive power indices, a decision making technique namely fuzzy logic is proposed to eliminate the masking effect in the ranking of the lines. This will give a clear insight about the combination effect of PIp and PIv.
The performance indices and contingency ranking using fuzzy logic for the IEEE 30 bus system is given in Table 1.
After the fuzzy ranking, it is observed that the outage of line number 01 is the most vulnerable and its outage will consequence a huge impact on the entire system and other ranking of the lines are also given in the above table. Fuzzy logic technique gives the cumulative effect of both real and reactive power indices and provides fair results by eliminating masking effect.
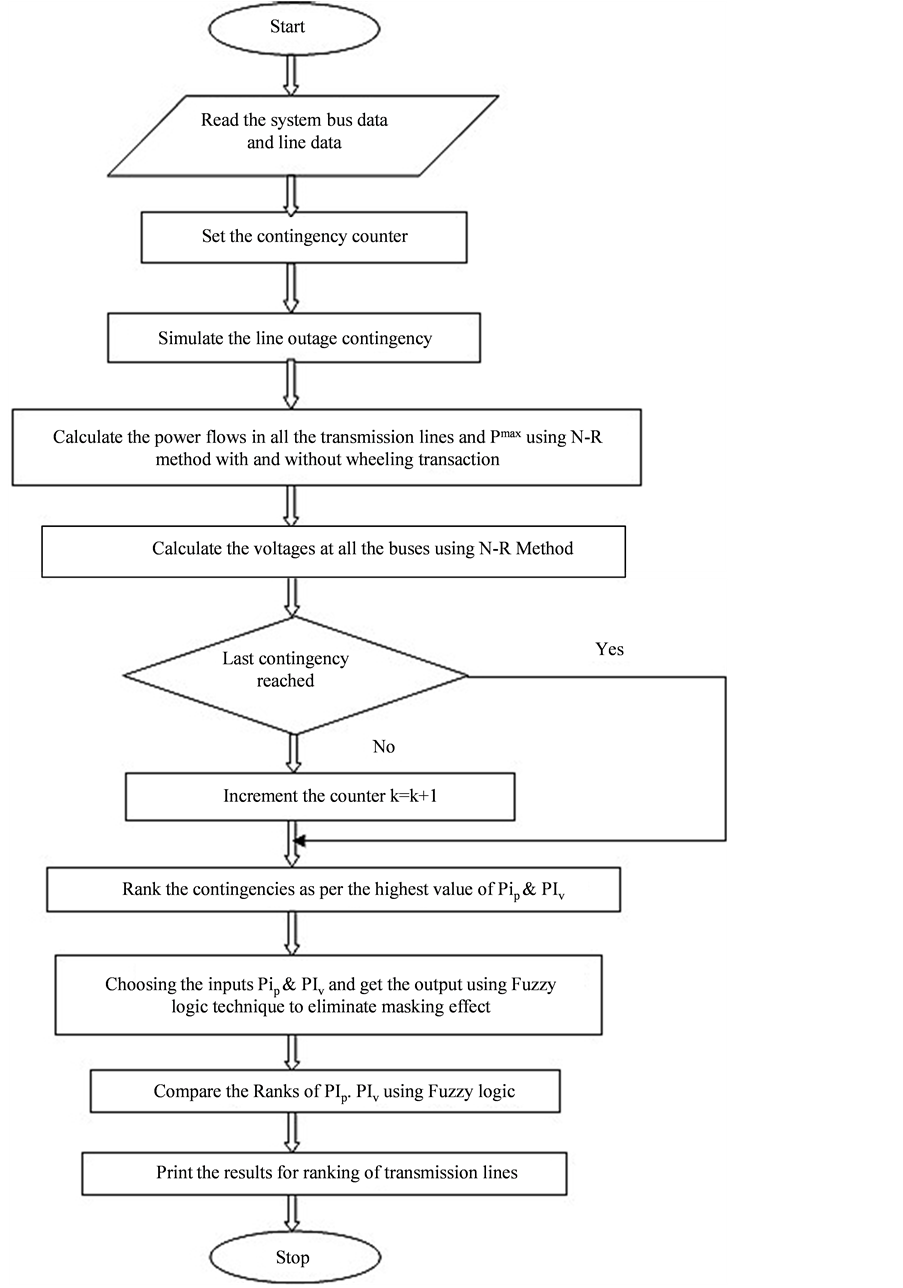
Figure 1. Flow chart for fuzzy logic implementation to contingency analysis.

Table 1. Performance indices & contingency ranking using fuzzy logic for practical power system before wheeling transaction.
Table 2. Bilateral transactions.
Table 3. Multilateral transaction.

Figure 2. Comparison of real power flow in the lines after wheeling transaction against their thermal limit.
5.2. Contingency Analysis with Wheeling Transactions
The bilateral and multilateral transactions are carried out to convert the test system into a restructured environment. Then the load flow analysis is carried out for 10 lines contingency case with transactions. The power injection and extraction details of the wheeling transaction are given in Table 2 and Table 3.
The Figure 2 shows that, the comparison of real power flow in the lines with wheeling transactions after the line 01 out. It was observed that the power flow in all the lines is within the limit against the line rating of their respective lines even after wheeling transaction.
The Figure 3 shows that the voltage profile of IEEE-30 bus system after wheeling transactions with line 01 outage.
The performance indices and contingency ranking using fuzzy logic for the IEEE-30 bus system is given in Table 4.
The output of fuzzy technique to rank the credible contingency is shown in Figure 4.

Figure 3. Voltage profile after wheeling transactions.
Table 4. Performance indices & contingency ranking using fuzzy logic for practical power system after wheeling transactions.

Figure 4. Fuzzy rule editor.

Figure 5. Comparison of real power performance index [PIp].

Figure 6. Comparison of reactive power performance index [PIv].
From Table 4, it is inferred that the PIp value of line No. 2 is more vulnerable and PIv value of line No. 5 is more critical. This will lead to masking of critical transmission line in the system. Hence fuzzy logic based rule base is implemented to consider the combined effect of PIp and PIv in identifying the credible contingency lines as illustrated in Figure 4. The comparative analysis of PIp and PIv values of the system with and without wheeling transaction is given in Figure 5 and Figure 6 respectively.
6. Conclusion
The power flow analysis in the restructured power environment for IEEE 30 bus test system is carried out with and without wheeling transactions by satisfying the system constraints. The ranking of transmission lines due to the power flow is carried out by computing PIp and PIv values. The masking effect of ranking is eliminated by incorporating fuzzy technique in the above methodology. This work gives a clear insight about the importance of the fuzzy decision making technique to rank the critical transmission lines in the restructured power market.
Cite this paper
S. Rajasekaran,S. Sathiyamoorthy, (2016) Fuzzy Based Intelligent Monitoring of Critical Lines in the Restructured Power Market. Circuits and Systems,07,2196-2206. doi: 10.4236/cs.2016.79191
References
- 1. Christie, R.D., Woolenberg, B.F. and Wangensteen, I. (2000) Transmission Management in the Deregulated Environment. Proceedings of IEEE, 88, 170-195.
http://dx.doi.org/10.1109/5.823997 - 2. Sood, Y.R., Padhy, N.P. and Gupta, H.O. (2002) Wheeling of Power Under Deregulated Environment of Power System—A Bibliographical Survey. IEEE Transactions on Power System, 17, 870-878.
http://dx.doi.org/10.1109/5.823997 - 3. Dommel, H.W. and Tinney, W.F. (1968) Optimal Power Flow Solutions. IEEE Transactions on Power Apparatus and System, PAS 87, 1866-1876.
http://dx.doi.org/10.1109/TPAS.1968.292150 - 4. Fu, C. and Bose, A. (1999) Contingency Ranking Based on Severity Indices in Dynamic Security Analysis. IEEE Transactions on Power System, 14, 980-986.
http://dx.doi.org/10.1109/59.780910 - 5. Davis, C.M. and Overbye, T.J. (2011) Multiple Element Contingency Screening. IEEE Transactions on Power System, 26, 1294-1301.
http://dx.doi.org/10.1109/TPWRS.2010.2087366 - 6. Lo, K.L., Peng, L.J., Macqueen, J.F., Ekwue, A.O. and Cheng, D.T.Y. (1998) Fast Real Power Contingency Ranking Using a Counter Propagation Network. IEEE Transactions on Power System, 13, 1259-1264.
http://dx.doi.org/10.1109/59.736256 - 7. Kamwa, I., Grondin, R. and Loud, L. (2001) Time-Varying Contingency Screening for Dynamic Security Assessment Using Intelligent-Systems Techniques. IEEE Transactions on Power System, 16, 526-536.
http://dx.doi.org/10.1109/59.932291 - 8. Othman, M.M. and Busan, S. (2016) A Novel Approach of Rescheduling the Critical Generators for a New Available Transfer Capability Determination. IEEE Transactions on Power System, 31, 3-17.
http://dx.doi.org/10.1109/TPWRS.2015.2398118 - 9. Vaahedi, E., Fuchs, C., Xu, W., Mansour, Y., Hamadanizadeh, H. and Morison, G.K. (1999) Voltage Stability Contingency Screening and Ranking. IEEE Transactions on Power System, 14, 256-265.
http://dx.doi.org/10.1109/59.744541 - 10. Greene, S., Dobson, I. and Alvardo, F.L. (1999) Contingency Ranking for Voltage Collapse via Sensitivities from a Single Nose Curve. IEEE Transactions on Power System, 14, 232-240.
http://dx.doi.org/10.1109/59.744538 - 11. Jia, Z. and Jeyasurya, B. (2000) Contingency Ranking for On-Line Voltage Stability Assessment. IEEE Transactions on Power System, 15, 1093-1097.
http://dx.doi.org/10.1109/59.871738 - 12. Li, Z., Wang, J., Sun, H. and Guo, Q. (2015) Transmission Contingency Analysis Based on Integrated Transmission and Distribution Power Flow in Smart Grid. IEEE Transactions on Power System, 30, 3356-3367.
http://dx.doi.org/10.1109/TPWRS.2014.2381879 - 13. Gnanadass, R., Padhy, N.P., Venkatesh. P. and Palanivelu, T.G. (2009) A Novel Method for the Transmission Congestion Management in the Restructured Indian Power Market. Journal of the Institution of Engineers (India), 90, 3-7.
- 14. Paramasivam, M., Dasgupta, S., Ajjarapu, V. and Vaidya, U. (2015) Contingency Analysis and Identification of Dynamic Voltage Control Areas. IEEE Transactions on Power System, 30, 2974-2983.
http://dx.doi.org/10.1109/TPWRS.2014.2385031 - 15. Wood, A.J. and Woolenberg, B.F. (1996) Power Generation, Operation and Control. Wiley, New York.
- 16. Kumar, A., Srivastava, S.C. and Singh, S.N. (2004) A Zonal Congestion Management Approach Using Real and Reactive Power Rescheduling. IEEE Transactions on Power System, 19, 554-562.
http://dx.doi.org/10.1109/TPWRS.2003.821448 - 17. Hsu, Y.Y. and Kuo, H.C. (1992) Fuzzy Set Based Contingency Ranking. IEEE Transactions on Power System, 7, 1189-1196.
http://dx.doi.org/10.1109/59.207333 - 18. Ozdemir, A. and Singh, C. (2002) Fuzzy Decision Making against Masking Problem in MW Contingency Ranking, IEEE Power Engineering Review, 22, 55-56.
- 19. Zadeh, L.A., Klir, G.J. and Yuan, B. (1996) Fuzzy Sets, Fuzzy Logic, and Fuzzy Systems. World Scientific, Singapore.
- 20. Power System Test Case Archive.
http://www.ee.washington.edu/research/pstca
NOTES

*Corresponding author.