Advances in Bioscience and Biotechnology
Vol.4 No.3(2013), Article ID:28782,10 pages DOI:10.4236/abb.2013.43052
The effects of an imperfect vaccine on cholera control
![]()
School of Science, Beijing University of Civil Engineering and Architecture, Beijing, China
Email: cuijingan@bucea.edu.cn, zhanminwu@126.com
Received 5 January 2013; revised 10 February 2013; accepted 20 February 2013
Keywords: Cholera Model; Stability; The Basic Reproduction Number; Sensitivity Analysis
ABSTRACT
In this paper, we consider a SVIR-B cholera model with imperfect vaccination. By analyzing the corresponding characteristic equations, the local asymptotically stability of a disease-free equilibrium and an endemic equilibrium is established. We calculate the certain threshold known as the basic reproduction number Rv. If Rv < 1, we obtain sufficient conditions for the global asymptotically stability of the diseasefree equilibrium, the diseases will be eliminated from the community. By comparison arguments, it is proved that if Rv > 1, the unique endemic equilibrium is local asymptotically stable. We perform sensitivity analysis of Rv on the parameters in order to determine their relative importance to disease control and show that an imperfect vaccine is always beneficial in reducing disease spread within the community.
1. INTRODUCTION
Cholera is an acute intestinal infection caused by ingestion of food or water contaminated with the bacterium vibrio cholera. Since Koch found vibrio cholera in 1883, the research for cholera vaccine has more than one hundred years. People have developed a variety of vaccines. However, these vaccines were parenteral, which have short effective protection and big side effects. In 1973, the World Health Organization canceled the vaccine inoculation which attracted a major concern to oral vaccines. At present, there are three kinds of oral vaccine (i.e., WC/BS vaccine, WC/rBS vaccine and CVD103-HgR vaccine) have been proved to be safe, effective and immunogenic, which were approved to apply in some countries [1].
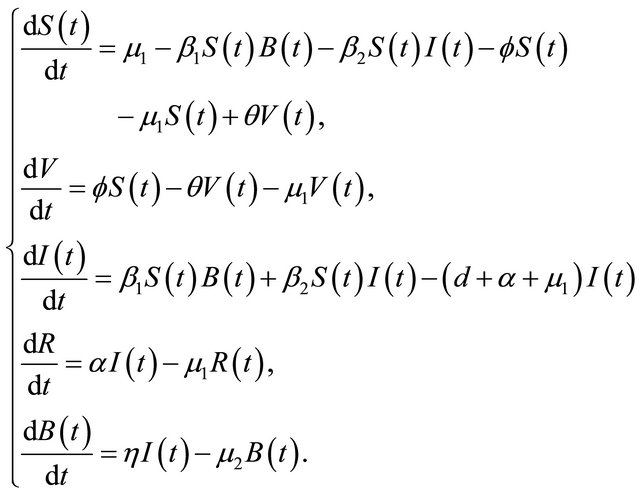
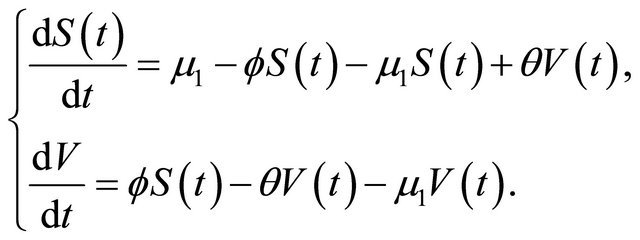
In this paper, according to the natural history of cholera, we improve the model of [2] in the following two aspects. Firstly, if the cholera persists for a long time, it will cause the death [3], especially in the area where water and sanitation resources are not adequate [4], a parameter d is added to describe the rate of disease-related death. Secondly, we propose a proportion of the vaccination in susceptible individuals. As is shown in the following differential equations:
 (1.1)
(1.1)
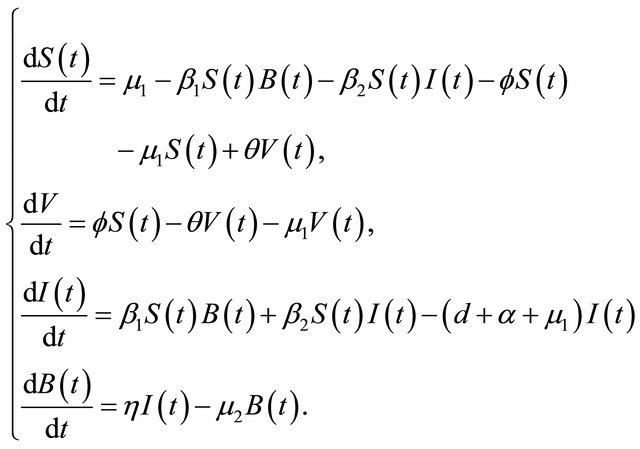
The flow diagram of the model is depicted in Figure 1. Since the first three and last equations in (1.1) are independent of the variable R, it suffices to consider the following reduced model:
 (1.2)
(1.2)
Here, S, V, I and R refer to the susceptible individuals, vaccinated individuals, infected individuals, and recovered individuals, respectively.
The pathogen population at time t, is given by B(t). The parameter μ1 denotes the natural human birth and
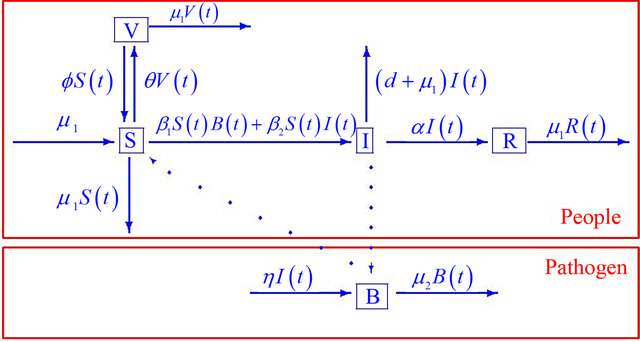
Figure 1. Progression of infection from susceptible (S) and vaccinated (V) individuals through the infected (I) and recovered (R) compartments for the combined human-environment epidemiological model with an environmental component.
death rate, α denotes the rate of recovery from the disease, η represents the rate of human contribution to the growth of the pathogen, and μ2 represents the death rate of the pathogen in the environment. The coefficients β1 and β2 represent the contact rates for the human-environment and human-human interactions, respectively. The rate at which the susceptible population is vaccinated is f, and the rate at which the vaccine wears off is θ.
All parameters are assumed non-negative, and the initial conditions of the system (1.2) are assumed as following
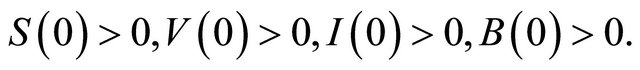 (1.3)
(1.3)
The organization of this paper is as follows: the positivity and boundedness of solutions are obtained in Section 2. In Section 3, we firstly calculate the basic reproduction number and obtain the existence of the endemic equilibrium. We get the local and global asymptotically stability of the disease-free equilibrium in Section 4. In Section 5, we show that the local asymptotically stability of the endemic equilibrium. We analyze the sensitivity of Rv on the parameters, and we present the numerical simulation in Section 6. The paper ends with a conclusion in Section 7.
2. POSITIVITY AND BOUNDEDNESS OF SOLUTIONS
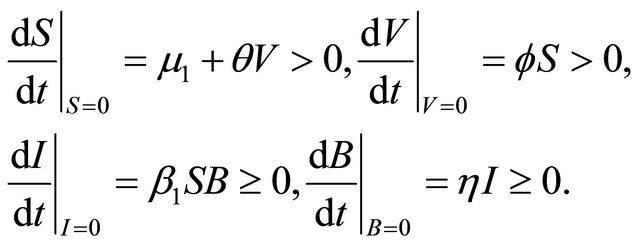
In the following, we show that the solutions of the system (1.2) are positive with the non-negative initial conditions (1.3).
Theorem 2.1. The solutions (S(t), V(t), I(t), B(t)) of the model (1.2) are non-negative for all t > 0 with initial conditions (1.3).
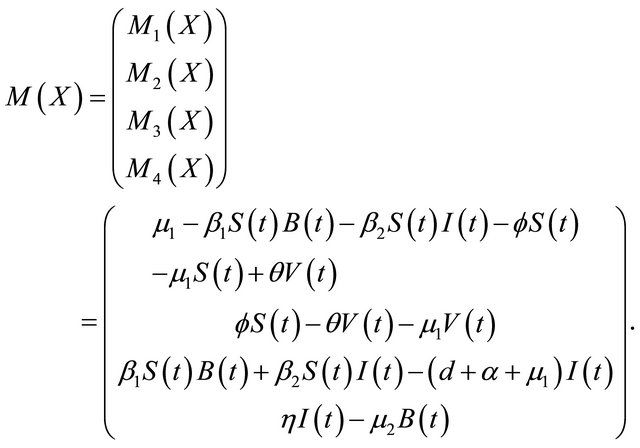
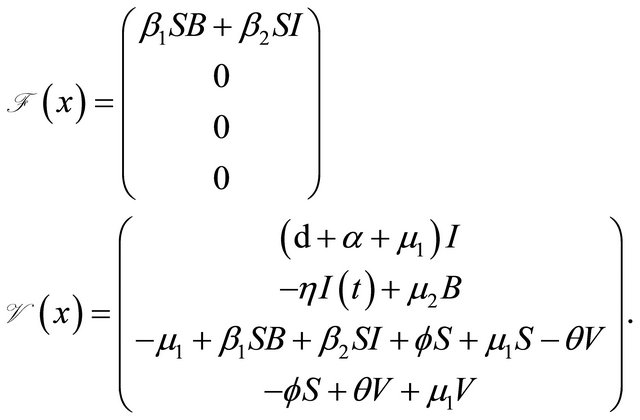
Proof. The system (1.2) can be put into the matrix form
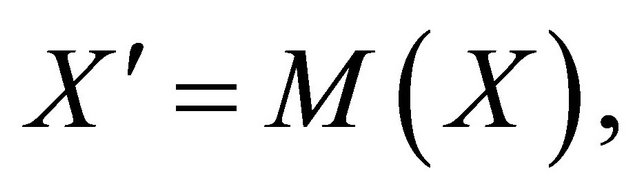
where 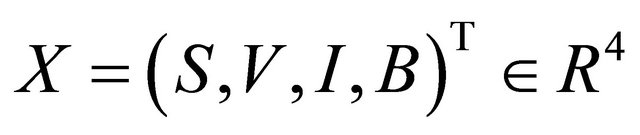 and
and  is given by
We have
Therefore,
Due to Lemma 2 in [5], any solution of the system (1.2) is such that  for all
 . This completes the proof of Theorem 2.1.
Theorem 2.2. All solutions (S(t), V(t), I(t), B(t)) of the model (1.2) are bounded.
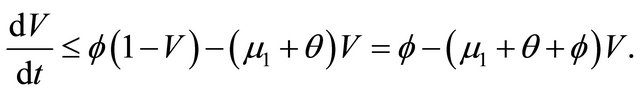
Proof. The system (1.2) is split into two parts, the human population (i.e., S(t), V(t), and I(t)) and pathogen population (i.e., B(t)). It follows from the first three equations of the system (1.2) that
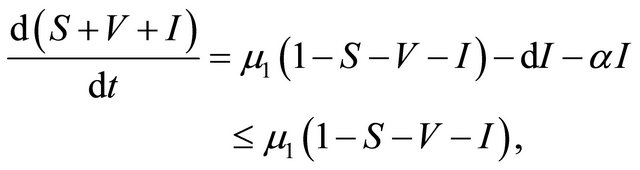
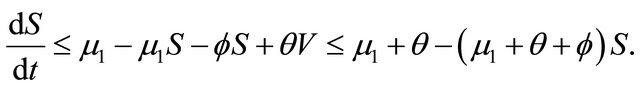
then it follows that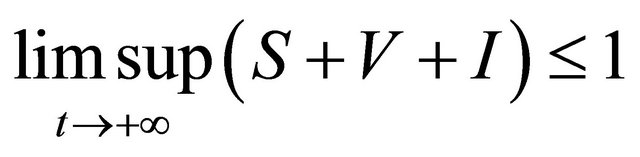 . From the first equation, we can get
Thus , as
, as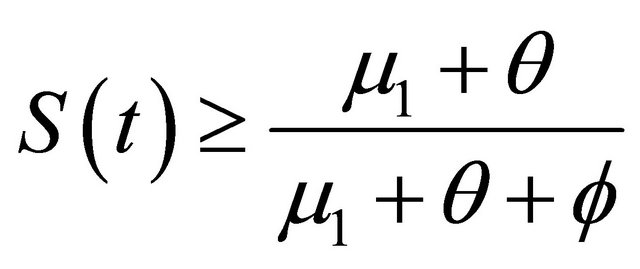 . It is easy obtain
 , as
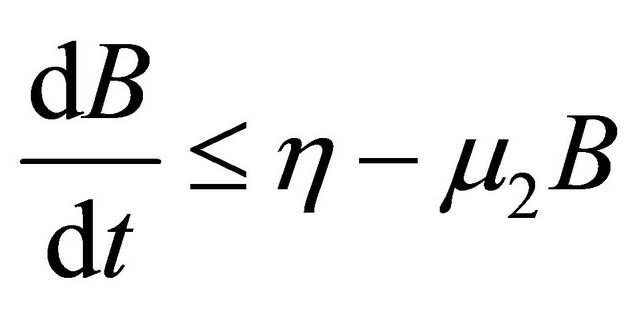
, as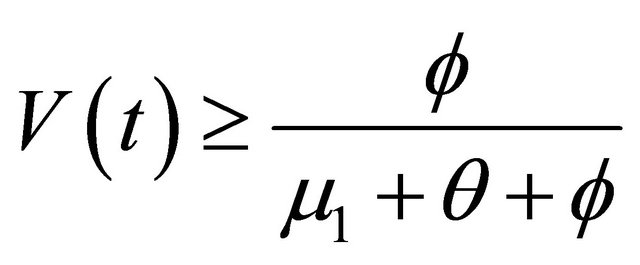 . From the last equationwe can obtain
 .
.
Hence, 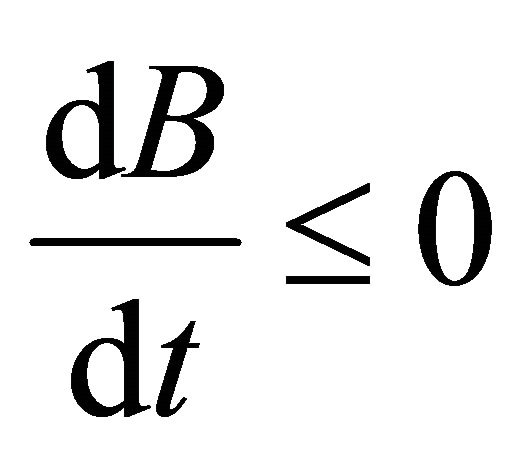 , when
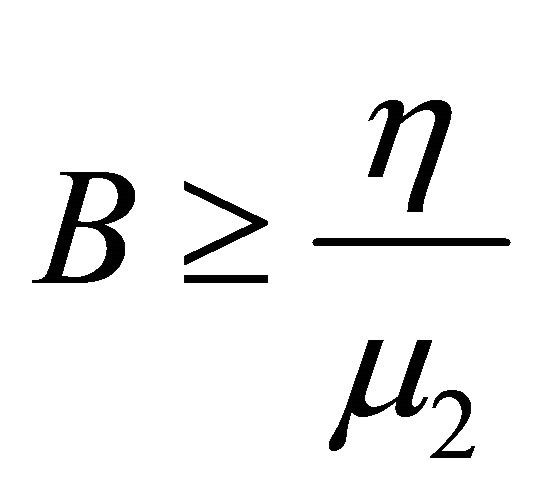 . Therefore, all solutions (S(t), V(t), I(t), B(t)) of the model (1.2) are bounded.
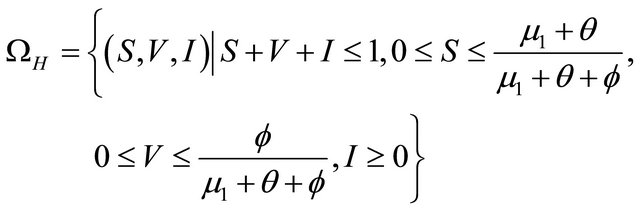
From above discussion, we can see that the feasible region of human population for system (1.2) is
and the feasible region of pathogen population for system (1.2) is
 .
.
Define . Let
. Let  denote the interior of Ω. It is easy to verify that the region Ω is a positively invariant region (i.e., the solutions with initial conditions in Ω remain in Ω) with respect to the system (1.2). Hence, we will consider the global asymptotically stability of (1.2) in region Ω.
3. THE EXISTENCE OF EQUILIBRIA
In this section, we investigate the existence of equilibria of system (1.2). Solving the right hand side of the model system (1.2) by equating it to zero, we obtain the following biologically relevant equilibria.
It is easy to see that model (1.2) always has a disease-free equilibrium (the absence of infection, that is,
 ,
,  , where
  and
and
 . Let
. Let . Then model (1.2)
can be written as
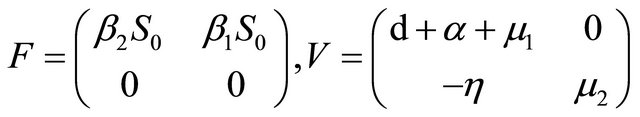
 where
where
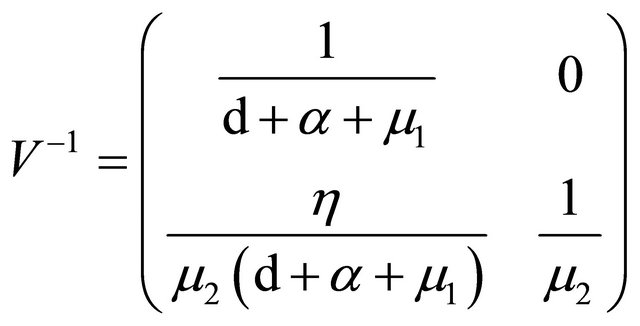
We can get
 giving
 .
.
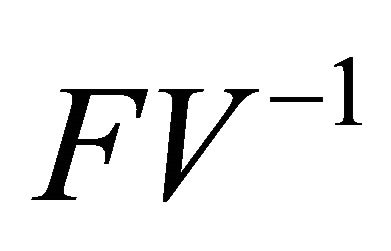 is the next generation matrix for model (1.2). It then follows that the spectral radius of matrix
  is
is
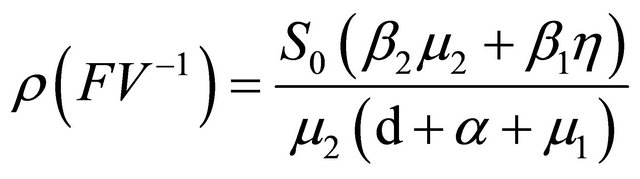 . According to Theorem 2 in
[6], the basic reproduction number of model (1.2) is
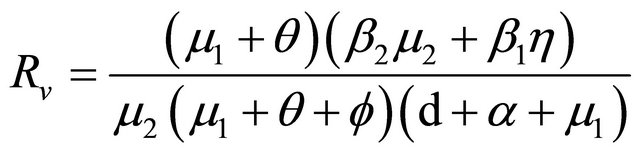 .
.
In the following, we will discuss the case with Rv > 1. The existence and uniqueness of the endemic equilibrium is established as follows.
The endemic equilibrium  can be deduced by the following system:
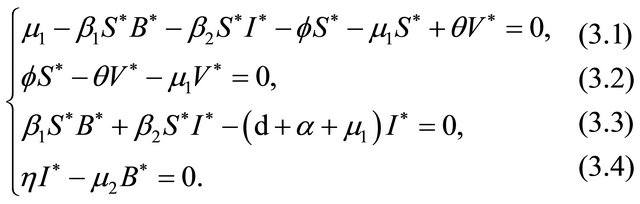
which gives,
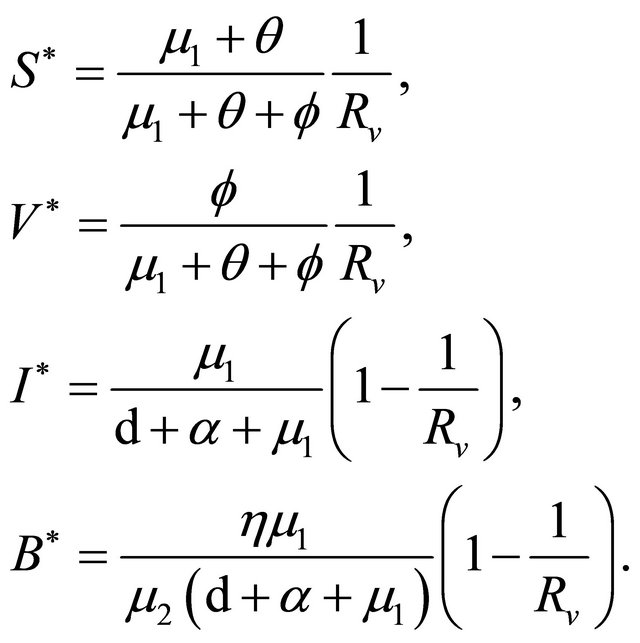
Obviously, when Rv > 1,  ,
, .
.
Theorem 3.1. The system (1.2) has a unique endemic equilibrium when Rv > 1 and no positive endemic equilibrium when Rv < 1.
4. STABILITY OF DISEASE-FREE EQUILIBRIUM
Now, we will discuss the local and global asymptotically stability of the disease-free equilibrium. From above and [6], we can obtain the following theorem.
Theorem 4.1. The disease-free equilibrium E0 is locally asymptotically stable for Rv < 1 and unstable for Rv
> 1.
Proof. The Jacobian matrix of the system (1.2) at X = E0 is
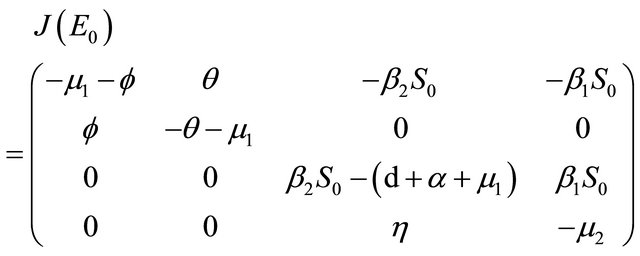
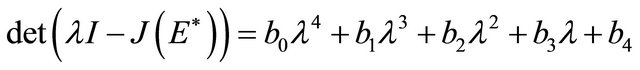
The characteristic polynomial of the matrix  is given by
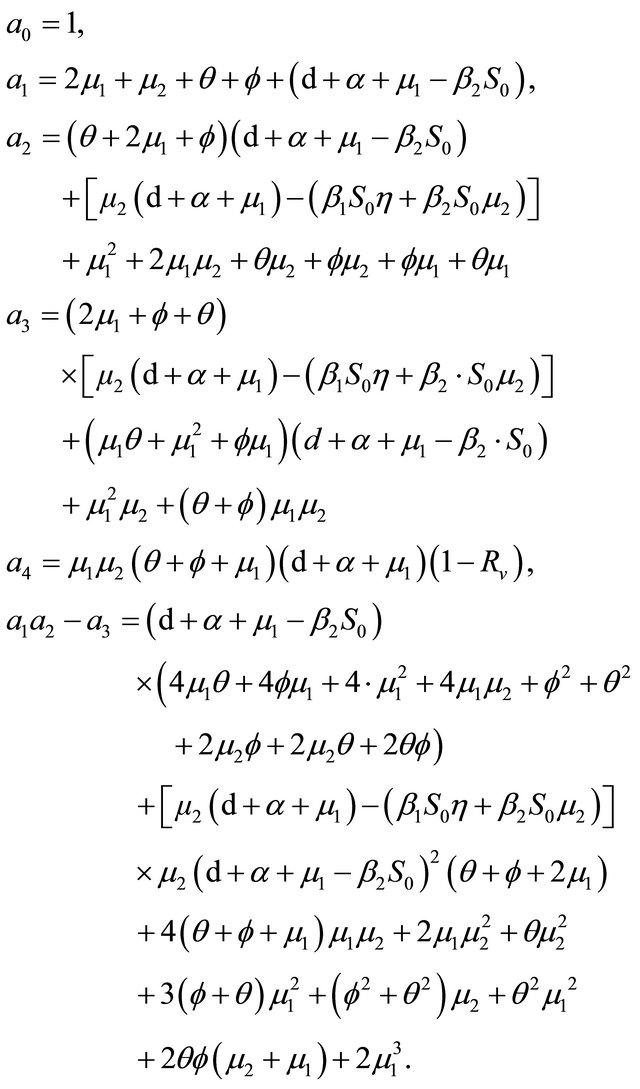
 where
where
If Rv < 1, then
 further
After some calculations, if Rv < 1 we have a1 > 0, a2 > 0, a3 > 0, a4 > 0, a1a2 − a3 > 0,  (see Appendix A). Thus, using the Routh-Hurwitz criterion, all eigenvalues of
  have negative real part, E0 is local asymptotically stable for the system (1.2). If
 , then
  and we show that
  has at least one eigenvalues with non-negative real part. Consequently, E0 is not stable.
Theorem 4.2. When Rv < 1 the disease-free equilibrium is globally asymptotically stable.
We will prove the global asymptotically stability of the disease-free equilibrium using Lemma 4.1.
Lemma 4.1. [7] If a model system can be written in the form
where  denotes(its components) the number of uninfected individuals and
  denotes (its components) the number of infected individuals including latent, etc.
  denotes the disease-free equilibrium of the system.
And assume that
(H1) 
 is globally asymptotically stable;
(H2)  for
for
 , where the Jacobian matrix
is an Metzler matrix(the off-diagonal elements of  are non-negative) and Ω is the region where the model makes biological sense. Then the fixed point
  is a globally asymptotically stable equilibrium of cholera model system (1.2) provided that Rv < 1.
We begin by showing condition (H1) as
 .
.
For the equilibrium , the system reduces to
The characteristic polynomial of the system is given by
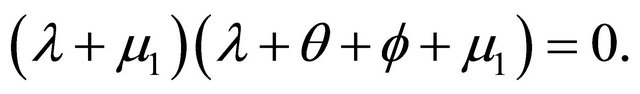
There are two negative characteristic foots are ,
, . Hence,
  is always globally asymptotically stable.
Next, applying Lemma 4.1 to the cholera model system (1.2) gives
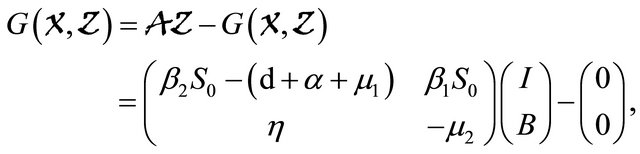
which is clearly an Metzler matrix. Meanwhile, we find  Hence, the disease-free equilibrium is globally asymptotically stable.
5. STABILITY OF THE ENDEMIC EQUILIBRIUM
Now we consider the case with Rv > 1. The stability of the endemic equilibrium is established as follows:
Theorem 5.1. If 
 is locally asymptotically stable.
Proof. Let
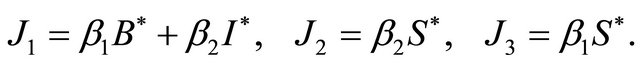
The Jacobian matrix at  is
is
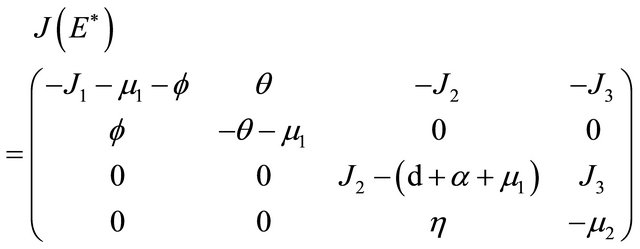
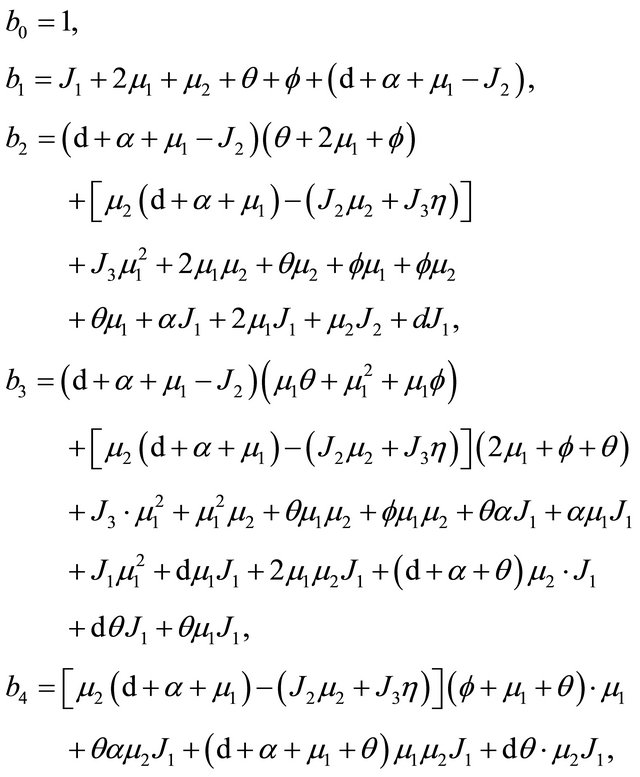
The characteristic polynomial of the matrix  is given by
 where
where
Based on Eq.3.3 and Eq.3.4, we have 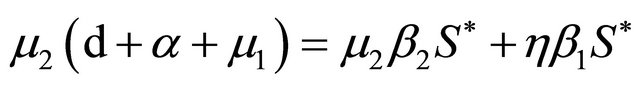 . It is then easy to observe that
 further,
 .
.
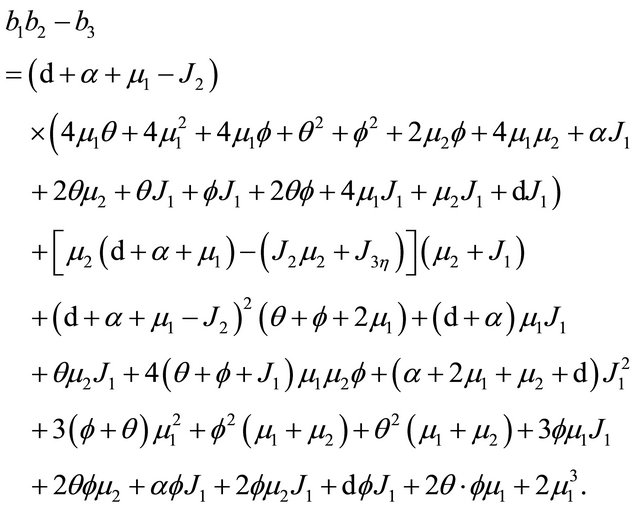
After some calculations, we have 

(see Appendix B). Using the well-known Routh-Hurwitz criterion, the proof is thus complete.
6. SENSITIVITY ANALYSIS OF Rv
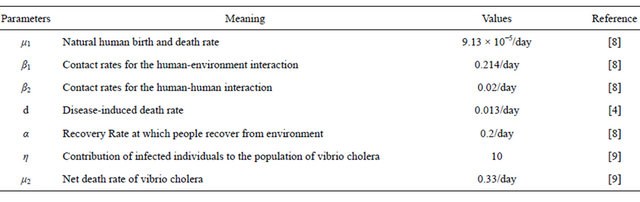
To facilitate the interpretation of the sensitivity of Rv, we now present some numerical simulations by using the set of parameters values in Table 1.
Now, we regard the vaccinated rate f and the wanning rate θ as the control parameter, while the other parameters are fixed. From Figures 2 and 3, the effects of various parameters, i.e., f and θ on the basic reproduction number Rv have been shown. It is noted that as the parameter f increases, Rv decreases; as θ decreases, Rv decreases. In fact, we can obtain the critical values of f and θ that reduce Rv to 1,
and
Table 1. Estimation of parameters.
In Figure 2, we select θ = 0.07, 0.03, 0.007, 0.0001, corresponding fv = 2.07, 0.89, 0.21, 0.01, respectively. We can see that when the wanning rate θ has a greater value, fv has not reasonable value so that when f > fv, Rv < 1. Similarly, in Figure 3, we select f = 0.01, 0.1, 0.3, 0.6, 0.99, corresponding θv = 0.0002, 0.003, 0.01, 0.02, 0.03, respectively. We can see that when f is smaller, θv has not reasonable value so that when θ < θv, Rv < 1. Thus, the basic reproduction number can not reduces below unity only by increasing θ or decreasing f. The critical values fv and θv play a key role in regulation the infection magnitude. In order to reduce Rv to 1, a greater vaccinated rate than fv and a smaller wanning rate than θv have to be achieved simultaneously. We will deduce Rv below 1 by using both f and θ at the same time, which can control cholera (see Figure 4).
7. CONCLUSION
In this paper, we have conducted stability analysis of a SVIR-B cholera model. The mathematical analysis results show that the basic reproduction number Rv satisfies a threshold property with threshold value 1. Rv in our model include the parameters f and θ which reflect the effect of vaccination. Numerical simulation show also that the vaccination is always beneficial to the eradication of cholera.
However, there are inherent disadvantages towards the vaccination modeling. For cholera with incubation period, it is hard to rapidly identify those with ambiguous symptoms [4]. Moreover, the vaccination does not always work well due to the limitations of medical development level and financial budget (some vaccine is very expensive and some portion of people cannot be covered) [10].
Hence, incorporating some other control strategies, for example, public health improvement, isolation etc, we may consider the more realistic ordinary differential equation model. The theoretical study of cholera models has been in progress, and is an exciting area of future research.
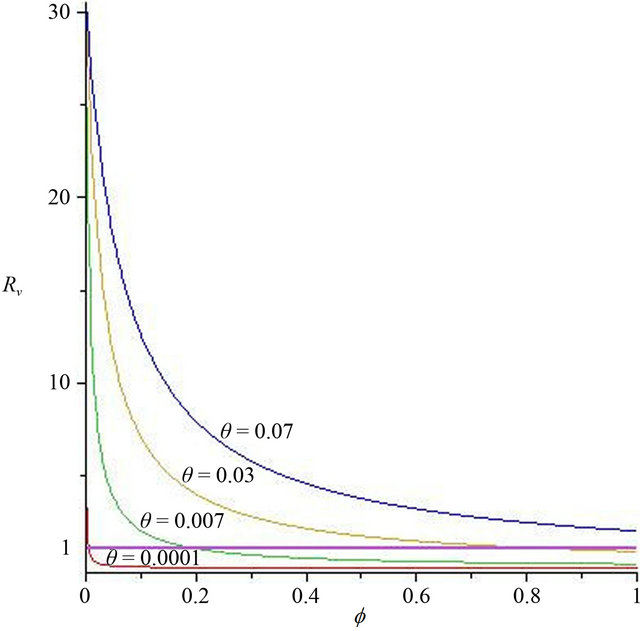
Figure 2. The contour diagram of the basic reproduction number Rv with f, θ has some fixed value.
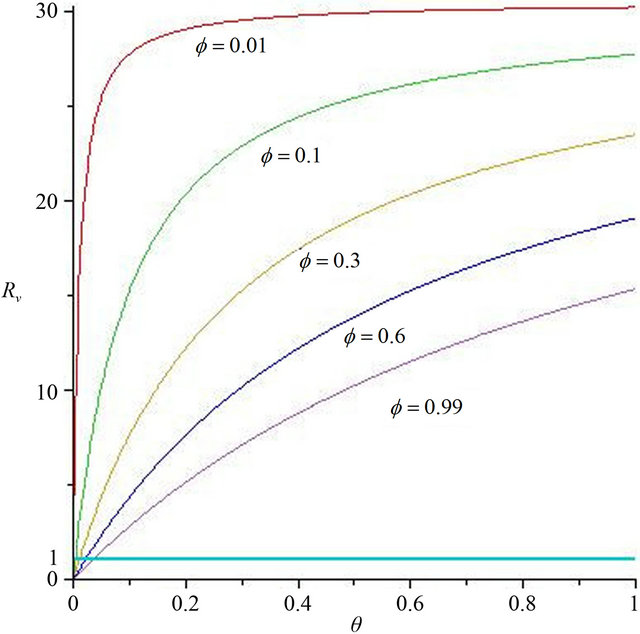
Figure 3. The contour diagram of the basic reproduction number Rv with f, θ has some fixed value.
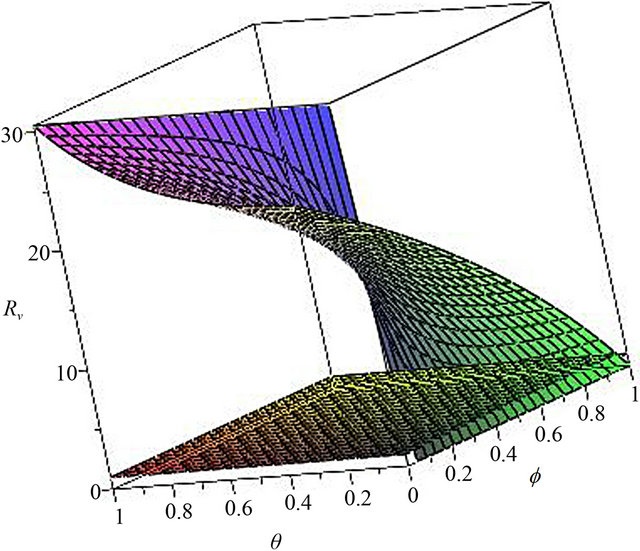
Figure 4. The contour diagram of the basic reproduction number Rv with f, θ variables. all the other parameter value are the same as those in Figure 2.
8. ACKNOWLEDGEMENTS
This work is supported by the National Natural Science Foundation of China (no.11071011), Funding Project for Academic Human Resources Development in Institutions of Higher Learning Under the Jurisdiction of Beijing Municipality (no.PHR201107123).
![]()
![]()
REFERENCES
- Kang, Y. and Zhang, H.Z. (2005) The study status of oral cholera vaccine. Chinese Frontier Health Quarantine, 28, 91-92.
- Liao, S. and Wang, J. (2007) Global stability analysis of epidemiological models based on Volterra-Lyapunov stable matrices. Chaos, Solitons & Fractals, 45, 966-977. doi:10.1016/j.chaos.2012.03.009
- Singh, S., Chandra, P. and Shukla, J.B. (2003) Modeling and analysis of the spread of carrier dependent infectious diseases with environmental effects. International Journal of Biomathematics, 11, 325-335.
- World Health Organization (2012). http://www.who.int/gho/epidemic\_diseases/cholera/en/index.html
- Yang, X. and Chen, L. (1996) Permanence and positive periodic solution for the single-species nonautonomous delay diffusive models. Computers & Mathematics with Applications, 32, 109-116. doi:10.1016/0898-1221(96)00129-0
- Van den Driessche, P. and Watmough, J. (2002) Reproduction numbers and sub-threshold endemic equilibria for compartmental models of disease transmission. Mathematical Biosciences, 180, 29-48. doi:10.1016/S0025-5564(02)00108-6
- Castillo-Chavez, C., Feng, Z.L. and Huang, W.H. (2003) On the computation of R0 and its role on global stability. Mathematical Approaches for Emerging and Reemerging Infectious Disease: An introduction, 65, 229-250.
- Harley, D.M., Morris, J.G. and Smith, D.L. (2006) Hyperinfectivity: A critical element in the ability of V. cholerae to cause epidemics? PLoS Medicine, 3, 63-69.
- Codeco, C.T. (2001) Endemic and epidemic dynamics of cholera: The role of the aquatic reservoir. BMC Infectious Diseases, 1, 1. doi:10.1186/1471-2334-1-1
- Chen, M. (2011) The opinion of WHO about cholera vaccine. International Journal of Biologicals, 34, 214-218.
APPENDIX A
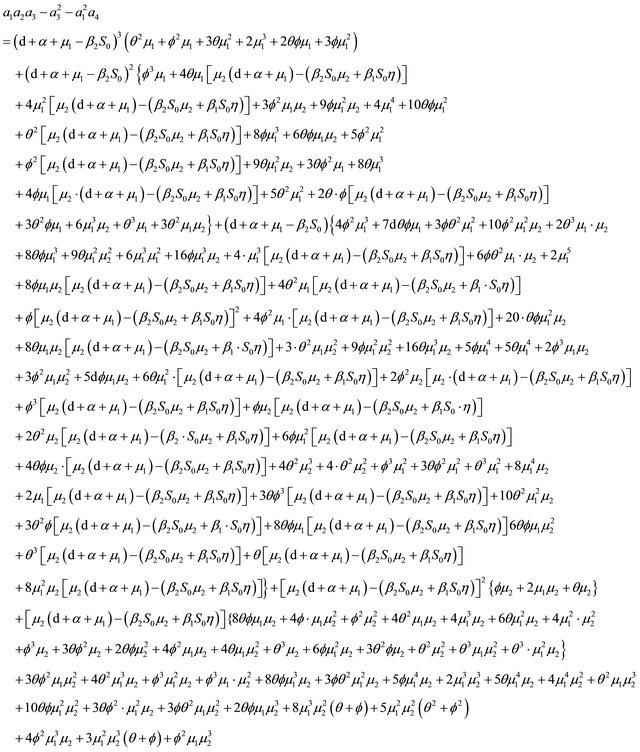
From Section 4, we know that Rv < 1,

and
 .
.
After some algebraic manipulations, we have , Thus,
  , when Rv < 1.
APPENDIX B
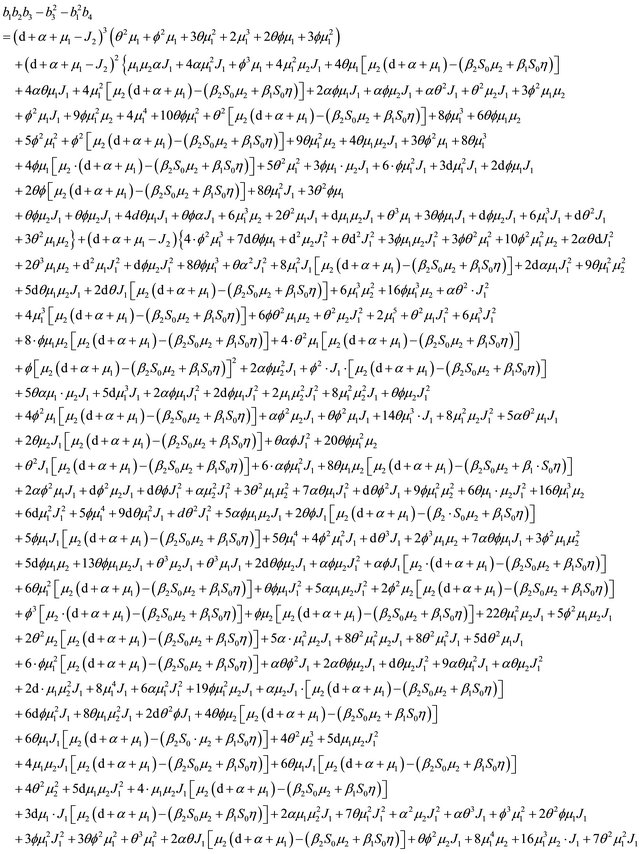
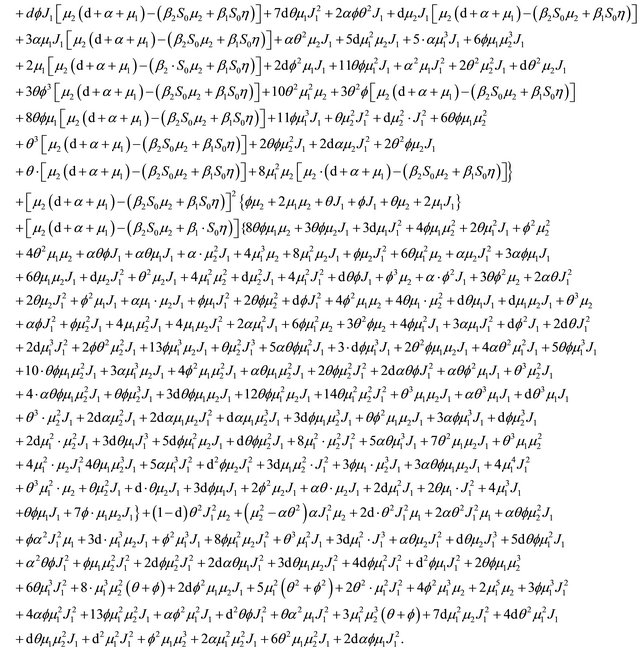
From Section 5, we know that
and
 .
.
After some algebraic manipulations, we have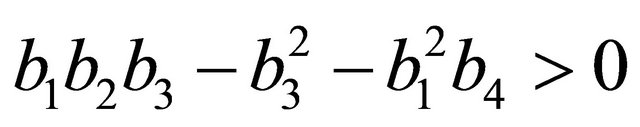 , Thus,
  , when
 .
.