Modern Economy
Vol.3 No.4(2012), Article ID:21283,7 pages DOI:10.4236/me.2012.34056
Distinguish the Effects of Food Availability and Food Prices on Fat Intakes of the Chinese Adults
Department of Agricultural Economics, National Taiwan University, Taipei, Chinese Taipei
Email: hunghaochang@ntu.edu.tw
Received April 3, 2012; revised April 21, 2012; accepted May 20, 2012
Keywords: fat intake; food availability; food price; quantile regression model; China
ABSTRACT
Remarkable economic growth in China has resulted in a change in the diet behavior of adults. This paper examines how changing socio-demographic characteristics, local food availability, and food prices may affect the fat intake among Chinese adults as a result of the economic growth. This paper goes beyond existing studies on the similar topic by two fronts. Instead of using a simple cross-sectional survey, a longitudinal sample of 2242 adults aged 20 and above in 1997 and 2006 was constructed. In addition, we estimated a fat intake equation using the quantile regression model to investigate the heterogeneous effects of the exogenous factors on the fat intake distribution. Results indicate that the fat intake of Chinese adults has increased over time. In particular, the increase in food availability significantly affects the fat intake of the Chinese adults.
1. Introduction
China has undergone tremendous economic growth over the past few decades with an average annual growth rate of 8%. As a consequence of the rapid growth in per-capita income, the socio-demographic characteristics of Chinese adults have changed accordingly [1]. Economic progress has also led to revolutionary changes in dietary patterns, food consumption and the local food environment; the result has been a radical change in the fat intake of the population [2]. To underscore how the fat nutrient transition of the Chinese citizens may correspond to the economic growth in China is of policy interest since an unhealthy diet accounts for a significant proportion of all deaths and chronic diseases [3]. An excessive intake of fat is associated with heart disease and increased risk of heart attacks; the overconsumption of calories results in an overweight population.
Some economic studies on nutrient demand have employed time series data to estimate price and income elasticity [4], while others, using the cross-sectional survey, have highlighted the role of socio-economic factors on nutrients [5-7]. However, far less attention has been paid to the nutrition demand among Chinese adults. Only a few studies have investigated the nutrient transition in China [8-10].
Over the past few decades, the prevalence of diet-related disease has increased at an alarming rate in China; as a result, an empirical evaluation of the changes in nutrition demand is both timely and crucial. The objective of this study is to underscore the extent to which food availability and food prices may affect Chinese adults’ nutrient consumption in regard to fat intake in the years 1997 and 2006. Special attention is paid to distinguish the differential effects of these factors on the entire distribution of fat consumption by utilizing the quantile regression model. Unlike the evidence based on a crosssectional survey, a longitudinal dataset drawn from the China Health and Nutrition Survey in 1997 and 2006 is constructed. Longitudinal analysis has the advantage to control for unobservable cross-sectional heterogeneity in the fat consumption of adults, and affords more insights into the causal effects [11].
2. Data
The data were drawn from the China Health and Nutrition Surveys in 1997 and 2006. Two basic modules are included in CHNS. The individual basis survey contains detailed information on the socio-demographic characteristics and lifestyle behaviors. More importantly, the three-day average consumption of fat intake is calculated according to the nutrient content of various food items that each individual consumes. In addition to the individual survey, there is a community-facility survey which contains detailed information on the local community environment where each individual or household is located. In particular, the number of in-door restaurants, street vendors, and convenience stores in the local area are also included in the community survey data.
We merged the individual survey and the data of community characteristics. We limited our sample to individuals aged 20 and above, and excluded pregnant women during the survey period. A balanced panel dataset was then constructed by selecting respondents who were in both the 1997 and 2006 surveys. After excluding few observations with missing values on some key variables, a final sample consists of 2242 adults.
Built on the findings of previous studies [5-7,12], and consistent with the theoretical framework, the exogenous determinants of the fat intake were subdivided into several categories. The individual characteristics include age and education (four dummies). Consistent with the specification of [13], the employment status of the respondents was captured by two dummy variables reflecting the intensity of their labor requirements. The heavy labor intense job category includes: mineworkers, lumbermen and farmers, while those in the medium labor intensive job category included drivers and electricians. Since lifestyles were associated with nutrient demand [5,12,14], we defined several variables to indicate if the respondent was a current smoker, had a drinking habit, exercised, and if the adult was covered by the health insurance program.
Annual personal income is specified as total income from various sources, and it was adjusted to 1997 CPI level. In addition, a household wealth variable was specified. Following [15], this variable was defined based on the first principle component analysis of several household asset indicators, including the ownership of an automobile, color TV, washing machine, refrigerator, air conditioner, etc, and some of the dwelling characteristics. To consider the effects of economic growth on adults’ nutrition, it is crucial to include the changes in local food accessibility. This is because China’s open market policy increases the food availability in recent years, and the accessibility of food purchases has been shown to have a clear influence on fat intake [16]. Three variables related to food availability in the local area are specified, the number of: indoor restaurants, street vendors, and convenience stores in the local community. Finally, average market prices for beef, pork, chicken, fish, and vegetables in the local area were also included.
3. Conceptual Framework
To guide the empirical specification, a simple conceptual framework of the fat demand was developed, building on a household production model [17,18]. Assuming that each adult maximizes the utility which is a function of food consumption and other products. If J different types of food products are available, given the cash constraint, the maximization problem of the representative adult can be shown as:
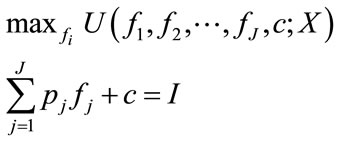 (1)
(1)
where fj represents the consumption of food product j, and c is the non-food products. The variable pj is the food price relative to the non-food products. X is the vector of the individual characteristics and local environmental factors, and the variable I represents personal disposable income. After solving the maximization problem, the reduced form of each jth food demand can be shown as:
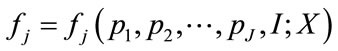 (2)
(2)
Following [4], we assumed that each unit of food product fj consists of  unit of fat intake. The demand for the total fat intake (y) can then be shown as:
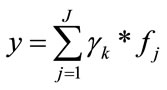 (3)
(3)
Substituting Equation (2) into (3), the demand function of fat intake becomes:
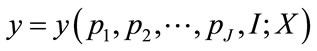 (4)
(4)
Equation (4) forms the basis of the empirical specification. That is, the demand for fat intake is specified as a function of individual income, average food price and other environmental characteristics in the local community, and socio-demographic characteristics of the adult.
4. Econometric Analysis
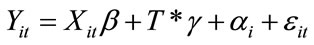
Consistent with Equation (4), we empirically specify a demand equation for the fat intake. For each adult i in time period t, we assume that Yit is the fat intake and Xit is the vector of time varying variables (such as the price of food commodities in the local community in which each individual lives), T is a time dummy variable which is equal to 1 if it is in year 2006.  is the individual time-invariant fixed effect. The fat demand function can be shown as:
 (5)
(5)
where (![]() ) is a vector of the parameters to be estimated, and
) is a vector of the parameters to be estimated, and ![]() is the random error. Note that estimating Equation (5) on a pooling sample will cause inconsistent estimates because the individual time-invariant characteristics (
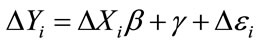
is the random error. Note that estimating Equation (5) on a pooling sample will cause inconsistent estimates because the individual time-invariant characteristics ( ) is likely correlated with Xit. We use the first differencing method to obtain the consistent coefficients [11]. If we subtract year 2006 (t = 2) from year 1997 (t = 1), the differencing equation can be shown as:
 (6)
(6)
where “Δ” represents simple changes from 1997 to 2006. The parameters β and  in Equation (6) correspond to the same parameters defined in Equation (5), but the estimation problems caused by the
  variable have been eliminated. We call the resulting estimators the first-differenced estimators [11].
Two different estimation methods are used to estimate Equation (6). The first method is the conventional Ordinary Least Square (OLS) method. Although using the OLS method yields consistent estimates, this method is not sufficient to investigate if the effects of socioeconomic factors are heterogeneous across the fat intake distribution The disadvantage of using the OLS method can be overcome by applying the quantile regression model [19,20]. The quantile regression model can evaluate the effects of the determined variables on fat intake distribution by different quantiles of the entire distribution.
5. Results
5.1. Changes in Fat Intake
Table 1 contains information on the sample distribution of daily per capita intake of fat in 1997 and 2006. As exhibited, the consumption of the fat of adults increased. On average, the fat intake increased 4.21 g/day (from 68.14 to 72.35). Interestingly, the increase in fat consumption is not homogenous across the entire distribution. The increase in fat intake is more pronounced for the respondents located in the higher percentiles. For
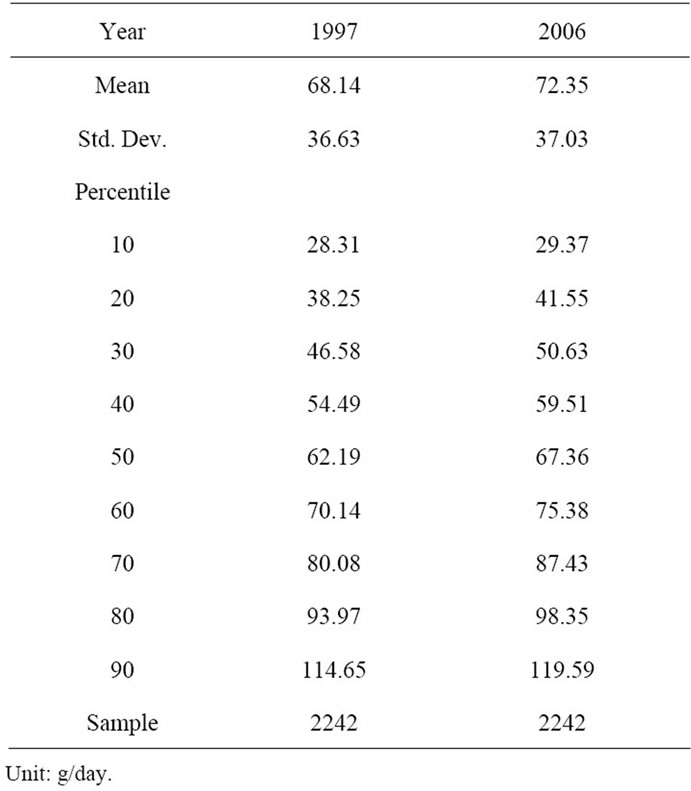
Table 1. Sample distribution of fat intake.
instance, the fat intake changed from 80.08 g/day in 1997 to 87.43 g/day in 2006 (an increase of 7.35 g/day) at the 70th percentile. In contrast, the consumption of fat did not change much at the lower percentiles.
With respect to the determinants of fat intake, Table 2 presents the sample statistics of the selected variables in 1997 and 2006, respectively. As expected, timeinvariant socio-demographic characteristics such as gender and education levels exhibit a slight change. This is not unexpected in that the same individuals interviewed in these two years sample are included. On the other hand, individual income and wealth increased dramatically due to the country’s economic growth. The average income increased from $RMB 4010 in 1997 to $RMB 8680 in 2006, and the average score of individual wealth increased approximately 24% (from 4.67 point to 5.80 point) from 1997 to 2006. With regard to the local environmental characteristics, an increased pattern is evident. In particular, the changes are more pronounced for the food availability in local areas. The average number of the indoor restaurants, street vendors and convenience stores all increased. For instance, the average number of the indoor restaurants in the local communities increased from 7.73 in 1997 to 9.88 in 2006. Compared to the food availability, the average food prices remained stable. A remarkable change occurred in the price of beef products, which slightly decreased from $RMB 725 in 1997 to $RMB 612 per gram in 2006.
5.2. Determinants of Fat Intake
Results of our estimation of the fat intake equation are listed in Table 3. For sake of interpretation, we only report the quantile regression results for the 25th, 50th and 75th quantiles. Figures 1 and 2 plot the effects of the significant exogenous determinants on the distribution of fat conditional at all quantiles. In each figure, we plot estimates ranging from 0.05 to 0.95. The shaded area is the 95% CIs calculated by the bootstrap method with 500 replications.
In general, income and wealth as well as local environment characteristics play important roles on fat demand. However, the effects of the determinants vary by quantiles. The effects of personal income and wealth are positively associated with fat consumption. The effect is more pronounced for wealth. One possible explanation of this finding is that when people become rich, they are more likely to eat out and consume more on food away from home.
Given the expressed evidence of a positive association between food consumption away from home and unhealthy diet, a positive effect of income and wealth on fat intake is not unexpected. Interestingly, the effect is more significant for those with relatively lower fat intake. For
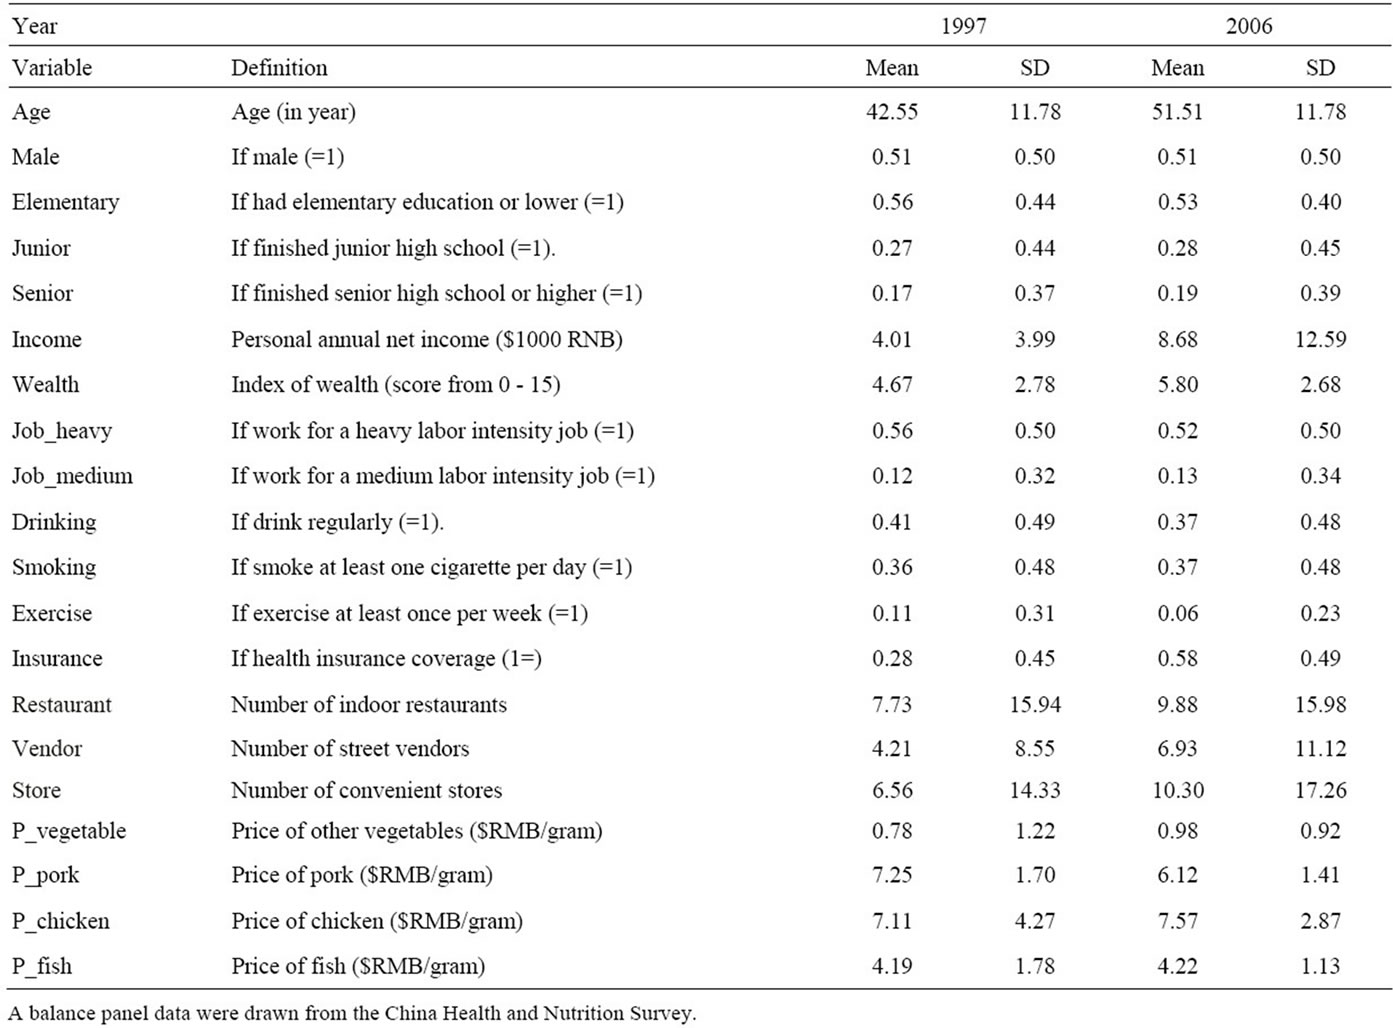
Table 2. Sample distribution by year.
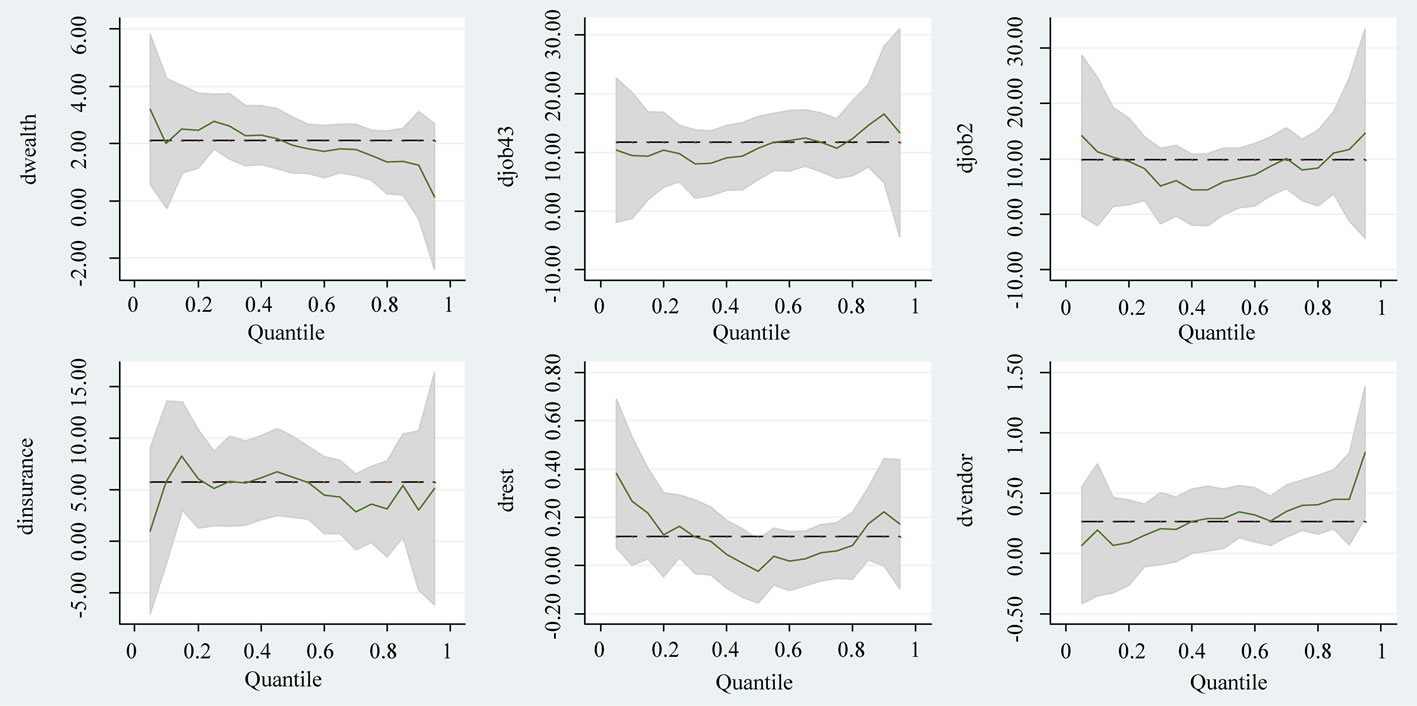
Figure 1. Estimations of the quantile regression of the socio-demographic characteristics. Dash line is the parameter of the OLS method, and solid line is the parameter of the quantile regression model. The shadow area represents the 95% CIs of the quantile regression model.
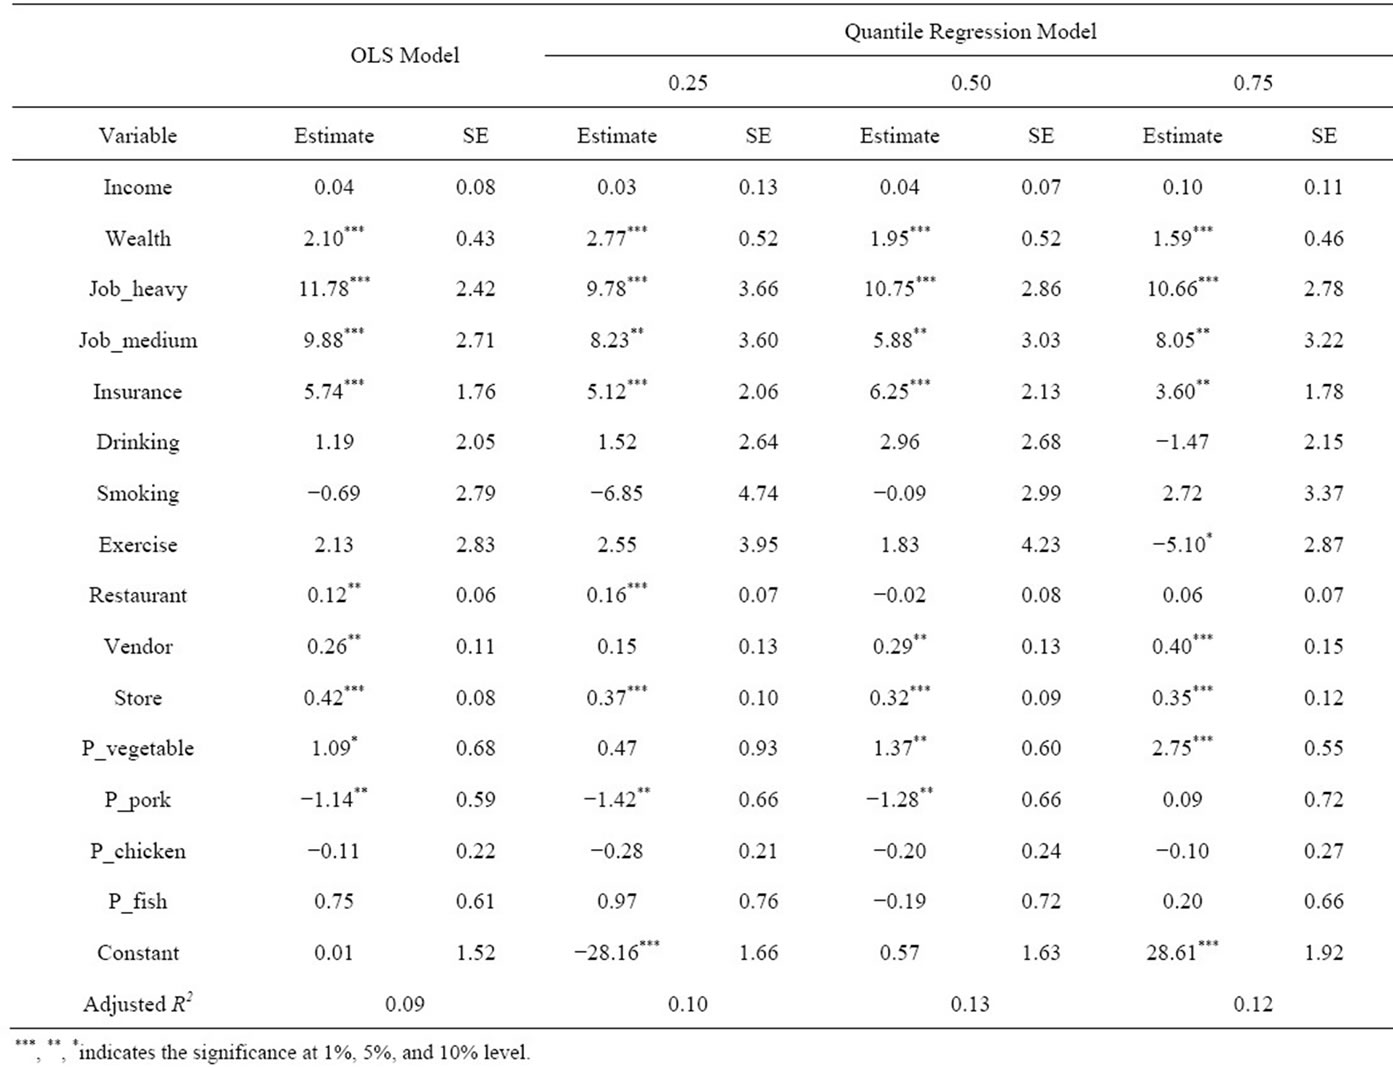
Table 3. Estimation of the fat intake equation.
instance, at the 25th and 75th percentile, an additional score increase in individual wealth increased fat consumption by 2.77 g/day and 1.59 g/day in 1997 and 2006, respectively. This finding may reflect the fact that people with lower fat intake may also have greater concern regarding their food choice. Therefore, when they have more wealth, they are more likely to choose food with less fat. Results also indicate that people working at more labor intense jobs have greater fat intake. Compared to their counterparts who are unemployed or work in less labor intensive jobs, they have higher fat intake by 2.10 g/day on average. A monotonic effect is also evident over the entire distribution (Figure 1). The effects are 9.78 g/day and 10.66 g/day at the 25th and 75th quantile, respectively. Health insurance coverage is also found significantly associated with fat intake. The fat intake is 5.74 g/day higher for those who have health insurance coverage, and results are robust across the entire distribution. This result may indicate that people who have health insurance programs may have more chance to access health care service. Therefore, they are less likely to be sick or experience under-nutrient. Lifestyles also matter. It is not surprising to see a negative association between exercise and fat intake because exercise can contribute to energy balance. However, the effect is not homogenously across the entire distribution; it is only significant at the higher percentile. Compared to individuals who do not regularly exercise, those who exercise at least once a week have lower fat intake by 5.10 g/day based on the results of the 75th quantile.
The local community condition is significantly related to fat consumption. Results point out that adults living in a community with more indoor restaurants, street vendors, and convenience stores consume more fat. This result is not inconsistent with the previous findings in that food away from home contributes to higher body weight and unhealthy diet. Among the above-mentioned three different types of food fertilities, a stronger effect is revealed for street vendors and convenience stores. Taking the results of the OLS estimation for instance, an additional indoor restaurant, street vendor, and convenience store increase the fat intake by 0.12 g/day, 0.26

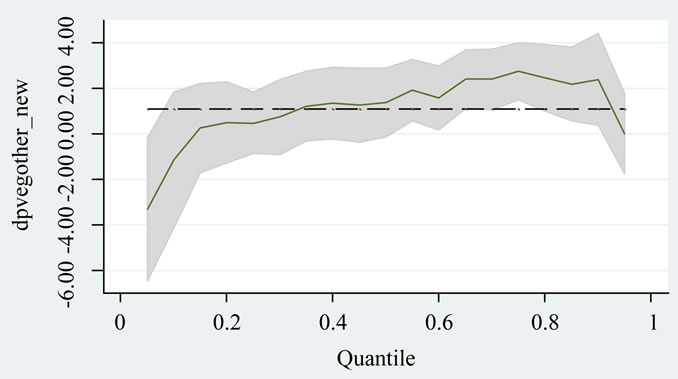

Figure 2. Estimations of community variables.
g/day, and 0.42 g/day, respectively. This finding may reflect the fact that compared to the in-door restaurants, street vendors and convenience stores provide less healthy food, which is likely to have more fat. Therefore, individuals who live in a community with more street vendors are more likely to access fatty food. Finally, food prices also matter in regard to fat demand. The results indicate that people living in areas with higher vegetable prices are more likely to consume fat, and the effect is more pronounced for people at the higher percentiles. The effect is more pronounced for people in the higher percentiles of the fat distribution. Taking the result of the 75th quantile for example, a 1 $RMB increase in vegetable price will increase the fat intake by 2.75 g/day. In contrast, lower beef price leads to higher fat consumption. This result is in agreement with the findings of other studies in that lower meat price (such as beef product) results in increased fat intake and the risk of being overweight.
6. Conclusions
Several studies have focused on the impact on Chinese society of economic growth over the past few decades. However, relatively little is known about the extent to which economic transition may be associated with the changes in nutrition consumption based on the microlevel evidence. The focus of this paper is on the changes in fat consumption in China. We examine how the changing socioeconomic and demographic factors and local community environment may contribute to the change in fat intake of the Chinese adults.
Using a constructed panel data drawn from the China Health and Nutrition Survey in 1997 and 2006, we estimated fat equations using the quantile regression framework. The utilization of the quantile regression method has some advantages to the traditional least squares method. The quantile regression analysis investigates the effects of these determinants on the entire distribution of fat demand, and allows us to distinguish the differential effects of these determinants on the entire distribution. Our study also distinguishes the effects of the change in time-varying socio-demographic characteristics and the change in local food availability and food prices on the change in fat consumption by Chinese adults.
Several interesting findings are revealed in our empirical results. First, time-varying socioeconomic and demographic factors, household characteristics and local community condition are significant determinants of fat consumption. However, their effects do not vary across the entire distribution. Also, the effects of these characteristics vary by year. In general, increased personal income and wealth is positively correlated with increased fat intake. A positive association is also found between health insurance coverage and fat intake. Among other determinants of fat intake, the increase in food restaurants, vendors and convenience stores explain a large proportion of the increased fat intake from 1997 to 2006. Policy implication of these findings is straightforward. To counter the increased obesity and other health-related problems encountered by Chinese adults, better management of the local food environment is necessary.
7. Acknowledgements
I acknowledged financial support from the National Science Council in Taiwan under the grant #100-2410-H- 002-070. The finding of this study is not reflected the view of the National Science Council in Taiwan, and I am responsible for any remaining error.
REFERENCES
- J. Gary, “How Was China’s Economic Emergency Contributed to the Field of Economics?” Comparative Economic Studies, Vol. 50, No. 2, 2008, pp. 167-209. doi:10.1057/ces.2008.14
- B. Popkin and P. Gordon-Larson, “The Nutrition Transition: Worldwide Obesity Dynamics and Their Determinants,” International Journal of Obesity, Vol. 28, No. 3, 2004, pp. S2-S9. doi:10.1038/sj.ijo.0802804
- World Health Organization, “The World Health Report: Reducing Risks, Promoting Healthy Life,” World Health Organization, Geneva, 2002.
- K. Huang, “Nutrient Elasticities in a Complete Food Demand System,” American Journal of Agricultural Economics, Vol. 78, No. 1, 1996, pp. 21-29. doi:10.2307/1243775
- A. Adelaja, R. Nayga and T. Lauderbach, “Income and Racial Differentials in Selected Nutrient Intakes,” American Journal of Agricultural Economics, Vol. 79, No. 5, 1997, pp. 1452-1460. doi:10.2307/1244360
- R. Nayga, “Effects of Socioeconomic and Demographic Factors on Consumption of Selected Food Nutrients,” Agricultural and Resource Economic Review, Vol. 23, No. 2, 1994, pp. 171-182.
- J. Variyam, “Double Impact: Education Attainment and the Macronutrient Intake of US Adults,” In: W. S. Chern and K. Rickertsen, Eds., Health, Nutrition and Food Demand, CABI, Wallingford, 2003, pp. 53-72. doi:10.1079/9780851996479.0053
- S. Du, B. Lu, F. Zhai and B. Popkin, “A New Stage of the Nutrition Transition in China,” Public Health Nutrition, Vol. 5, No. 1A, 2002, pp. 169-174. doi:10.1079/PHN2001290
- B. Popkin, “Nutrition in Transition: The Changing Global Nutrition Challenge,” Asia Pacific Journal of Clinical Nutrition, Vol. 10, 2001, pp. S13-S18.
- Y. Wang, B. Popkin and F. Zhai, “The Nutritional Status and Dietary Pattern of Chinese Adolescents, 1991 and 1993,” European Journal of Clinical Nutrition, Vol. 52, No. 12, 1998, pp. 908-916. doi:10.1038/sj.ejcn.1600664
- J. Woodridge, “Introductory Econometrics: A Modern Approach,” 4th Edition, South-Western Cengage Learning, Mason, 2009.
- P. Basiotis, M. Brown, S. Johnson and K. Morgan, “Nutrient Availability, Food Costs, and Food Stamps,” American Journal of Agricultural Economics, Vol. 65, No. 4, 1983, pp. 685-693. doi:10.2307/1240456
- S. Shimokawa, H. Chang and P. Pinstrup-Andersen, “Understanding the Differences in Obesity Among Working Adults Between Taiwan and China,” Asia Pacific Journal of Clinical Nutrition, Vol. 18, No. 1, 2009, pp. 88-95.
- C. Ramezani, “Determinants of Nutrient Demand: A Nonparametric Analysis,” Journal of Agricultural and Resource Economics, Vol. 20, No. 1, 1995, pp. 165-177.
- P. Lance, J. Akin, W. Dow and C. Loh, “Is Cigarette Smoking in Poorer Nations Highly Sensitive to Price? Evidence from Russia and China,” Journal of Health Economics, Vol. 23, No. 1, 2004, pp. 173-189. doi:10.1016/j.jhealeco.2003.09.004
- Y. Cai, P. Alviola, R. Nayga and X. We, “The Effect of Food-Away-From-Home and Food at Home Expenditures on Obesity Rates: A State Level Analysis,” Journal of Agricultural and Applied Economics, Vol. 40, No. 2, 2008, pp. 507-521.
- G. Becker, “A Theory of the Allocation of Time,” Economic Journal, Vol. 75, No. 299, 1965, pp. 493-517. doi:10.2307/2228949
- K. Lancaster, “A New Approach to Consumer Theory,” Journal of Political Economy, Vol. 74, No. 2, 1966, pp. 132-157. doi:10.1086/259131
- R. Koenker, “Quantile Regression,” Cambridge University Press, Cambridge, 2005. doi:10.1017/CBO9780511754098
- R. Koenker and G. Basset, “Regression Quantiles,” Econometrica, Vol. 46, No. 1, 1978, pp. 33-50. doi:10.2307/1913643