Journal of Environmental Protection
Vol.4 No.4(2013), Article ID:30751,4 pages DOI:10.4236/jep.2013.44046
Fluoride Mobilization Due to Coal Mining in Parts of Chhattisgarh
![]()
1Bhilai Institute of Technology Raipur, New Raipur, India; 2Applied Chemistry, Bhilai Institute of Technology, Durg, India.
Email: drpiyushkant_pandey@yahoo.com
Copyright © 2013 Piyush Kant Pandey et al. This is an open access article distributed under the Creative Commons Attribution License, which permits unrestricted use, distribution, and reproduction in any medium, provided the original work is properly cited.
Received July 22nd, 2012; revised February 25th, 2013; accepted March 27th, 2013
Keywords: Chhattisgarh; Contamination; Fluoride; Ground Water; Treatment
ABSTRACT
This paper reports the ground water quality deterioration due to fluoride in the parts of Chhattisgarh state. Out of selected 60 sites, high contamination of fluoride content up to 7.00 ppm was found in Kolam, Muragaon and Saraitola villages and in the range of 1.0 to 1.2 ppm in Basanpalli, Bhalumuda, Dolesara, Penkapara, Kunjhemura villages. Ten new areas were selected for yearly monitoring and fluoride concentration was found up to 1.44 ppm. The results call for immediate steps for monitoring and treatment of contaminated locations.
1. Introduction
Around 200 million people among from 25 nations the world over, are under the dreadful fate of fluorosis. India and China the two most populous countries of the world, are the most affected [1,2]. Concentration of fluoride in ground water is mainly due to natural or geogenic contamination which depends on the geogenic reasons of an area [3,4]. Fluorosis is endemic in 17 states of India. The most seriously affected areas are Andhra Pradesh [5-7], Punjab [8], Haryana [9], Rajasthan [10,11], Gujrat [12], Tamilnadu [13], Orissa [14], Maharashtra [15] and Uttar Pradesh [16]. Recently some highly fluoridated areas in Chhattisgarh have also been located. Out of selected 60 sites, high contamination of fluoride content up to 7.00 ppm was found in Kolam, Muragaon and Saraitola villages and in the range of 1.0 to 1.2 ppm in Basanpalli, Bhalumuda, Dolesara, Penkapara, Kunjhemura villages of Raigarh but when we moved ahead towards Sarguja (north to Raigharh) we found concentration of Fluoride up to 1.44 ppm, which is entirely related to the geological structure of the study area. Thus the main objective of the study was to assess the contamination of fluoride in water & its cause.
The Raigarh district (Figure 1) lies between 21˚22' - 22˚42' North latitude and 82˚55' to 83˚49' East longitude. The area is made up of sandstone, carbonaceous shale and feldspathtic stone. Surguja district (Figure 2) lies between 23˚37'25'' to 24˚6'17'' north latitude and 81˚34'40'' to 84˚4'40" east longitude.
2. Materials and Methods
Sampling of contaminated area was carried out in 2008. The sampling bottles of one liter capacity were cleaned with detergent, chromic acid, tap water and finally with double distilled water. Then the samples were collected in these pre cleaned bottles. Duplicate samples were collected from each sampling site. Water samples were analyzed in laboratory for different water quality parameters pH, conductivity, total dissolved solid (TDS), alkalinity, hardness, calcium, chloride, sulphate, nitrate and for heavy metals including iron, copper and zinc. Standard analytical methods were used for all water parameter: pH measured using a single electrode pH-meter, conductivity using a conductivity meter; alkalinity, calcium and chloride were analyzed titrimetrically, sulphate with a turbidity meter and nitrate by the brucine method (APHA, 1992) [17]. For detection of iron, copper and zinc Atomic Absorption Spectrophotometer (Varian AA240FS) was used. Analysis of fluoride was carried out by ion selective electrode.
3. Results and Discussion
Initially we randomly collected water samples from various locations of study area and then we had chosen ten particular locations for yearly monitoring of fluoride

Figure 1. Raigarh district.

Figure 2. Surguja district.
concentration. Statistical analysis shows that average fluoride concentration ranges from 0.39 ppm to 0.55 ppm with the mean value of 0.46 ppm. The results indicate that the fluoride is present in all samples analysed. The yearly mean values observed were pH 7.23, conductivity 0.48 µS, alkalinity 178 ppm, hardnerss 245 ppm, chloride 20 ppm, calcium 66 ppm, copper 0.13 ppm, sulphate 36 ppm, nitrate 1.65 ppm, fluoride 0.46 ppm, zinc 0.05 ppm and iron 0.02 ppm. The statistical analysis further showed very small values of Kurtosis and Skewness signifying relatively stable concentrations of all parameters during the study period. However the post monsoon season had shown the peaking of fluoride values and lowering of pH values during the season.
This picture becomes clearer if we take a single month of December 2008 (Tables 1 and 2). In the month of December the mean values observed were pH 7.02, conductivity (cond) 0.6 µS, alkalinity 279.5 ppm, hardness (hard) 254 ppm, chloride 6.66 ppm, calcium 93.6 ppm, copper 0.36 ppm, sulphate 27.7 ppm, nitrate 1.06 ppm, fluoride 1.17 ppm, zinc 0.01 ppm and iron 0.01 ppm. The higher mean value of fluoride is noteworthy. In the correlation studies on the entire data the fluoride showed positive correlation with conductivity, Total dissolved solid (TDS), alkalinity (Alk), chloride, calcium, nitrate and iron but shows negative correlation with pH, hardness, copper, sulphate and zinc.
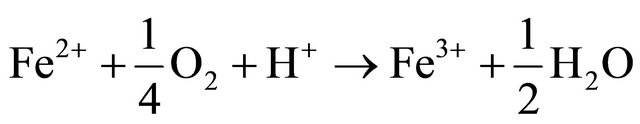
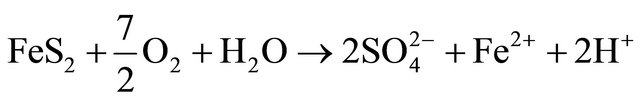
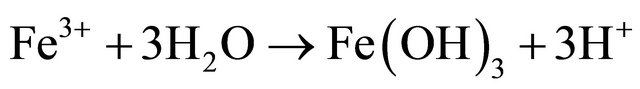
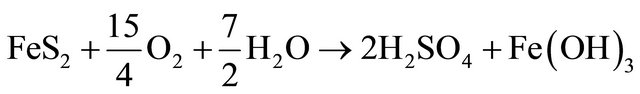
Based on correlation study (Table 2) the explanation of appearance of fluoride appears difficult. In the literature also the fluoride is generally attributed to the presence of sodium and potassium salts [18]. This paper did not find a conclusive correlation with sodium; hence it is felt that the source of fluoride is different. To account for it the coal deposits of the area were analysed. The area contains significant concentration of sulphides (0.5% - 3.5% S) in certain coal seams. The coal mining of the area has been taken up by various national and private mining agencies. We feel that the sulphide minerals, especially pyrite, FeS2, present in the host rock is causing the internal generation of sulphuric acid, giving the water low pH at the point of generation [19].
Fluoride is more readily available in high clay soils and calcium tends to increase fluoride immobilization. As the pH of water decreases it tends to dissolve the calcium compounds and hence it may be possible that the dissolution of calcium is making the fluoride mobile. This acidity generation is not widespread and we did not come across acid mine drainage (AMD) however a few stream beds in the area show a distinct mild deposition of gypsum. Gypsum formation accounts for near neutral drainage and the low levels of calcium and sulphate in the studied samples. The absence of calcium as a binding agent results in the presence of free fluoride; source of
Table 1. Statistical analysis of the results obtained in December at all stations.
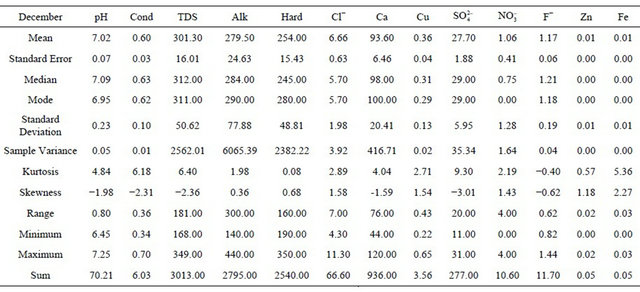
Table 2. Correlation matrix of the data set.
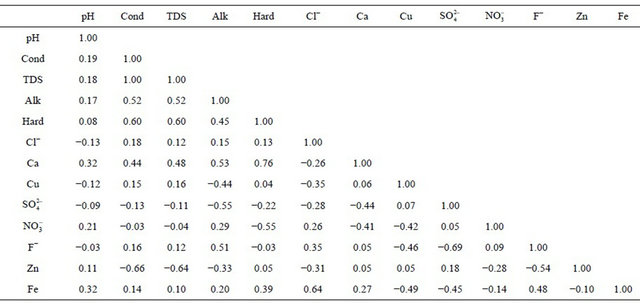
which is the geochemical reactions in the mildly acidic environment. Negative correlation obtained in our results between sulphate and fluoride proves the above theory. Geologic presence of fluoride and sulphur in the region is likely to further affect the water quality in the localized parts of Chhattisgarh state.
4. Conclusion
The studied area of Raigarh-Sarguja has shown significant presence of fluoride in the ground water. The probable reason for this appears to be the increasing coal mining actives in the region. Geologic presence of fluoride and sulphur in the region is likely further to affect the water quality in the Chhattisgarh state.
REFERENCES
- N. S. Rao and D. J. Devadas, “Fluoride Incidence in Groundwater in an Area of Peninsular India,” Environmental Geology, Vol. 45, No. 2, 2003, pp. 243-251. doi:/10.1007/s00254-003-0873-3
- Q. Xiang, Y. Liang, L. Chen, C. Wang, B. Chen, X. Chen and M. Zhou, “Effect of Fluoride in Drinking Water on Children’s Intelligence,” Fluoride, Vol. 36, No. 2, 2003, pp. 84-94.
- V. K. Saxena and S. Ahmed, “Dissolution of Fluoride in Groundwater: A Water-Rock Interaction Study,” Environmental Geology, Vol. 40, No. 9, 2001, pp. 1084-1087. doi:/10.1007/s002540100290
- R. Srikanth, K. S. Viswanatham, F. F. Ahsai, A. Fishahatsion and M. Asmellash, “Fluoride in Groundwater in Selected Villages in Eritrea (North East Africa),” Environmental Monitoring and Assessment, Vol. 75, No. 2, 2002, pp. 160-177. doi:/10.1023/A:1014491915537
- A. Nagaraju, M. R. S. Sarma, J. A. Aitkenhead-Peterson and K. Sunil, “Fluoride Incidence in Groundwater: A Case Study from Talupula, Andhra Pradesh, India,” Environmental Monitoring and Assessment, Vol. 172, No. 1-4, 2010, pp. 423-427.
- K. Brindha, R. Rajesh, R. Murugan and L. Elango, “Natural and Anthropogenic Influence on the Fluoride and Nitrate Concentration of Groundwater in Parts of Nalgonda District, Andhra Pradesh, India,” Joumal of Applied Geochemistry, Vol. 12, No. 2, 2010, pp. 231-241.
- R. S. Sathish, B. Ranjit, K. M. Ganesh, G. Nageswara Rao and C. Janardhana, “A Quantitative Study on the Chemical Composition of Renal Stones and Their Fluoride Content from Anantapur District, Andhra Pradesh, India,” Current Science, Vol. 94, No. 1, 2008, pp. 104- 109.
- S. S. Jolly, “An Epidemiological, Clinical and Biochemical Study of Endemic Dental and Skeletal Fluorosis in Punjab,” Fluoride, Vol. 1, No. 2, 1968, pp. 65-75.
- Meenakshi, V. K. Garg, Renuka and A. Malik, “Ground Water Quality in Some Villages in Haryana, India: Focus on Fluoride and Fluorosis,” Journal Hazardous Material, Vol. 106, No. 1, 2004, pp. 85-97. doi:/10.1016/j.jhazmat.2003.09.007
- A. K. Yadav, A. Kumar and P. Khan, “Fluoride and Flurosis Status in Groundwater of Todaraisingh Area of District Tonk (Rajasthan, India): A Case Study,” International Journal of Chemical, Environmental and Pharmaceutical Research, Vol. 1, No. 1, 2010, pp. 6-11.
- D. Muralidharan, A. P. Nair and U. Sathyanarayana, “Fluoride in Shallow Aquifers in Rajgarh Tehsil of Churu District Rajasthan—An Arid Environment,” Current Science, Vol. 83, No. 6, 2002, pp. 699-702.
- S. D. Dhimani and A. K. Keshari, “Hydrogeochemical Evaluation of High-Fluoride Ground Waters: A Case Study from Mehsana District, Gujarat, India,” Hydrological Sciences Journal, Vol. 51, No. 6, 2006, pp. 1149- 1162. doi:/10.1623/hysj.51.6.1149
- G. Viswanathan, S. Gopalakrishnan and S. S. Ilango, “Assessment of Water Contribution on Total Fluoride Intake of Various Age Groups of People in Fluoride Endemic and Non-Endemic Areas of Dindigul District, Tamil Nadu, South India,” Water Research, Vol. 44, No. 20, 2010, pp. 186-200. doi:/10.1016/j.watres.2010.07.041
- N. Kundu, M. K. Panigrahi, S. Tripathy, S. Munshi, M. A. Powell and B. R. Hart, “Geochemical Appraisal of Fluoride Contamination of Groundwater in the Nayagarh District of Orissa, India,” Environmental Geology, Vol. 41, No. 3-4, 2001, pp. 451-460. doi:/10.1007/s002540100414
- A. N. Tiwari, V. P. Nawale, J. A. Tambe and Y. S. Kumar, “Correlation of Fluoride with Bicarbonate in Groundwater of Exploratory Wells in Parts of Maharashtra,” Journal of Applied Geochemistry, Vol. 10, No. 1, 2008, pp. 93- 102.
- B. S. Sharma, J. Agrawal and A. K. Gupta, “Emerging Challenge: Fluoride Contamination in Groundwater in Agra District, Uttar Pradesh,” Asian Journal of Experimental Biological Sciences, Vol. 2, No. 1, 2011, pp. 131- 134.
- APHA/AWWA/WPCF, “Standard Methods for the Examination of Water and Wastewater,” 18th Edition, American Public Health Association, Washington DC, 1992.
- M. K. Beg, S. K. Srivastav, E. J. M. Carranza and J. B. de Smeth, “High Fluoride Incidence in Groundwater and Its Potential Health Effects in Parts of Raigarh District, Chhattisgarh, India,” Current Science, Vol. 100, No. 5, 2011, pp. 750-754.
- E. A. Keller, “Environmental Geology,” CBS Publisher and Distributer, Delhi, 1985.