International Journal of Astronomy and Astrophysics
Vol. 3 No. 2 (2013) , Article ID: 32739 , 13 pages DOI:10.4236/ijaa.2013.32018
New Candidate Massive Clusters from 2MASS
Centre for Astrophysics and Planetary Science, University of Kent, Canterbury, UK
Email: df@star.kent.ac.uk
Copyright © 2013 Dirk Froebrich. This is an open access article distributed under the Creative Commons Attribution License, which permits unrestricted use, distribution, and reproduction in any medium, provided the original work is properly cited.
Received January 24, 2013; revised February 25, 2013; accepted March 6, 2013
Keywords: Open Clusters and Associations; General; Galaxies; Star Clusters; General
ABSTRACT
Massive stars are important for the evolution of the interstellar medium. The detailed study of their properties (such as mass loss, rotation, magnetic fields) is enormously facilitated by samples of these objects in young massive galactic star clusters. Using 2MASS we have searched for so far unknown candidates of red supergiant clusters along the Galactic Plane. Utilising deep high resolution UKIDSS GPS and VISTA VVV data to study colour-magnitude diagrams, we uncover six new massive cluster candidates in the inner Galaxy. If spectroscopically confirmed as real clusters, two of them could be part of the Scutum-Complex. One cluster candidate has a number of potential red supergiant members comparable to RSGC1 and 3. Our investigation of UKIDSS data reveals for the first time the main sequence of the massive cluster RSGC2. The stars of the sequence show an increased projected density at the same position as the known red supergiants in the cluster and have E(J-K) = 1.6 mag. This either indicates an unusual extinction law along the line of sight or a much lower near infrared extinction to the cluster than previously estimated in the literature. We suggest that psf-photometry in UKIDSS images might be able to uncover the main sequence of other RSGC clusters.
1. Introduction
The pivotal role of massive stars in the evolution of galaxies is undisputed. They emit enormous amounts of ionising radiation, have extreme mass loss episodes and ultimately undergo supernova or gamma-ray burst explosions that inject energy, momentum and chemically enriched material into the surroundings. This feedback shapes the circumjacent interstellar medium and impacts (positively or negatively) on subsequent star formation. Most massive stars are formed in a clustered environment and are short lived [1]. Thus, the best way to study them is to investigate young massive clusters. These clusters typically contain larger samples of massive stars and provide the additional advantage that one can measure their distances, ages and reddening relatively accurately.
Recent years have seen a flurry of discoveries (or verification) of massive star clusters in the Galaxy. These include e.g. Westerlund1 [2], three red supergiant clusters (RSGC) in the Scutum-Complex (RSGC1, 2, 3; [3- 5]), other objects in this extended region (e.g. Alicante8, [6]) and even clusters at the far end of the bar (Mercer81 [7]). These clusters are usually heavily obscured but have the advantage of being relatively nearby compared to extragalactic systems, hence allowing us to study individual stars (or systems) in detail. Furthermore, the brightest stars in these clusters, the red supergiants (RSG), have such huge luminosities (−11 mag £ MK £ −8 mag [3]) that they are easily visible accross the entire Galaxy even behind large amounts of extinction.
Here we aim to investigate if there are further unknown clusters of bright RSGs in the Milky Way that are detectable in the 2Micron All Sky Survey (2MASS, [8]). In Section 2. we outline the methods of our search for cluster candidates. The discovered objects and some of their properties are discussed in Section 2, with particular emphasis on the main sequence detection in RSGC2 in Section 3.3. We conclude our work in Section 4.
2. Data and Analysis Methods
We aim to identify possible clusters and associations of RSG stars in the Galactic Plane. Their absolute K-band magnitudes can range from −8 mag to −11 mag e.g. in RSGC1, 2, 3, [3-5]. This means that they are brighter than K = 10 mag for distances of 15 kpc and extinction values of up to AK = 5 mag. We hence select all stars from the 2MASS point source catalogue [8] which are brighter than K = 10 mag and that have a photometric quality flag of Qflg = “AAA”. Since all selected stars are bright, the latter criterion is not essential for our analysis and only some extremely bright objects are removed. This selection leaves 1.297.713 point sources distributed on the entire sky.
Most massive star formation in the Milky Way, and hence most massive clusters with RSGs, are believed to be situated within a few kiloparsec from the centre of the Galaxy. Hence, we focus our search on the range 240˚ £ RA £ 285˚ and −55˚ £ DEC £ +5˚, which covers everything less than 35˚ from the Galactic Centre. This area of the sky includes the majority of bright K-band sources, leaving 992.387 2MASS objects to investigate.
The known RSGCs mentioned above show a clear overdensity of K-band bright stars of particular colours in an area of several arcminutes in size. We adopt the near infrared (NIR) colours and magnitudes of the spectroscopically confirmed RSG stars in RSGC3 from [5]. The authors determine a cluster distance of about 6 kpc and a near infrared extinction of about AK = 1.5 mag for the spectroscopically confirmed cluster members. The near infrared colour and magnitude box that encloses most of the RSGs in the cluster has the borders 2.7 mag £ (J-K) £ 3.8 mag and 5.0 mag £ K £ 7.0 mag, i.e. the box is 2mag wide in K and 1.1mag wide in (J-K). We can simply “de-redden” this colour magnitude box to various distances and extinction values to search for local overdensities (see below). For the purpose of this we adopt AK = 1.62 ´ E(J-K) following [9], but note that due to our search strategy the actual choice of extinction law is completely irrelevant for the cluster candidate detection.
We “de-redden” the colour magnitude box to distances d between 4 kpc and 12 kpc (in steps of 2 kpc) and extinction values AK from 1.0 mag to 2.5 mag (in steps of 0.25 mag). This range of distances and AK values should allow us to identify all clusters with RSG stars in the entire inner Galaxy. Note that even if we identify a cluster candidate for a given d and AK combination, it will not necessarily be an object with these parameters since the apparent magnitudes and colours of the RSG cluster members can vary quite significantly with spectral type, age and local extinction (see e.g. Figure 19 in [3]). For each of the d and AK combinations we determine a map of local stellar overdensities as described below. In total there are 35 maps due to the five distances and seven extinction values choosen.
Of the known clusters with red supergiants, RSGC1 seems to be the most compact with almost all RSGs less than 2’ from the cluster centre [3]. In contrast RSGC2 has many members that are more than 4’ from the centre [4]. As a compromise we search for clusters within a 6’ ´ 6’ box. To determine the local excess of bright stars in this box, we choose as the control field a 18’ ´ 18’ sized box surrounding the central area. We apply an oversampling of two, hence the pixelsize is 3’ in the final star density maps.
We estimate the mean star density in the central area for each colour-magnitude box and subtract the mean star density in the surrounding control field. If there is an overdensity the pixel value in the final map will be the local stellar overdensity. Otherwise the pixel value is set to zero to subtract the large scale stellar density. We then average all the maps for the same distance and different extinction values, resulting in five maps of local overdensities, one for each distance. The averaging will increase the signal to noise ratio in the star density maps, since real clusters will be visible in maps made for several extinction values. This is caused in part by possible differential reddening of the cluster stars (up to 1.8 mag in AK in e.g. RSGC1 [4]) and the fact that the search boxes overlap (0.25 mag steps in AK convert to shifts of only 0.15 mag in (J-K) compared to the 1.1 mag wide search box). Finally, a Gaussian smoothing with 9’ full width half maximum is applied to the maps prior to the search for candidate clusters.
3. Results
3.1. RSGC Candidate Selection
In each of the five smoothed local overdensity maps we identified the 10 highest peaks as potential RSGC candidates. If this includes candidates within 5˚ from the Galactic Centre (this is especially the case for larger distances, i.e. fainter stars) we also identified the 10 highest peaks along the rest of the Galactic Plane outside this 5˚ radius. Note that close to the Galactic Centre, holes in GMCs lead to high peaks in the density maps, due to the overall large star density in this area. These peaks will hence always appear higher than any real cluster candidate away from the central region. Hence, many real candidates (even RSGC3) would be missed without the above restriction.
We then merged the individual lists of candidates from the different distance maps. Objects were considered the same, if they are less than 3’ away from each other in two different maps. Please note that we use the density maps to determine the cluster coordinates. For consistency, we use these coordinates even for the known clusters. This explains the slight deviation of the position in Table 1 compared to published values for the known clusters.
This resulted in 49 cluster candidates, 15 of which are situated within 5˚ from the Galactic Centre. All of the candidates are cross-matched against SIMBAD, the current online version1 of the open cluster list based on [10] and the list of cluster candidates from [11]. We recover 5 known clusters. These are RSGC1, 2, 3 ([3-5]) as well as Alicante10 [12]. The remaining fifth object, identical to [DB2000]54 [13], has been identified as spurious by [14]. We confirm this result and after consideration of the NIR photometry do not consider this object a cluster (see below). We also identify some objects close to, but not identical to known (candidate) clusters (Kharchenko3 [10], FSR1755 [11], Bochum14 [15], Westerlund1 [16]).
To verify the nature of the new cluster candidates as potential RSGCs we compare their NIR colour-colour and colour-magnitude diagrams with the known RSGCs in our sample. For this purpose we utilise 2MASS data as well as deeper high resolution photometry from the UKIRT Infrared Deep Sky Survey (UKIDSS [17]) Galactic Plane Survey (GPS [18]) and the VISTA Variables in the Via Lactea survey (VVV—[19]) data release1 [20]. All 2MASS point sources with a quality flag better than Qflg = “CCC” are used. From the deeper UKIDSS/VVV data we only utilise sources fainter than 11 mag in each of the NIR JHK filters to avoid saturation effects. Furthermore, only objects with pstar ³ 0.999656, merged class = (−2 or −1), and priOrSec = 0 or priOrSec = framesetID are used. This ensures that only stellar like objects with good photometry are included in the subsequent analysis (see [18] for details).
We performed a photometric decontamination (based on [21,22]) to determine photometric cluster membership probabilities for all stars in each cluster. This was done for the 2MASS and UKIDSS/VVV data sets seperately. Stars in the inner 3’ around the cluster centre are considered part of the cluster, while stars between 5’ and 9’ are taken as control objects. We applied the method detailed in [22] and used the 15th nearest neighbour in the colour-colour-magnitude space to establish membership probabilities. We varied this number, as well as the size of the cluster and control field to verify our results. The exact choice of these “free” parameters does, however, not influence our results and interpretation.
We then inspected all the cluster candidates and selected only objects that resembled the known RSGCs in our sample. In other words we only selected candidates that clearly show an overdensity of bright stars (the potential RSGs) and either no further sign of other potential cluster members (such as for RSGC1) or the indication of a main sequence (such as in RSGC2, see below). Most objects that are removed from our original list are holes in the extinction in molecular clouds, mimicing cluster candidates. Essentially such holes can generate sequences of giant stars which resemble the red giant branch of an old open or globular cluster. As an example we show the combined 2MASS and UKIDSS colour-magnitude diagram for our cluster candidate F3 and one rejected object in Figure 1. In this plot all stars with K < 12 mag are taken from 2MASS, while all fainter sources are from UKIDSS. Larger symbols indicate higher membership probabilities and one can clearly see a group of bright red stars which could be RSGs. In Table A1 in the Appendix we show the diagrams for all RSGC candidates and known clusters for comparison.
After this selection there are 10 RSGC candidates remaining. Four of them are the known clusters RSGC1, 2, 3 and Alicante10, while the remaining six are so far unknown objects. We show photometrically decontaminated diagrams of all these objects in Table A1 in the Appendix. For all cluster candidates we added up the cluster membership probabilities of the RSG candidate

Table 1. Cluster properties: Here we list the names and positions for our cluster candidates. The positions coincide with the centre of the cluster in our star density maps, and might hence deviate from the more accurately determined centres for the already known clusters. We also list the isochrone parameters used in the colour magnitude diagrams for our cluster candidates. Note that the isochrones are not used to determine any cluster parameters, they are merely for orientation. The column NRSG lists the sum of all membership probabilities for the RSG candidate stars in each cluster. For the known clusters we list in brackets the number of spectroscopically confirmed RSGs. This indicates that the summed up membership probabilities typically amounts to 60% of the RSG population in the known clusters.


Figure 1. Combined 2MASS (K < 12 mag) and UKIDSS (K > 12 mag) decontaminated colour-magnitude diagram for cluster candidate F3 (top panel) and one of our rejected candidates (bottom panel). The over plotted isochrone has an age of 16 Myrs, a distance of 9 kpc and AK = 1.3 mag. Larger symbols indicate higher membership probabilities P with: Red P > 80%, Green 80% > P > 60%, Blue 60% > P > 40%, Magenta 40% > P > 20% and Black P < 20%.
cluster members. Typically these are all stars brighter than K = 8 mag. The sum of the membership probabilities is indicative of the number of RSG stars (NRSG) in the cluster and thus potentially of the cluster mass. We list these values in Table 1 together with the number of spectroscopically confirmed RSG stars in each of the known clusters. The number of confirmed RSG members in the clusters is consistently a factor of 1.6 to 1.8 larger than the value of NRSG.
The colour-magnitude diagrams in Table A1 in the Appendix contain an isochrone for each cluster that is based on the Geneva models by [23]. Table 1 lists the properties (distance, age, extinction) used for each cluster candidate. Note, that since we do not know the age of the new cluster candidates, we use 16 Myrs for all of them. We do not aim to determine any cluster properties using those isochrones since it is not possible from photometry alone. The isochrones are only plotted for orientation and hence the extinction law used [9] to convert AK into E(J-K) is not of importance. Furthermore, the applied set of isochrones from [23] works best with the parameters listed in Table 1, which might be slightly different to more accurate published values for the known clusters in our sample.
3.2. New Cluster Candidates
Below we briefly discuss the appearance of the new cluster candidates with respect to the known objects in our sample.
F1: This is the only candidate that has no deep high resolution NIR data, as DR1 of the VVV contains almost no objects in the cluster area. However, there are 5 - 6 bright stars with extremely similar colours which could hint that this is indeed a cluster. On the other hand, there is a sequence of high membership probability objects at (J-K) = 3.2 mag in the 2MASS data, which is indicative of a hole in a cloud. When the next set of VVV data is released we will have the ability to verify or disregard this object as a candidate clusters. If object F1 is confirmed as real, the sequence of high probability members at (J-K) = 2.1 mag could be the top of the main sequence.
F2: This is a weak candidate as it has only a small number of RSG candidate stars spread over a large range of colours and magnitudes. However, like RSGC1, this object has almost no other high probability cluster members down to K = 12 mag in the 2MASS data, nor is there any sign of a potential main sequence visible in the UKIDSS data.
F3: Based on the NRSG value of potential RSGs in the cluster, this could be the most massive candidate if confirmed. The number of RSG stars is comparable to RSGC2 and 3. The bright cluster members are fainter than for most of the other candidates, hinting to either a different age or a larger distance. This is indicated by the distance of 9 kpc that needs to be used to fit the isochrone with our assumed age of 16 Myrs.
F4: This is a weak candidate as it has a small number of bright RSG candidate members. However, the sequence of high probability cluster members at (J-K) = 2.5 mag, visible in 2MASS and UKIDSS data, could be the upper end of the main sequence.
F5: Not unlike candidate F2, this object has just a handful of bright high probability members and no other possible members down to the 2MASS detection limit and there is no clear indication of a main sequence in the UKIDSS data.
F6: This candidate also just has a small number of potential members, which are, however, clearly separated (in colour-magnitude space) from the other stars in the field.
Based on their position, candidates F5 and F6 could be part of the same region that is traced by the other massive RSGCs at 25˚ < l < 30˚. This Scutum-Complex [6] is situated at the near end of the bar which might have triggered an increased star-burst like star formation activity over the last 20 Myrs, judging by the inferred ages of the massive clusters in this region.
So far only one massive cluster (Mercer81, [7,24]) is known to be situated at the far end of the bar (l » 338˚). Our search has not revealed any new candidate clusters in the area. This could either be caused by a lack of such objects at this position, or due to observational biases (a combination of larger distance, increased extinction and crowding). Certainly, searches and analysis of the deeper, higher resolution VVV images (such as e.g. done by [25] and [26]), will enable us to study this region in more detail. We’d like to note that our selection procedure is optimised to detect cluster candidates similar to RSGC1, 2, 3. Other massive clusters which are younger are not selected. For example Westerlund1, the Arches and Quintuplet clusters are not detected in our maps.
3.3. The Main Sequence of RSGC2
With the possible exception of the new objects F1 and F4, none of the cluster candidates shows a clear sign of a detection of cluster main sequence stars. In particular, the known objects RSGC1, 3 and Alicante 10 show absolutely no indication of potential main sequence clusters members. As can be seen in Figure 2, our photometric decontamination of the 2MASS and UKIDSS data reveals a clear sequence of main sequence stars in RSGC2. This is the first detection of the main sequence in any of the known RSG clusters.
The sequence is less convincing in the 2MASS data, but seems to start at about K = 10 mag. The small number of high probability member stars fainter than K = 11.5 mag could be real or caused by increased crowding for these faint objects. In either case, the sequence is much more obvious in the decontaminated UKIDSS photometry than in the 2MASS data. We excluded any stars brighter than K = 11 mag since they may have been saturated. Hence, we cannot determine the upper end of the main sequence from the UKIDSS data set. As for the 2MASS data, there is a drop in numbers at the faint end (around K = 14.6 mag) which could again be attributed to increased crowding for these faint stars. In Figure 3 we show the spacial distribution of the high probability cluster members, restricted to the RSG stars and the main sequence objects. As one can clearly see, both groups cluster at the same position, slightly off-centre in the diagram, a clear indication that the main sequence and the RSGs are related.
The typical (J-K) colour for the high probability cluster members along the sequence is (J-K) = 1.5 mag. From the isochrones of [23] one finds the typical intrinsic
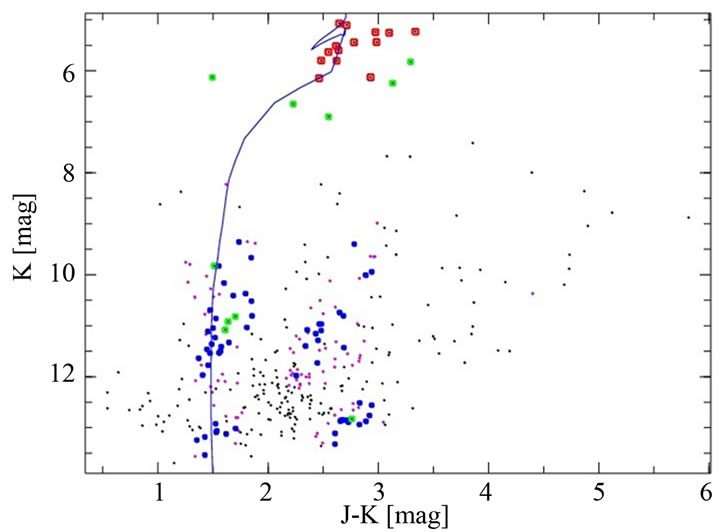
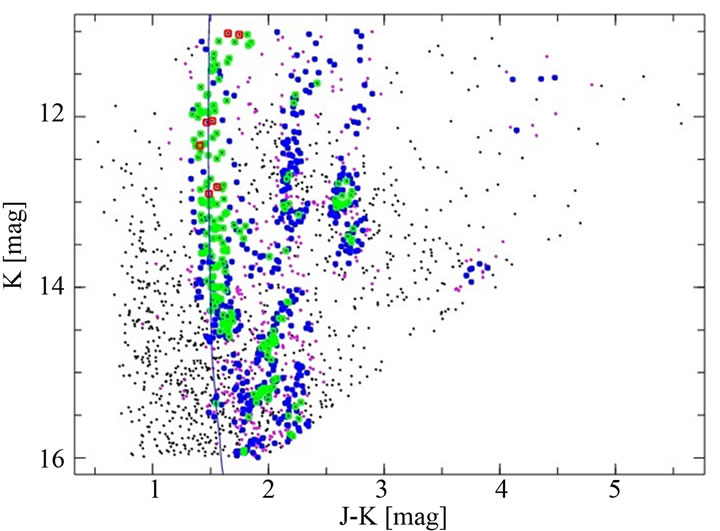
Figure 2. 2MASS (top panel) and UKIDSS (bottom panel) decontaminated colour-magnitude diagram for RSGC2. The over plotted isochrone has an age of 12 Myrs, a distance of 6 kpc and AK = 1.0 mag. One can clearly identify the main sequence of the cluster at (J-K) = 1.5 mag. Symbol size and colour coding are the same as in Figure 1.
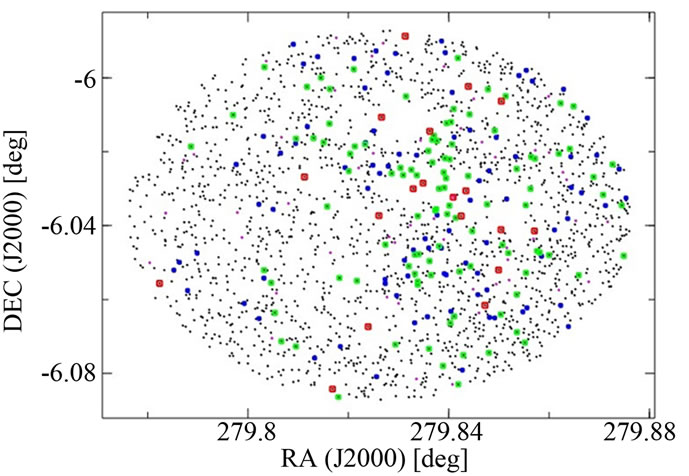
Figure 3. Spatial distribution of high probability cluster members of RSGC2. Only RSG candidates (K < 7 mag) and main sequence candidates (J-K) < 1.8 mag and K < 14.5 mag are shown. One can clearly see that the main sequence objects (mostly green symbols)—cluster in the same place as the RSGs (mostly red), slightly off-centre from the adopted coordinates. Symbol size and colour coding are the same as in Figure 1.
colour of massive main sequence stars is (J-K) = −0.1 mag. Thus, the cluster main sequence has E(J-K) = 1.6 mag. [4] find an average extinction towards the cluster of AK = 1.44 ± 0.02 mag. To bring these two values into agreement one would need AK/E(J-K) = 0.9. This value is quite high compared to what is found from other extinction laws e.g. 0.62 from [9], 0.67 from [27] or even 0.42 from [28]. If a value of 0.65 is somehow representative for the extinction law in this region, then AK for the cluster should be of the order of 1.05 ± 0.1 mag. This is indeed in agreement with the minimum (and not the average) extinction values found for the RSG stars in this cluster by [4] (see their Table 2). However, a large fraction of the RSG stars seem to have a much higher extinction.
Spectroscopic follow up of the potential main sequence cluster members will allow us to put tighter constraints on the cluster’s reddening, age and mass function as well as the line of sight extinction law. Based on the top of the main sequence at about K = 10 mag, the age, extinction for the cluster given in [4] and the isochrones from [23], the most massive stars along the sequence at (J-K) = 1.5 mag should have masses of about 14  and the sequence is at least visible down to 5.5
  (at K = 14.5 mag).
One question remains: Why can the main sequence only be seen in this cluster and not, e.g. in the neighbouring clusters RSGC1 or 3? In other words: What sets this object apart from the others? The extinction could be one factor, since RSGC2 has the lowest of all clusters. But since RSGC3 has a very similar AK value, this can not be the main cause. The abrupt end of the main sequence about 1.5 mag above the detection limit (for both data sets, 2MASS and UKIDSS), hints that increased crowding will effect the photometry sufficiently to cause difficulties in detecting a main sequence. However, the general star density in the region of RSGC3 is the same as for RSGC2 and near RSGC1 there are actually only half as many stars per square degree. The most plausible explanation is that the bright RSG stars in the cluster prevent the detection of fainter, potential main sequence, stars in their immediate vicinity. This is evident in the plots of the positions of cluster members in Table A1 in the Appendix. As has been mentioned above, RSGC2 is the most spatially extended of the known investigated clusters in this paper. Hence, the bright RSGs do not influence the photometry of such a large fraction of the cluster area. The compactness of the other clusters might hence prevent a proper detection of the main sequence stars with aperture photometry. A re-analysis of the UKIDSS images with psf-photometry should remedy this situation.
4. Conclusions
Utilising bright (K < 10 mag) and high signal to noise (Qflg = “AAA”) 2MASS sources and known colours and magnitudes of RSGs in the massive cluster RSGC3, we have searched for candidate massive clusters along the Galactic Plane less than 35˚ from the Galactic Centre. Deep NIR photometry from the UKIDSS and VVV surveys has been used to photometrically decontaminate the cluster candidate fields to distinguish real cluster candidates from random associations of bright stars or holes in the extinction of giant molecular clouds.
As a result of this process we selected 10 good candidate RSG clusters. Four of these are the known massive clusters RSGC1, 2, 3 and Alicante 10. The remaining six objects are good candidates for massive clusters in the inner Galaxy, but need spectroscopic confirmation. Two of the new candidates (F5 and F6) could be part of the Scutum-Complex, while F3 (if confirmed as real) has a number of RSG candidate stars comparable to RSGC2 and 3.
The photometric decontamination of the UKIDSS data of RSGC2 reveals for the first time the main sequence of this cluster which appears to start at about K = 10 mag. The main sequence stars cluster at the same position as most of the cluster’s RSGs and show E(J-K) = 1.6 mag. This either indicates an unusual extinction law along this line of sight or a much lower K-band extinction than previously measured for this object (1.05 mag instead of 1.44 mag). The spatial extent of the cluster may have allowed the detection of the main sequence, in contrast to the other known RSG clusters. Performing point spread function photometry in the UKIDSS images may hence also allow us to detect their main sequence.
5. Acknowledgements
DF would like to thank I. Negueruela for his invaluable comments on the new cluster candidates. This publication makes use of data products from the Two Micron All Sky Survey, which is a joint project of the University of Massachusetts and the Infrared Processing and Analysis Center/California Institute of Technology, funded by the National Aeronautics and Space Administration and the National Science Foundation. This research has made use of the SIMBAD database, operated at CDS, Strasbourg, France.
REFERENCES
- I. Brott, S. E. de Mink, M. Cantiello, N. Langer, A. Koter, C. J. Evans, I. Hunter, C. Trundle, et al., “Rotating Massive Main-Sequence Stars. I. Grids of Evolutionary Models and Isochrones,” Astronomy & Astrophysics (A&A), Vol. 530, 2011, p. 115. doi:10.1051/0004-6361/201016113
- J. S. Clark, I. Negueruela, P. A. Crowther and S. P. Goodwin, “On the Massive Stellar Population of the Super Star Cluster Westerlund 1,” Astronomy & Astrophysics (A&A), Vol. 434, No. 3, 2005, pp. 949-969. doi:10.1051/0004-6361:20042413
- D. F. Figer, J. W. MacKenty, M. Robberto, K. Smith, F. Najarro, R. P. Kudritzki and A. Herrero, “Discovery of an Extraordinarily Massive Cluster of Red Supergiants,” The Astrophysical Journal, Vol. 643, No. 2, 2006, pp. 1166- 1179. doi:10.1086/503275
- B. Davies, D. F. Figer, R. P. Kudritzki and J. MacKenty, “A Massive Cluster of Red Supergiants at the Base of the Scutum-Crux Arm,” The Astrophysical Journal, Vol. 671, No. 1, 2007, pp. 781-801. doi:10.1086/522224
- J. S. Clark, I. Negueruela, B. Davies and V. M. Larionov, “A Third Red Supergiant Rich Cluster in the ScutumCrux Arm,” Astronomy & Astrophysics (A&A), Vol. 498, No. 1, 2009, pp. 109-114. doi:10.1051/0004-6361/200911945
- I. Negueruela, C. Gonzalez-Fernandez, A. Marco, J. S. Clark and S. Martinez-Nunez, “Another Cluster of Red Supergiants Close to RSGC1,” Astronomy & Astrophysics (A&A), Vol. 513, 2010, p. 74. doi:10.1051/0004-6361/200913373
- B. Davies, D. de La Fuente, F. Najarro and J. A. Hinton, “A Newly Discovered Young Massive Star Cluster at the Far End of the Galactic Bar,” Mathematics & Physical Sciences, Vol. 419, No. 3, 2012, pp. 1860-1870. doi:10.1111/j.1365-2966.2011.19840.x
- M. F. Skrutskie, R. M. Cutri, R. Stiening, M. D. Weinberg, S. Schneider, J. M. Carpenter, C. Beichman and R. Capps, “The Two Micron All Sky Survey (2MASS),” The Astrophysical Journal, Vol. 131, No. 2, 2006, pp. 1163- 1183. doi:10.1086/498708
- J. S. Mathis, “Interstellar Dust and Extinction,” Astronomy and Astrophysics, Vol. 28, 1990, pp. 37-70. doi:10.1146/annurev.aa.28.090190.000345
- W. S. Dias, B. S. Alessi, A. Moitinho and J. R. D. Lepine, “New Catalogue of Optically Visible Open Clusters and Candidates,” Astronomy & Astrophysics (A&A), Vol. 389, 2002, pp. 871-873. doi:10.1051/0004-6361:20020668
- D. Froebrich, A. Scholz and C. L. Raftery, “A Systematic Survey for Infrared Star Clusters with |b|<20˚ Using 2MASS,” Mathematics & Physical Sciences, Vol. 374, No. 2, 2007, pp. 399-408. doi:10.1111/j.1365-2966.2006.11148.x
- C. Gonzalez-Fernandez and I. Negueruela, “A Third Cluster of Red Supergiants in the Vicinity of the Massive Cluster RSGC3,” Astronomy & Astrophysics (A&A), Vol. 539, 2012, p. 100. doi:10.1051/0004-6361/201118090
- C. M. Dutra and E. Bica, “New Star Clusters Projected Close to the Galactic Centre,” Astronomy & Astrophysics (A&A), Vol. 359, 2000, pp. 9-12.
- C. M. Dutra, S. Ortolani, E. Bica, B. Barbuy, M. Zoccali and Y. Momany, “NTT Infrared Imaging of Star Cluster Candidates towards the Central Parts of the Galaxy,” Astronomy & Astrophysics (A&A), Vol. 408, 2003, pp. 127- 134. doi:10.1051/0004-6361:20030944
- A. F. J. Moffat and N. Vogt, “Southern Open Star Clusters VI. UBV-Hbeta Photometry of 18 Clusters from Centaurus to Sagittarius,” Astronomy and Astrophysics, Vol. 20, 1975, pp. 155-182.
- B. E. Westerlund, “Photometry and Spectroscopy of Stars in the Region of a Highly Reddened Cluster in ARA,” Astronomy and Astrophysics, Vol. 70, No. 3, 1987, pp. 311-324.
- A. Lawrence, S. J. Warren, O. Almaini, A. C. Edge, N. C. Hambly, R. F. Jameson, P. W. Lucas, M. E. Casali, et al., “The UKIRT Infrared Deep Sky Survey (UKIDSS),” Mathematics & Physical Sciences, Vol. 379, No. 4, 2007, pp. 1599-1617. doi:10.1111/j.1365-2966.2007.12040.x
- P. W. Lucas, M. G. Hoare, A. Longmore, A. C. Schröder, C. J. Davis, A. Adamson, R. M. Bandyopadhyay, R. de Grijs, et al., “The UKIDSS Galactic Plane Survey,” Mathematics & Physical Sciences, Vol. 391, No. 1, 2008, pp. 136- 163. doi:10.1111/j.1365-2966.2008.13924.x
- D. Minniti, P. W. Lucas, J. P. Emerson, R. K. Saito, M. Hempel, P. Pietrukowicz, A. V. Ahumada, M. V. Alonso, J. Alonso-Garcia, et al., “VISTA Variables in the Via Lactea (VVV): The Public ESO Near-IR Variability Survey of the Milky Way,” New Astronomy, Vol. 15, No. 5, 2010, pp. 433- 443. doi:10.1016/j.newast.2009.12.002
- R. K. Saito, M. Hempel, D. Minniti, P. W. Lucas, M. Rejkuba, I. Toledo, O. A. Gonzalez, J. Alonso-Garcia, et al., “VVV DR1: The First Data Release of the Milky Way Bulge and Southern Plane from the Near-Infrared ESO Public Survey VISTA Variables in the Via Lactea,” Astronomy & Astrophysics (A&A), Vol. 537, 2012, p. 107. doi:10.1051/0004-6361/201118407
- C. Bonatto and E. Bica, “Open Clusters in Dense Fields: The Importance of Field-Star Decontamination for NGC 5715, Lynga 4, Lynga 9, Trumpler 23, Trumpler 26 and Czernik 37,” Mathematics & Physical Sciences, Vol. 377, No. 3, 2007, pp. 1301-1323. doi:10.1111/j.1365-2966.2007.11691.x
- D. Froebrich, S. Schmeja, D. Samuel and P. W. Lucas, “Old Star Clusters in the FSR Catalogue,” Mathematics & Physical Sciences, Vol. 409, No. 3, 2010, pp. 1281-1288. doi:10.1111/j.1365-2966.2010.17390.x
- T. Lejeune and D. Schaerer, “Database of Geneva Stellar Evolution Tracks and Isochrones for (UBV)_{J}(RI)_{C} JHKLL’M, HST-WFPC2, Geneva and Washington Photometric Systems,” Astronomy & Astrophysics (A&A), Vol. 366, 2001, pp. 538-546. doi:10.1051/0004-6361:20000214
- E. P. Mercer, D. P. Clemens, M. R. Meade, B. L. Babler, R. Indebetouw, B. A. Whitney, C. Watson and M. G. Wolfire, “New Star Clusters Discovered in the GLIMPSE Survey,” The Astrophysical Journal, Vol. 635, No. 1, 2005, pp. 560-569. doi:10.1086/497260
- J. Borissova, C. Bonatto, R. Kurtev, J. R. A. Clarke, F. Penaloza, S. E. Sale, D. Minniti, J. Alonso-Garcia, et al., “New Galactic Star Clusters Discovered in the VVV Survey,” Astronomy & Astrophysics (A&A), Vol. 532, 2011, p. 131. doi:10.1051/0004-6361/201116662
- A. N. Chene, J. Borissova, J. R. A. Clarke, C. Bonatto, D. J. Majaess, C. Moni Bidin, S. E. Sale, F. Mauro, et al., “Massive Open Star Clusters Using the VVV Survey I. Presentation of the Data and Description of the Approach,” Astronomy & Astrophysics (A&A), Vol. 545, 2012, p. 54. doi:10.1051/0004-6361/201219064
- R. Indebetouw, J. S. Mathis, B. L. Babler, M. R. Meade, C. Watson, B. A. Whitney, M. J. Wolff and M. G. Wolfire, “The Wavelength Dependence of Interstellar Extinction from 1.25 to 8.0 m Using GLIMPSE Data,” The Astrophysical Journal, Vol. 619, No. 2, 2005, pp. 931-938. doi:10.1086/426679
- J. J. Stead and M. G. Hoare, “The Slope of the Near-Infrared Extinction Law,” MNRAS, Vol. 400, No. 2, 2009, pp. 731-742. doi:10.1111/j.1365-2966.2009.15530.x
Appendix A: Decontaminated Diagrams for Selected Clusters
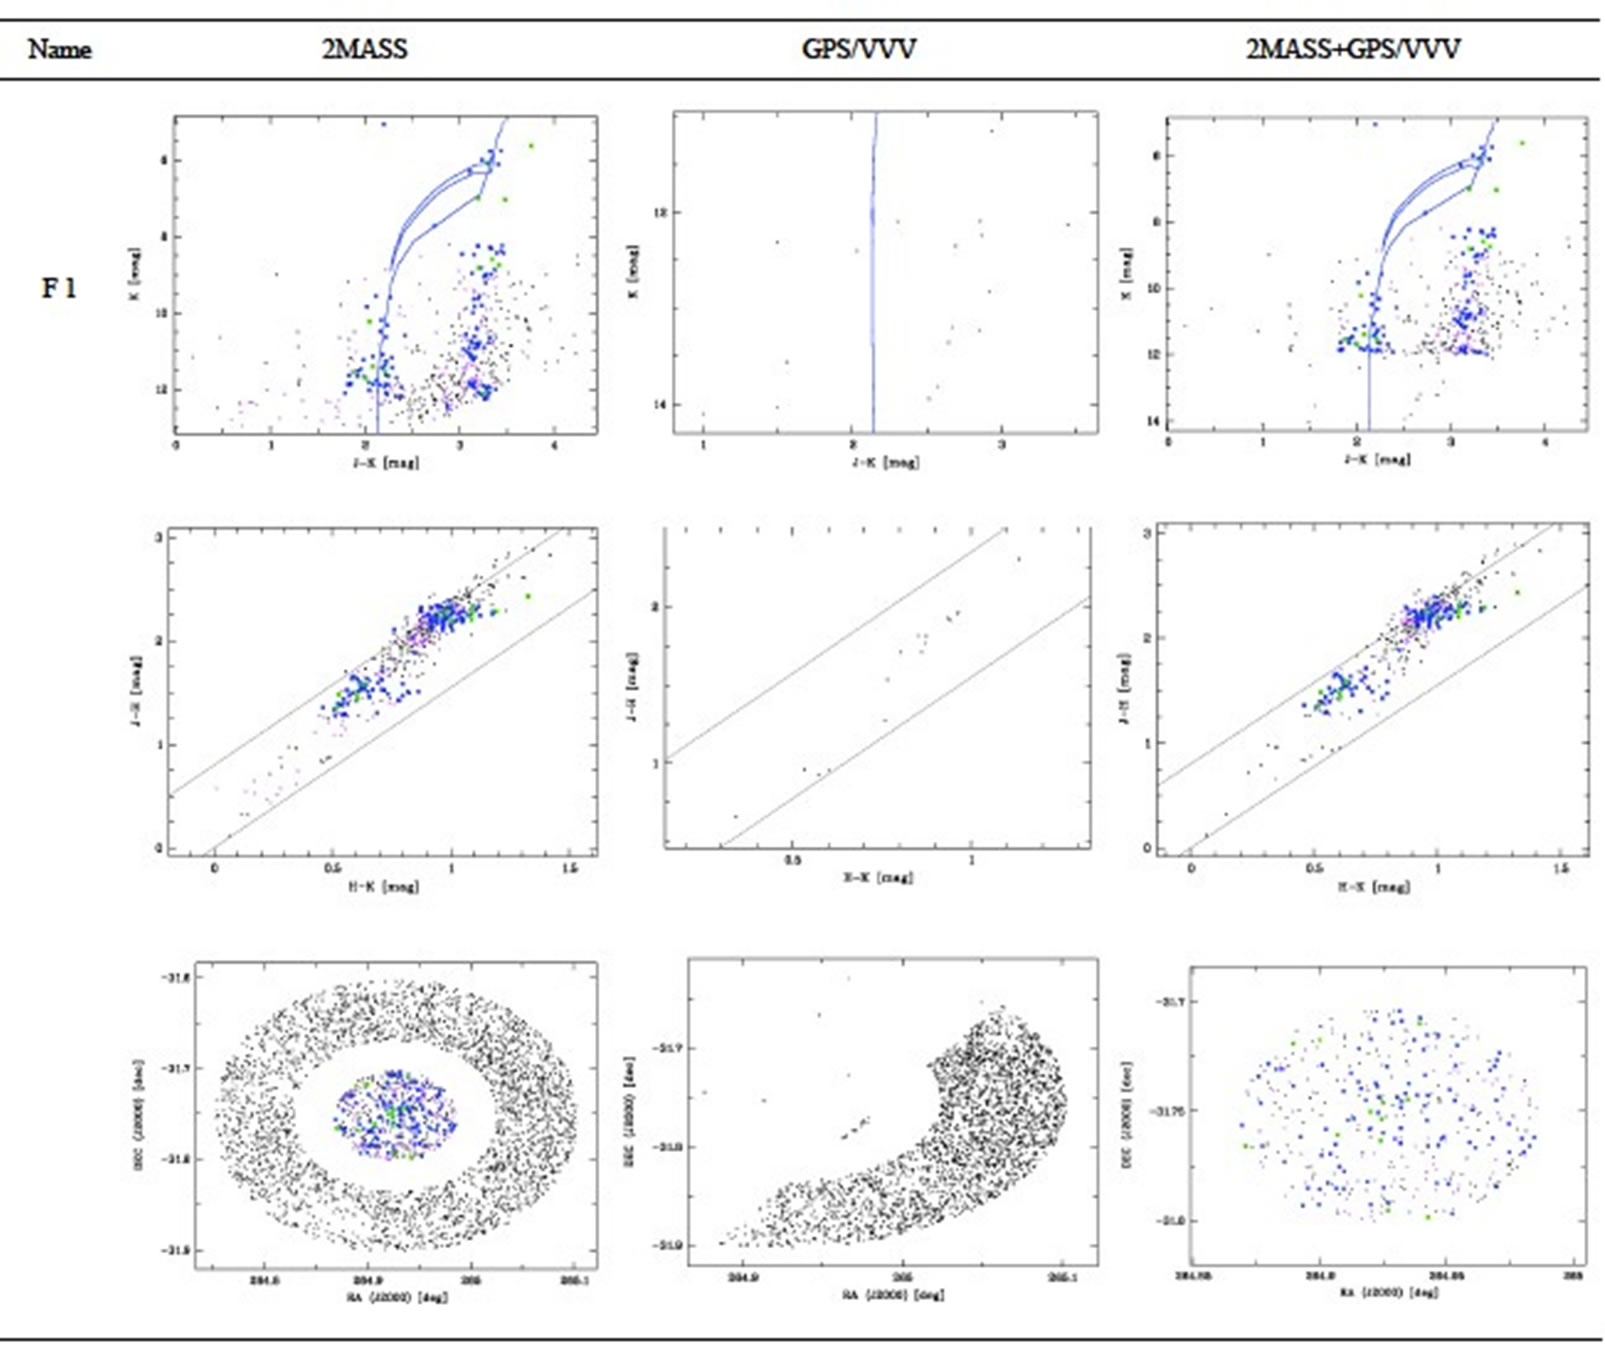
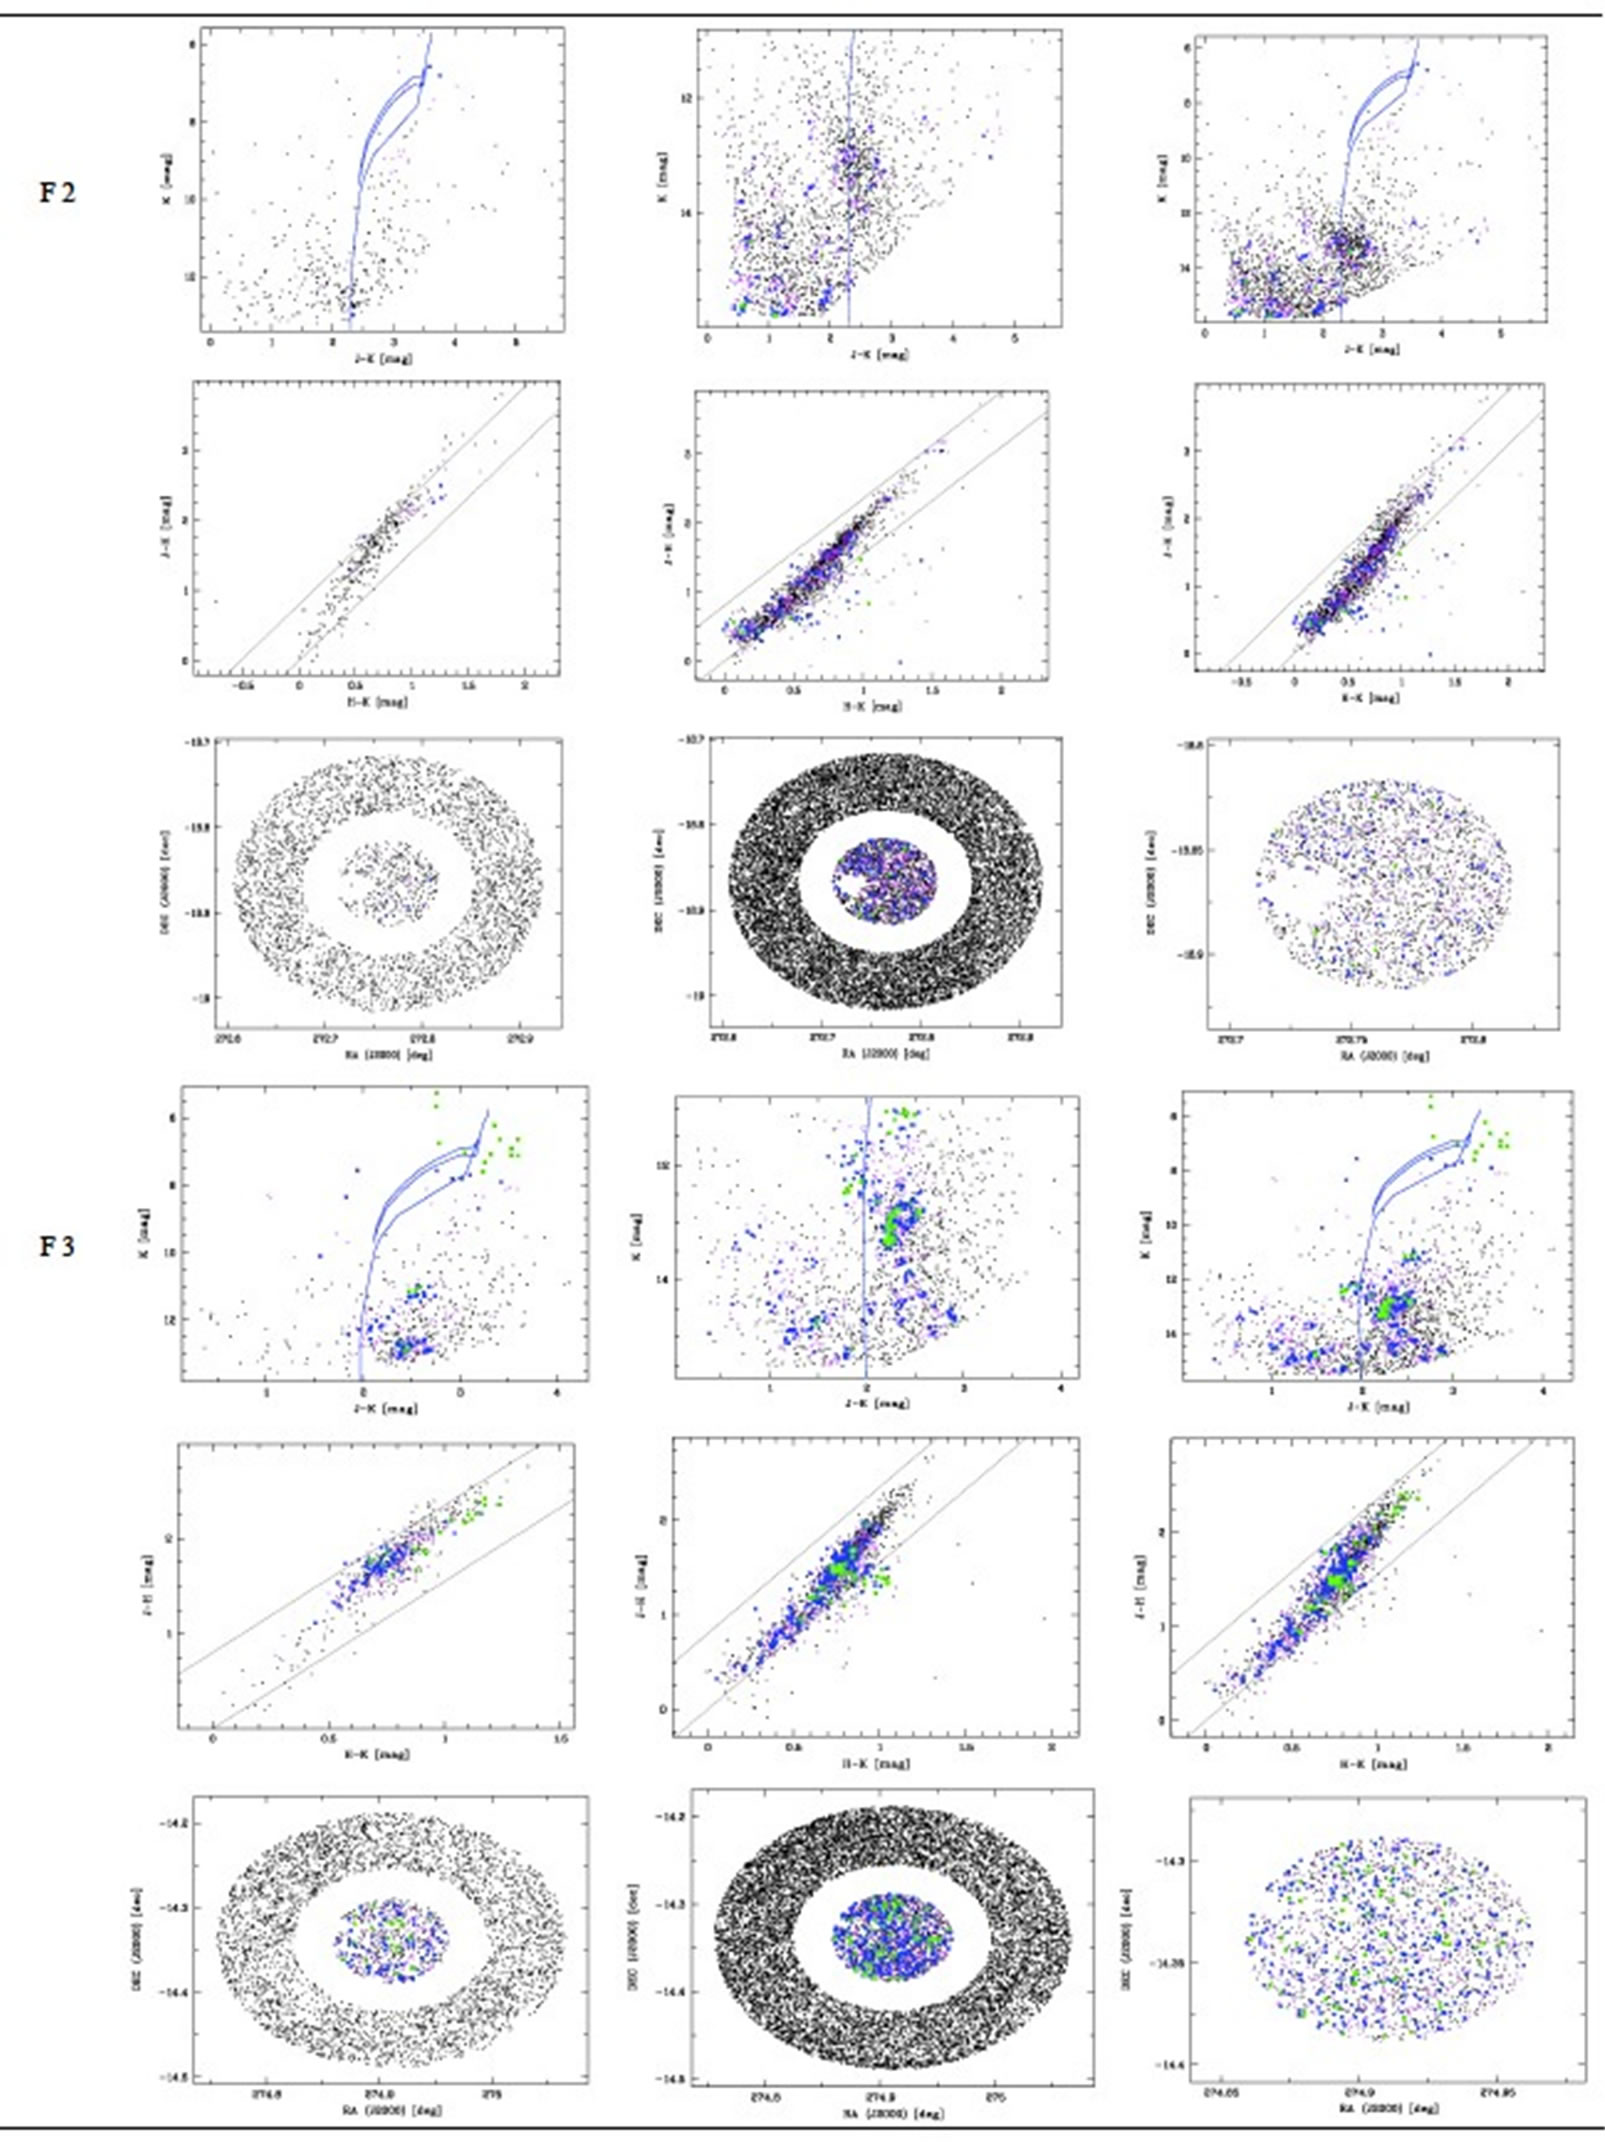
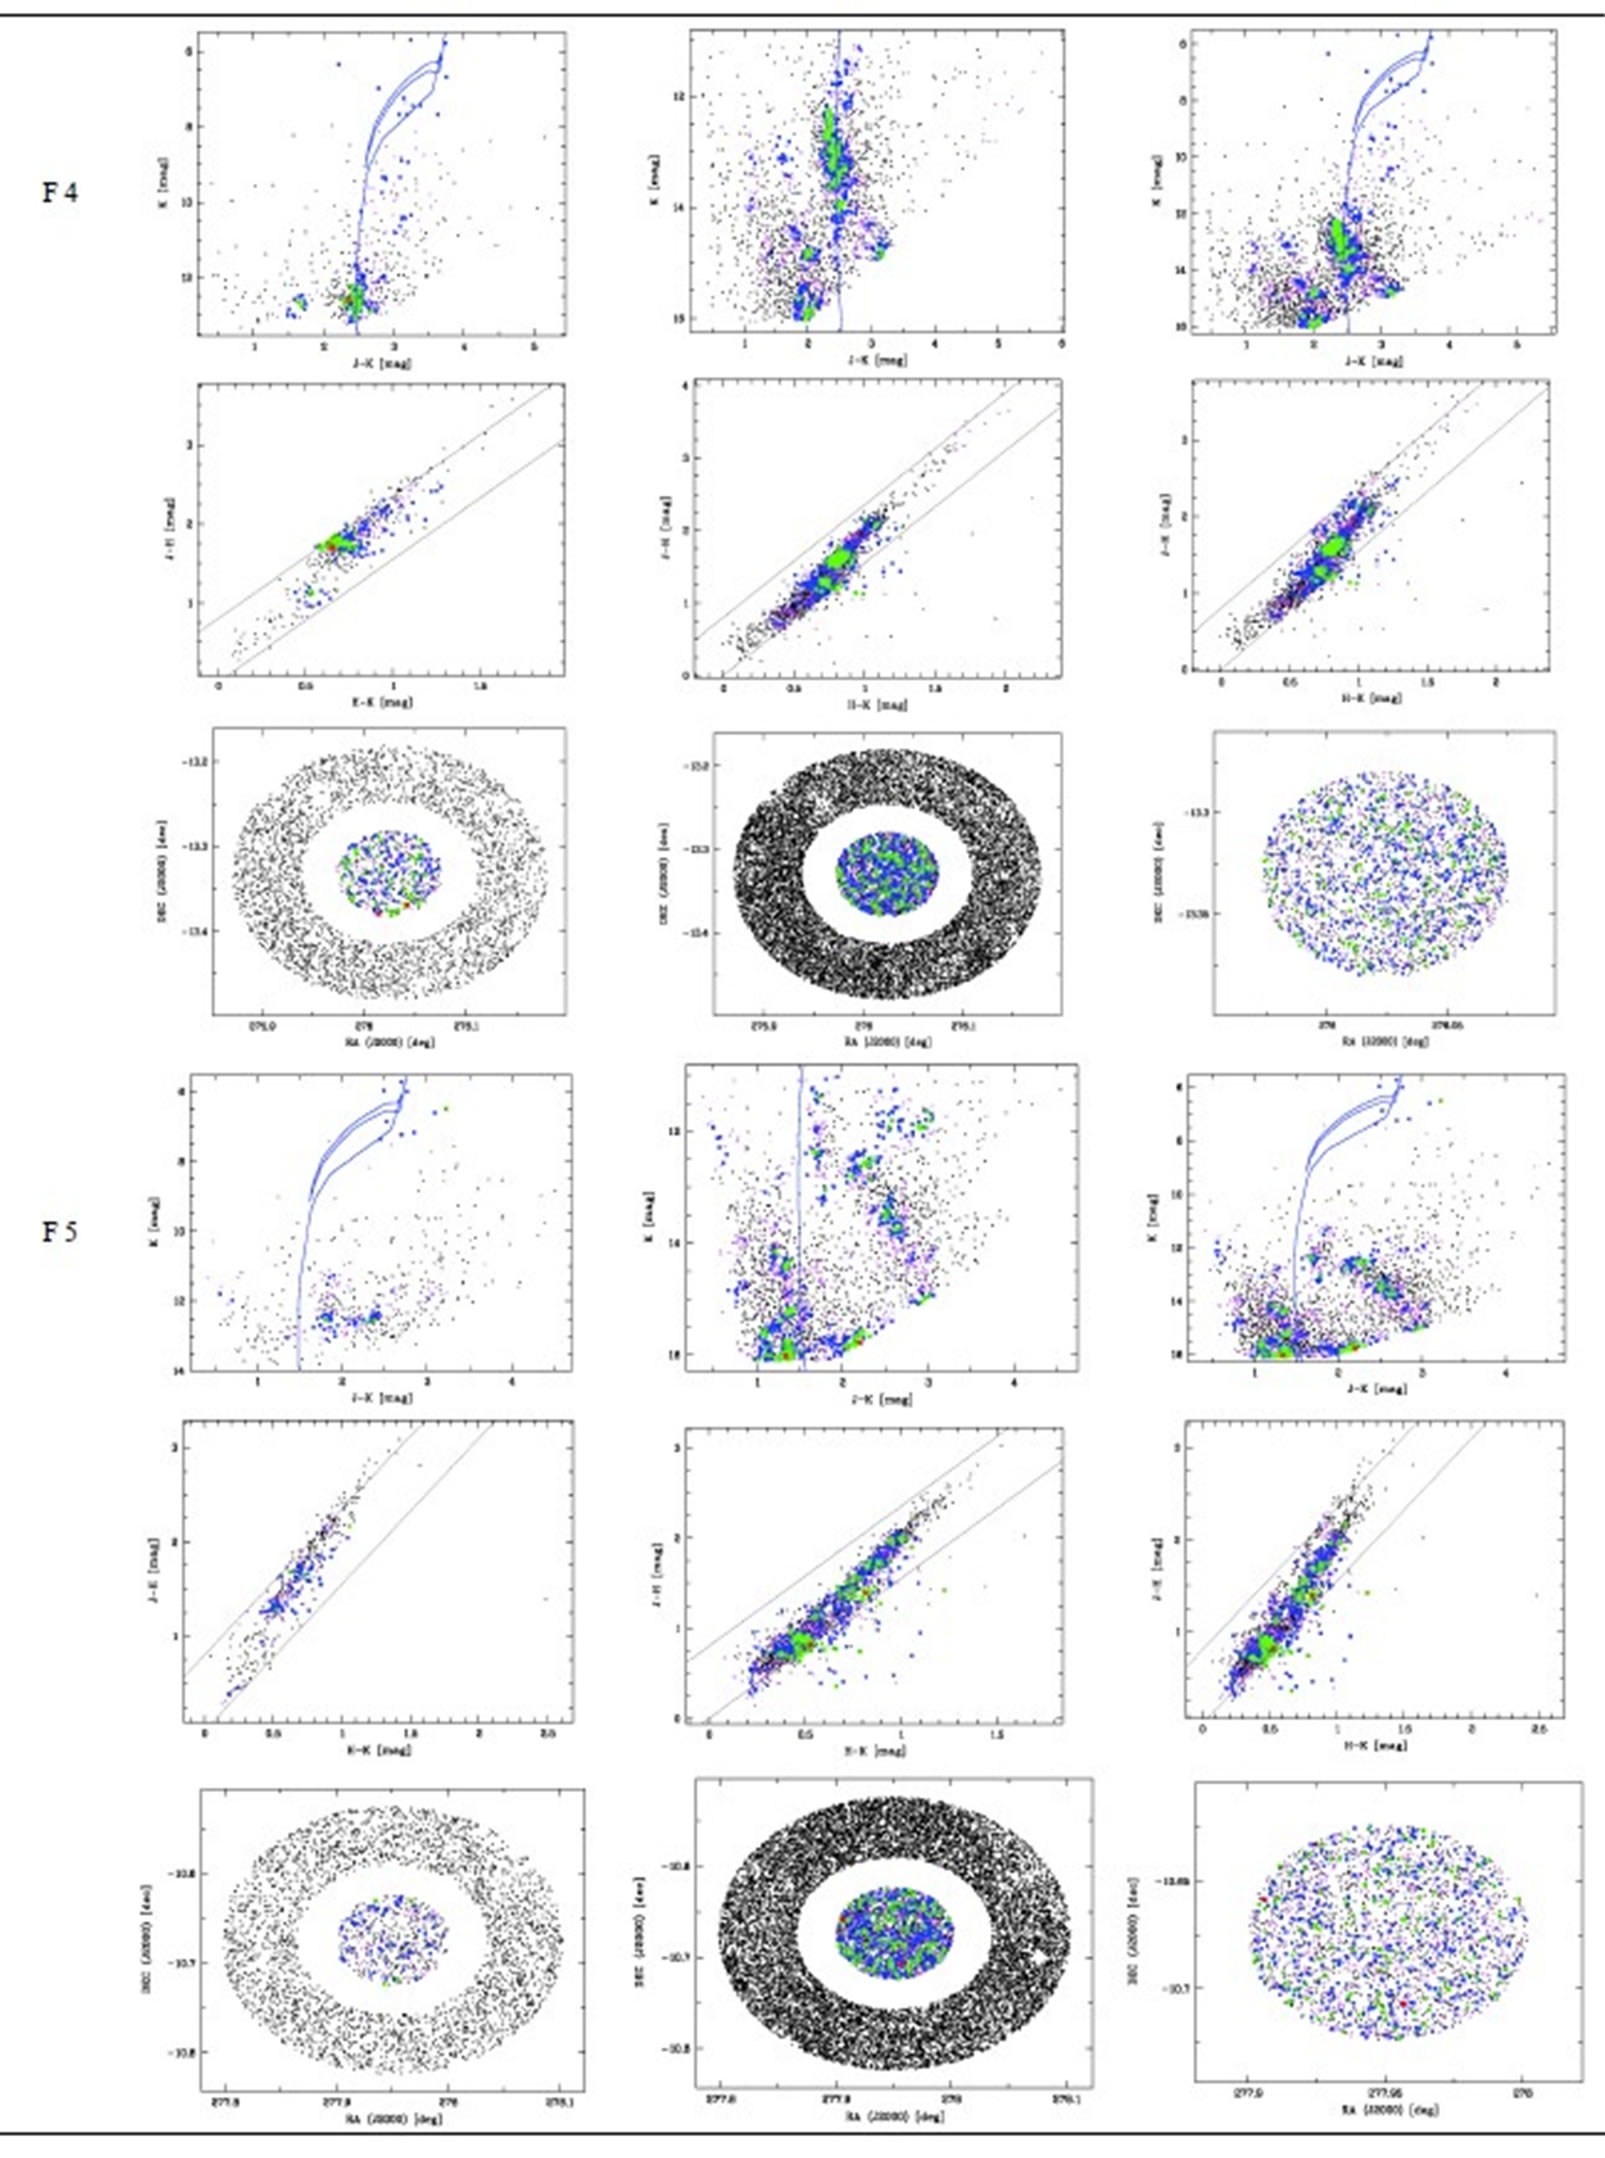
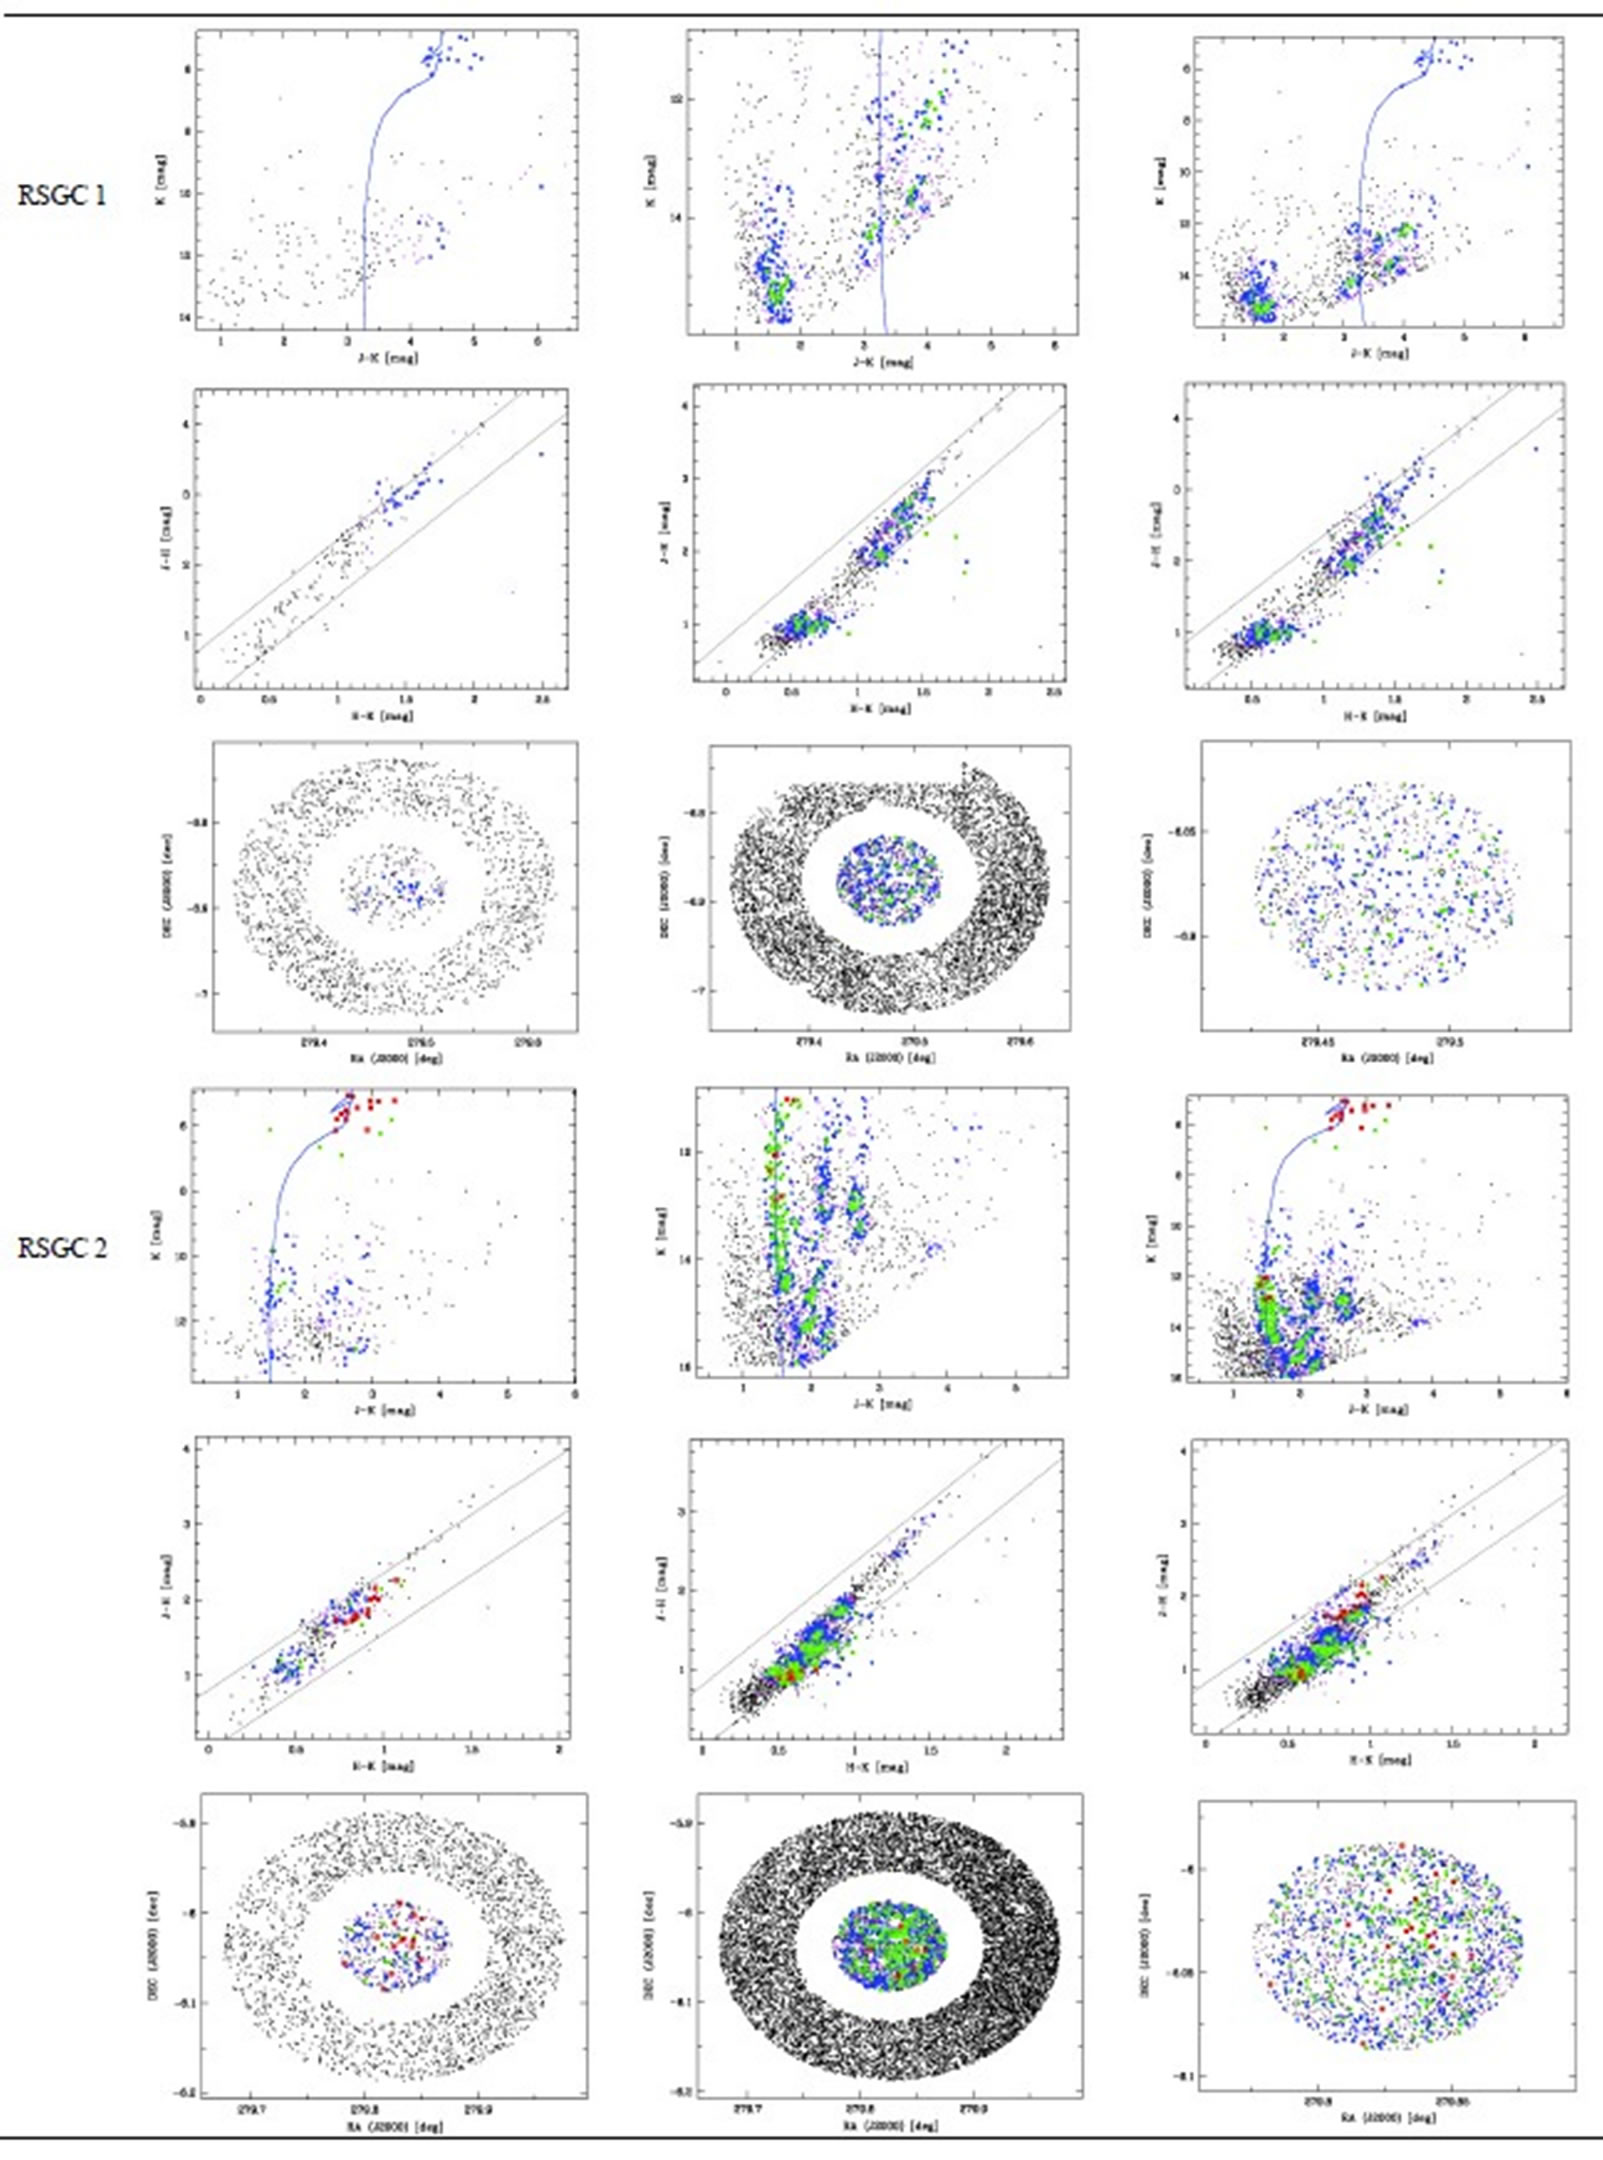
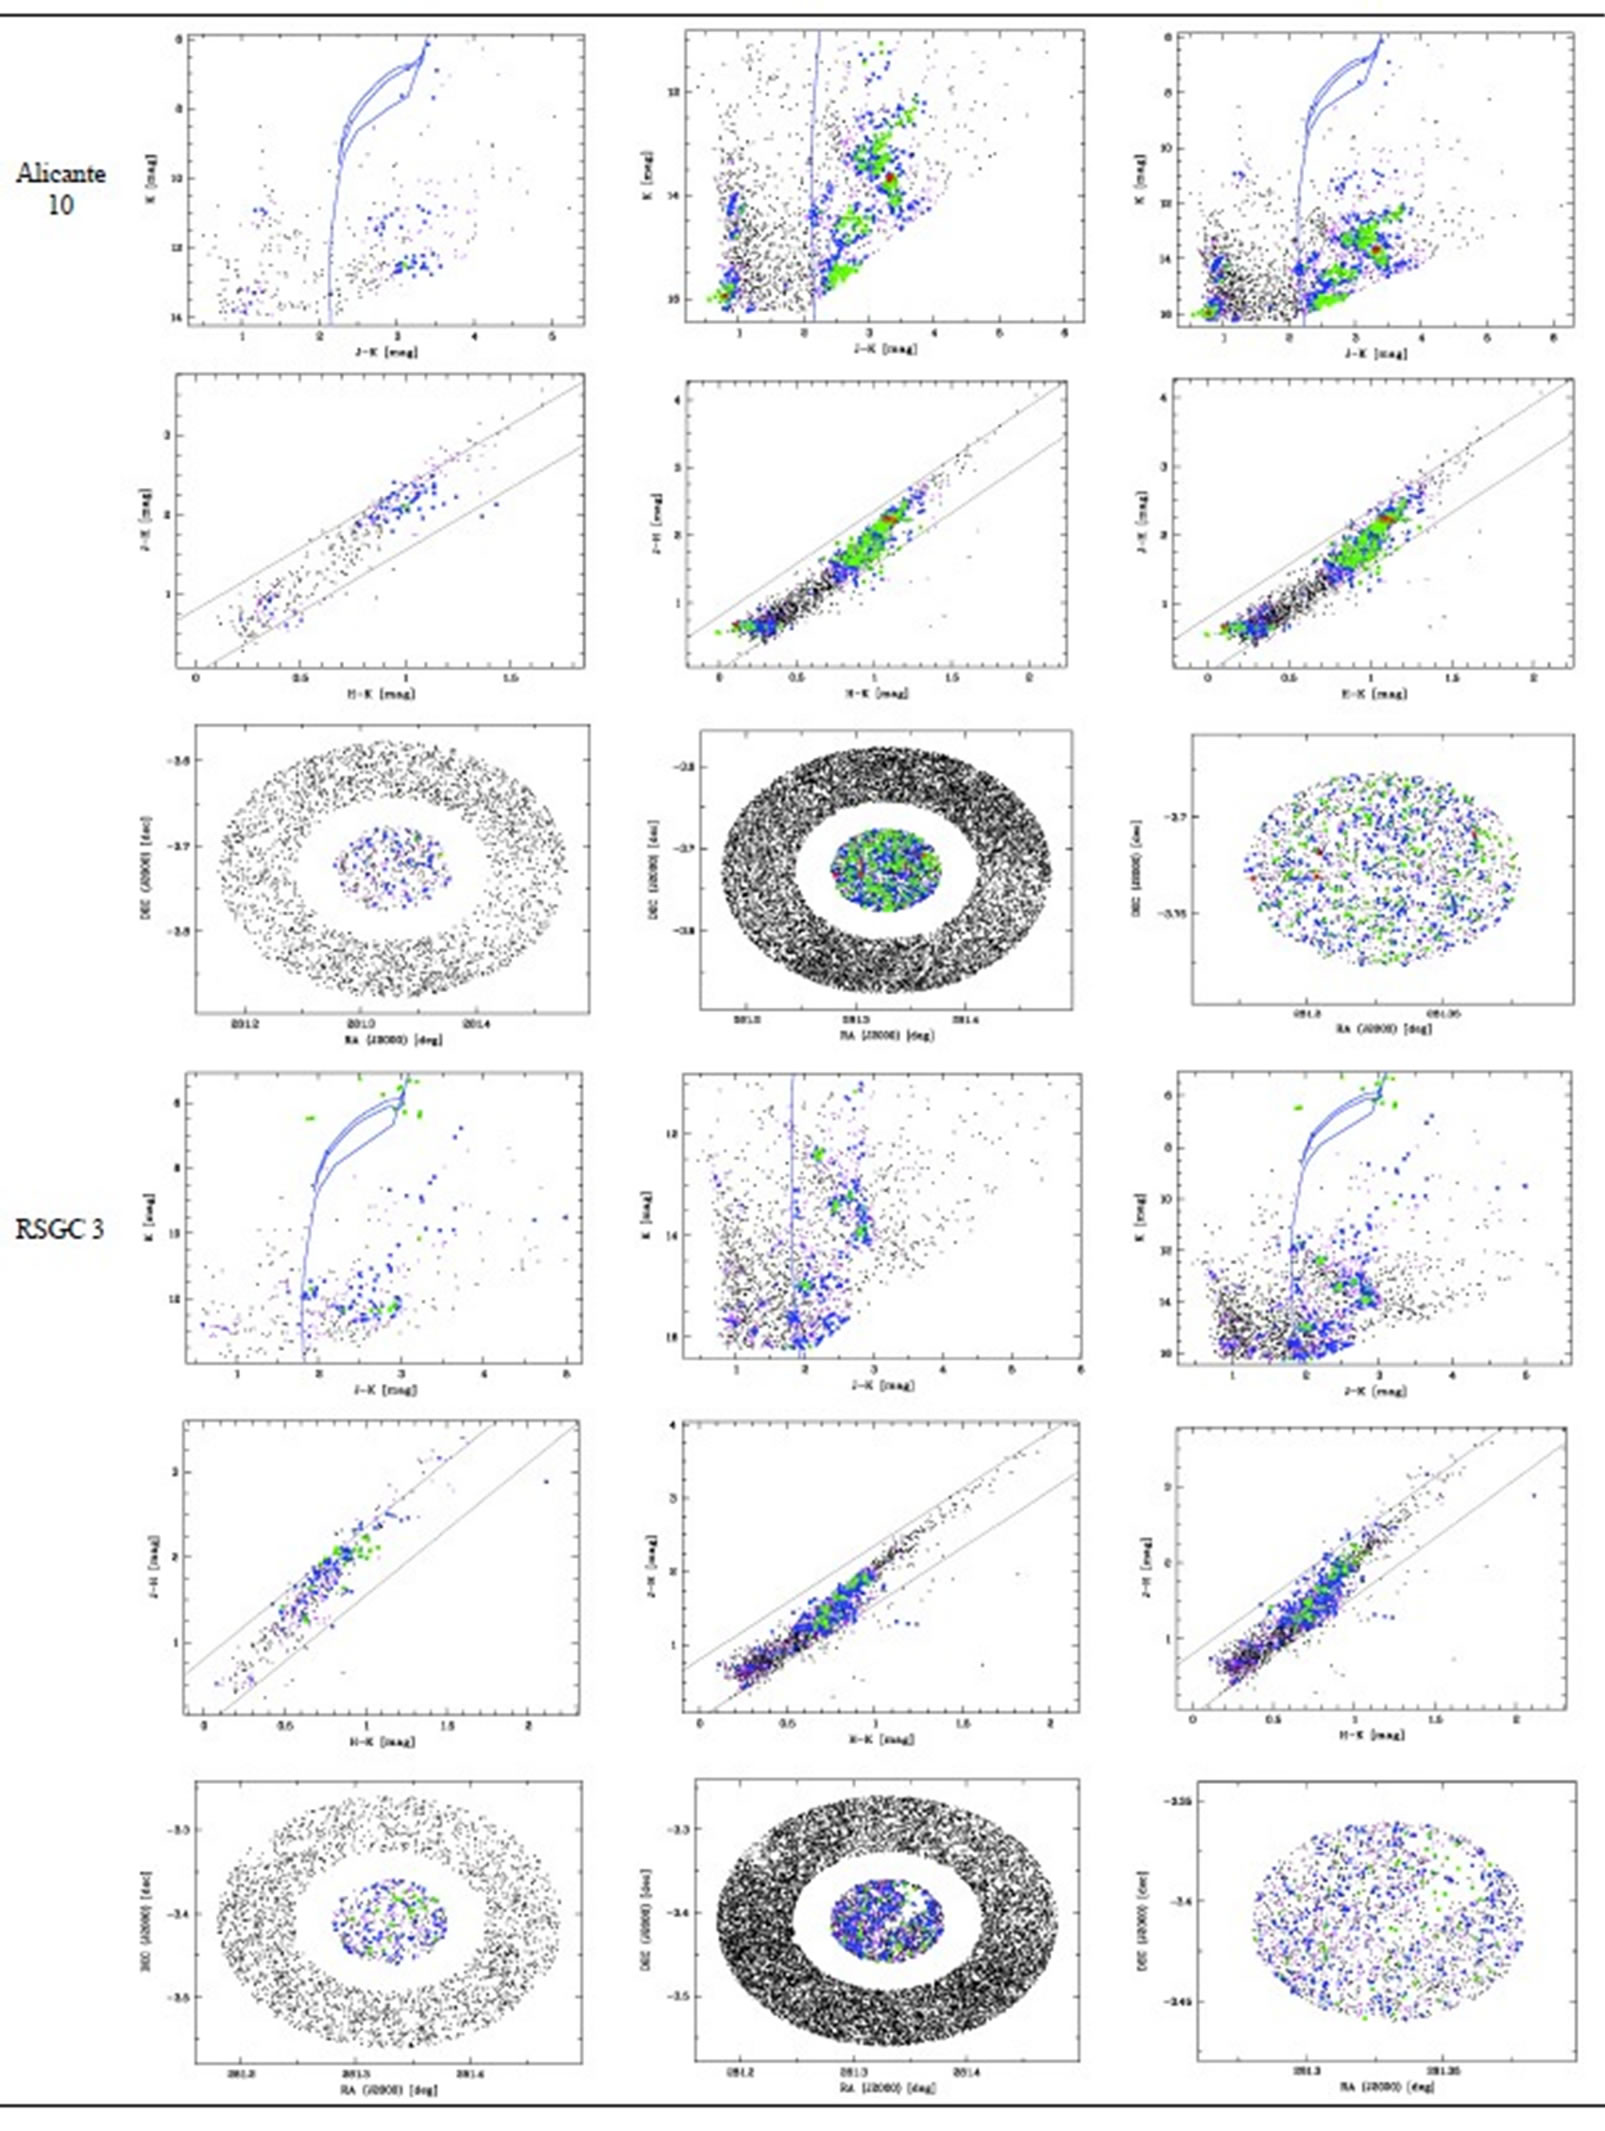

Table A1. Cluster diagrams: Summary of the RSGC candidates. In each graph the cluster membership probabilities are: Red P > 80%, Green 80% > P > 60%, Blue 60% > P > 40%, Magenta 40% > P > 20% and Black P < 20%. Larger symbols indicate higher membership probabilities. The left column shows 2MASS data, the middle column the UKIDSS/VVV data (depending on the cluster position) and the right column combines the two data sets. The top row contains the colour-magnitude diagrams. The isochrones are from the Geneva models. The second row shows the colour-colour diagrams with the reddening band based on [9]. The third row contains the position of all stars in the control field (outer ring) and the cluster area (inner circle). In the right hand column we only show the cluster area.
NOTES
1http://www.astro.iag.usp.br/~wilton/