Advances in Chemical Engineering and Science
Vol.4 No.1(2014), Article ID:42539,8 pages DOI:10.4236/aces.2014.41011
Rheological Characterization of a Mixed Fruit/Vegetable Puree Feedstock for Hydrogen Production by Dark Fermentation
1Bioprocess and Bioengineering Departments, UPIBI-Instituto Politecnico Nacional, Mexico City, Mexico
2Energy Department, Universidad Autónoma Metropolitana-Azcapotzalco, Mexico City, Mexico
Email: *LTorresBustillos@gmail.com
Received July 31, 2013; revised August 31, 2013; accepted September 7, 2013
ABSTRACT
Bio-hydrogen (Bio-H2) production from the organic fraction of solid waste, as fruit and vegetable wastes, constitutes an interesting and feasible technology to obtain clean energy. In spite of the feasibility to produce Bio-H2 from fruit/vegetable wastes (FVW), data about its rheological characterization are scarce. This information is useful to establish the hydrodynamic behavior, which controls the overall mixing process when the feedstock for Bio-H2 production process is a mixture of FVW. In this work, the rheological behavior of a vegetable/fruit waste mixture was characterized. The effect of the solids content (%, w/w), temperature, time (tyxotropy effects) and shear rate over the apparent viscosity of the mixture was evaluated. Most of the mixtures showed non-Newtonian behavior. The curves are typical rheofluidizing fluids. The rheological curves were different at increasing solids contents (80%, 60%, 40% and 30%), independent from the temperature. Rheological data were fitted to the power law model. Correlation factors R2 for the different mixtures were 0.991 - 0.995 for 80%, 0.961 - 0.986 for 60%, 0.890 - 0.925 for 40%. In the case of 30% of solids, the R2 value was not acceptable, and it was also found that this mixture was very near to the Newtonian behavior. Calculated activation energies (Ea) values were 15.98, 14.89 and 20.96 kJ/mol for the 80%, 60%, 40% mixtures, respectively. FVW purees rheological behavior was well characterized by Carbopol solutions at given concentrations and pH values. This fluid can be used as a model for other studies, e.g. LDA (Laser Doppler Anemometry) and PIV (Particle Image Velocimetry).
Keywords:Bio-Hydrogen; Mixing; Rheology; Rheofluidizing Materials; Fruit/Vegetable Waste Mixture
1. Introduction
1.1. Bio-Hydrogen Production from Vegetable and Fruit Wastes FVW
Recently, the research activity has been focused on the production of alternative energy sources from organic matter [1]. Additionally, FVW are produced in large quantities in markets in many large cities [2-5]. Mexico City with a population of more than 20 million produces a huge amount of solid waste greater than 12,000 tons per day, which has to be disposed. On the other hand, the enough food supply for this population is provided by many markets located at different regions of the city. The largest market is the Central de Abastos (CEDA), which commercializes 24,000 tons of food products and produces 895 tons of organic solid waste each day. The waste produced by CEDA is conveniently separated at the source, and is an ideal candidate for energy production using anaerobic processes [6]. Vegetable and fruit waste produced in markets is considered as a potential source to generate energy due to its higher organic composition and easily biodegradable nature. The application of an anaerobic digestion process for simultaneous waste treatment and renewable energy production from the organic fraction of these residues could therefore be of great interest [5].
Bio-hydrogen (Bio-H2) production from the organic fraction of solid waste, as fruit and vegetable wastes, constitutes an interesting and feasible technology to obtain clean energy. Vegetable-based waste contains a high amount of carbohydrate [7]. The feasibility of Bio-H2 production from the carbohydrate rich wastes, such as food processing wastewater [8], mixed fruit peel-waste [9] and cheese processing wastewater [10] by dark-fermentation process has been reported by some authors. Until now the dark fermentation process for Bio-H2 production has been utilizing different organic market waste or fruit vegetables wastes mixing such as tomato, potato, carrot, cabbage, brinjal, beet-root, okra and coccinia [7,11], lettuce, fennels, lemons, tomatoes, plums apples, strawberries pears and peaches [12] and fruit peel waste [9].
In spite of the feasibility to produce Bio-H2 from FVW [7,13], information about its rheological characterization is very scarce and there is still a need to study the hydrodynamic performance (micro/macromixing) inside a pilot or industrial CSTR that may cause fruit/vegetables waste mixing problems in the process.
Ruggeri and Tommasi [12] conclude that one of the most important parameters that affect Bio-H2 production is rheological behavior of the broth and mixing when organic refuse is utilized. They mentioned that the rheological behavior and mixing are ones of the most important problems that need to be solved. For instance, for a highly shear-thinning fluid, the apparent viscosity near the impeller is low, and near the wall, it is very high. Thus, the mixing process can be efficient near the impeller and low near the wall, i.e. the overall mixing process of CSTR’s can be drastically affected. Additionally, theoretical and experimental investigations on micro/ macro-mixing aspects are still necessary to scale-up and design a full-scale plan. Therefore, the understanding of the hydrodynamic system is important because this is a critical design parameter in the assessment of the fullscale practical application of fermentation Bio-H2.
1.2. Rheological Characterization of Vegetable and Fruits Purees
Some works have reported the rheological characterization of mango and papaya nectar blends [14], blueberry [15,16], zapote [17], raspberry, strawberry, prune and peach [18]. On the other hand, some vegetables or milled seeds have been characterized, such as tomato [19], ginger and chili [20,21], and milled maize and soy in water [22].
As far as we know, there are no previous reports on the characterization of fruit-vegetable waste mixture including pineapple, banana, orange, papaya, tomato and lettuce. This mixture was used as a model substrate for anaerobic digestion process because they are the most sold products commercialized in the CEDA and they are not seasonal products. Some rheological models have been employed for the rheological characterization of fruits/vegetables purees including the Ostwald de Wale power model (various works, including Nindo et al., [16]), the Bingham plastic model, the IPC Paste analysis model, Casson model [14], Herschel-Bulkley model and the Mazhari Berk model [15]. In other works, more complex models, such as the Carrau model, have been reported [19].
In this work, data were fitted only to the power law model [14]:
 (1)
(1)
where:
η is the fluid viscosity in Pa·s;
K is the consistency index, in Pa·sn−1;
n is the flow index (undimensional).
Regarding the effect of the temperature over the apparent viscosity of fruit/vegetable puree, the most used equation is the Arrhenius type model and the linear model [17].
The Arrhenius type equation is given by [14]:
 (2)
(2)
where:
η is the apparent viscosity at a fixed shear rate, in Pa·s;
 is the viscosity at infinite temperature, in Pa·s;
Ea is the Activation energy in kcal/mol;
R is the universal gas constant (8.314 kJ/kmol·K);
T is the temperature, in K.
In a CFD report, a combined model which uses the power law model and a function with the temperature effect was reported [23,24]:
 (3)
(3)
where  (4)
(4)
1.3. Simulation of Viscous Fluids Using Cellulose-Derivatives
Cellulose-derivatives such as Carbopol have been employed for the simulation of fermentation broths since they are quite soluble, transparent and offer a variety of rheological behavior which depends on either the agent concentration or the pH value. In addition, the use of Carbopol solutions or other yield-stress transparent fluids such as Carboxy Vinyl Polymers (CPV) as model fluids is particularly useful for several visualization techniques in performing mixing experiments, e.g. LDA (Laser Doppler Anemometry), PIV (Particle Image Velocimetry), visualization with dye and flow observation with tracers [25-27]. Galindo and Nienow [28] employed Carbopol solutions to simulate highly-viscous fermentation broths for production of xanthan gum. They studied the mixing of highly viscous (and shear thinning) simulated xanthan fermentation broths with the Lightning A- 315 impeller.
On the other hand, Kelly and Gigas [29] also employed Carbopol solutions (0.1% w/v) to mimic shearrate thinning fluids, for a CFD study with near-axial-flow impellers operating in the transitional regime. Finally, Curran et al. [30] have employed Carbopol solutions as models for yield-stress fluids. They have emphasized that these solutions at a given concentration show different K and n values, depending on the pH value (i.e. from 2.79 to 11.36).
The aim of this work was to characterize the rheological behavior of mixed vegetables/fruits waste mixture which will be used as feedstock for the production of bio-hydrogen by dark fermentation in a 22 L CSTR. The effect of the solids content (%, w/w), the temperature, time (tyxotropyc effects) and the shear rate over the apparent viscosity of the mixture was evaluated using a low-cost viscometer. Finally, the fluid rheology was simulated using Carbopol (a cellulose derivative) solutions, which are clear-translucent viscous fluids, with a rheology behavior dependent from pH values. That fluid will be employed in the real bioreactor in order to carry out mixing experiments (power consumption, PIV, mixing times with dye observation, etc.).
2. Materials and Methods
2.1. Puree Elaboration and Characterization
The fruits/vegetables puree was prepared using fruits and vegetables purchased in a local market. All products were mature. Fruits were not pealed and both the skin and the pulp were employed in the puree manufacture. All ingredients were milled separately in a domestic blender during 5 - 10 min adding certain amount of water. At the end, the milled fruits and vegetables were put together, and passed through an stainless steel American mesh 10 (diameter of 2 mm). The process was carried out at environmental conditions. The puree was stored at 4˚C, until its dilution at 80%, 60%, 40%, 30% and 20% (w/v) using water again. Volatile fatty acids (VFA) such as lactic acid, acetic acid and ethanol were analyzed by high performance liquid chromatography (HPLC) (Varian ProStar, Model 350), with Rezex ROA organic acid column (Phenomenex®, Torrance, California, USA), equipped with a UV/Vis, RI detector. Solution sulfuric acid (0.005 N) was used as the mobile phase, and separation were carried out at 65˚C at a flow rate of 0.6 mL/min and pressure at 39 bar. Previously, the samples were centrifuged at 10,000 rpm (Eppendorf®, Mini Spin) for 10 min, after which the supernatant was filtered (Whatman®, 0.45 μm) to analysis. Total sugars (glucose and fructose) were analyzed by the di-nitro salicylic acid (DNS) method, while soluble protein was determined by the Bradford method with bovine serum albumin as standard. COD was measured using Hach Standard Method (KitHach, 20 a 1500 ppm). The pH, total solids (TS), and volatile suspended solids (VSS), were measured according to standard methods (APHA, 2005). Liquid samples for metal analysis were filtered (Millipore, Sigma-Aldrich, 0.45 μm) and metals analyzed were iron and nickel with an atomic absorption spectroscopy (Perkin Elmer, USA). Carbon, nitrogen, oxygen, phosphorus, sulfur and metals as sodium, magnesium, potassium and calcium were undertaken using Energy-dispersive X-ray spectroscopy technique by elemental analysis (Ray-X Bruker D8 Advance).
2.2. Rheological Characterization
Rheological characterization was carried out in a lowcost viscometer (Brookfield Model DV-II + Pro, USA) in the range of 0.667 - 3.33 s−1. For that, different spindles were employed. Measurements were run always by duplicate, once upwards and once downwards, in order to check any tyxotropyc effect. After that, the average viscosity was recorded for every puree concentration, shear rate and temperature.
Measurements were carried out at 20˚C, 30˚C and 40˚C, since the hydrogen fermentation has been developed around 35˚C. For that, a hot water bath was employed, and the puree sample was equilibrated at the desired temperature before the beginning of the specific measurement.
2.3. Rheological Behavior of the Carbopol Solutions
Carbopol solutions of different concentrations adjusted to various pH values were prepared and characterized as previously explained at 20˚C only. Samples were kept at 4˚C previous to use.
3. Results
3.1. Purees Characterization
Organic matter, total solids, volatile solids and pH were evaluated for the fruits and vegetables apart, and for the mixture. Results, previously reported by Garcia-Peña et al. [6] are shown at Table1 The specific values of some puree characteristics are shown at Table2
Figures 1-3 show the viscosity vs. shear rate plots for the purees containing 80%, 60% and 40% of solids from the original FVW mixture at different temperatures. First, it is clear that all mixtures show non-Newtonian beha

Table 1. Composition of the fruits and vegetables purees and the mixed fruit/vegetables puree.
*Adapted from Garcia-Peña et al. 2011.
Table 2. Characterization physical and chemical of fruits vegetables waste mixture.
ND-undetectable, under detection limit.
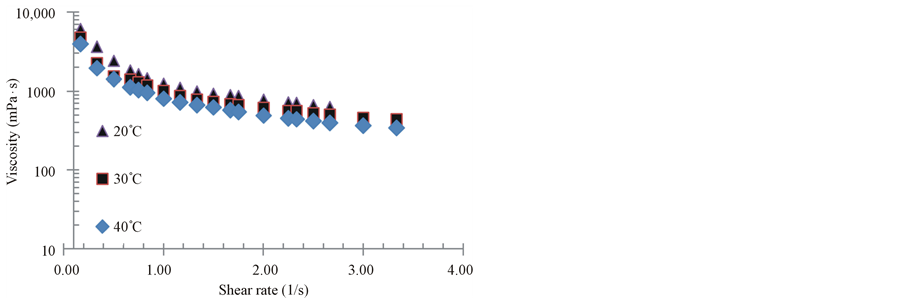
Figure 1. Viscosity vs. shear rate for the 80% solids puree.
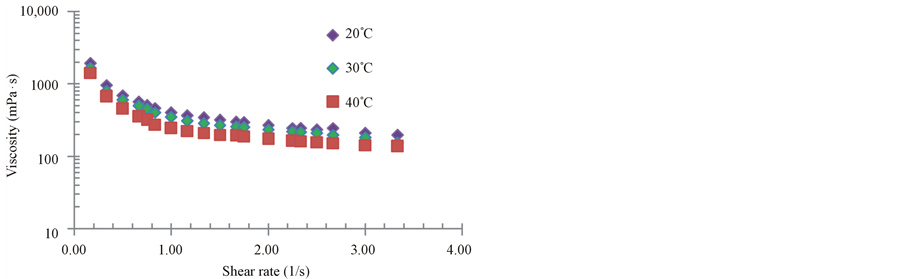
Figure 2. Viscosity vs. shear rate for the 60% solids puree.
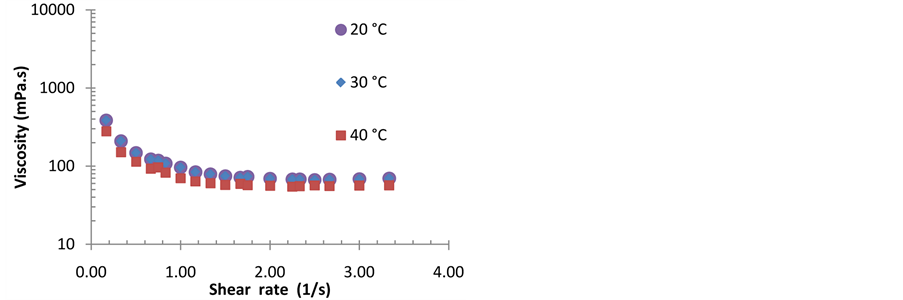
Figure 3. Viscosity vs. shear rate for the 40% solids puree.
vior. The curves are typical of rheofluidizing fluids, as previously reported. As observed, the rheological curves are very different with regard to the solids contents, independent from the temperature. Curves are similar to those reported by Maceiras et al. [18] for raspberry, peach, prune and strawberry purees. It is important to remark that in this work, the shear rate range was 0.667 - 3.33 s−1, while in that work, the range was wider (17.8 - 445 s−1). The effect of temperature seems to be more pronounced for 80% and 60% solids samples.
Rheograms are also similar those reported by Nindo et al. [16] for blueberry puree. Again, in that work a wider range of shear rates were applied (10 - 1000 s−1). Temperatures on that study where of 40˚C, 50˚C and 60˚C. Nevertheless the shape of the curves is very similar to results showed in Figures 1-3.
Rheological data were fitted to the power law model, (see Figure 4 for the 80% puree). Correlation factors R2 for the different mixtures were as follows. 0.991 - 0.995 for 80%, 0.961 - 0.986 for 60% and, 0.890 - 0.925, for 40%. In the case of the 30% puree, R2 values were not acceptable (i.e., 0.41 - 0.65) and was observed that this flow is very near to the Newtonian behavior.
Tables 3 and 4 show the specific K and n values for the different mixtures at the three temperature values. Values for 30% puree were not calculated, since the low R2 value obtained in the correlation.
As previously stated, the most used equation in order to model raw rheological data is the Ostwald de wale or power law model. Very few works have employed more than one rheological model, as in the case of El-Mansy [14] for papaya, mango and mango/papaya blends.
Most of the rheological curves were fitted reasonably using the power law or the IPC paste model, as shown by the correlation values obtained. Bingham and Casson models are applied when it is necessary to evaluate yield stress values (τo, τoA). Table 5 summarizes the K and n values for the 80%, 60%, 40% and 30% mixtures, to-
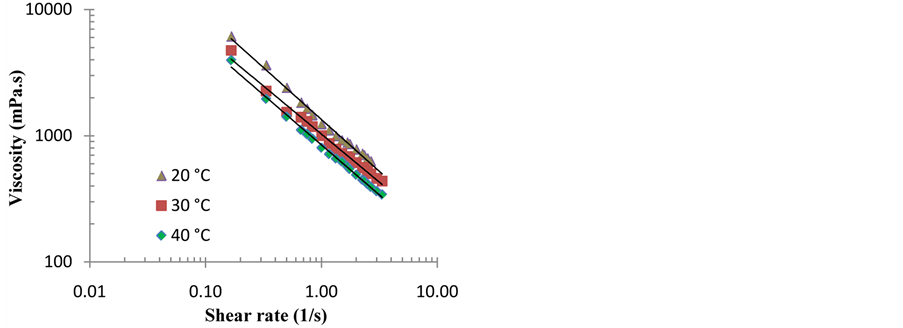
Figure 4. Viscosity vs. shear rate for the 30% solids puree. Solid lines represent the power law model.
Table 3. Consistency index (mPa·s) values for the fruits/vegetable puree at different concentrations.
NC not calculated because the R2 values were low.
Table 4. Index flow (undimensional) values for the fruits/vegetables puree at different concentrations.
NC not calculated, since the R2 values were low.
gether with results for other fruit or vegetable purees, reported in the literature. In the case where evaluations were carried out at different temperatures, the range of temperatures employed is also reported.
3.2. Effect of Temperature over Viscosity
Regarding the calculation of Ea, the activation energy, two different procedures have been reported for nonNewtonian fluids. The first one consist in correlate the K values with 1/T, and calculating the Ea values in mJ/mol. Andrade-Pizarro et al. [31] calculated Ea through the use of lnK and lnn. On the other hand, Ea can be calculated by fixing a shear rate in s−1, so an apparent viscosity can be calculated. El-Mansy et al. [14] fixed the calculations at 10 rpm, arbitrarily.
For this work, it was decided to fix the shear rate at one value which could be found during the bio-hydrogen production in the 22 L tank. Fermentations have been carried out at 150 rpm, employing a pair of Rushton turbines. In order to calculate the shear rate, the Metzner and Otto correlation [32] was employed:
 (5)
(5)
where:
 is the average shear rate near the impeller in s−1;
Ks is a dimensionless physical constant (11.4 for Rushton turbines);
N is the agitation speed in s−1.
By this procedure, Ea values were calculated for the 80%, 60% and 40% mixtures. Values of 15.98, 14.89 and 20.96 kJ/mol were found. They are showed on Table 5, with comparison purposes. The Ea value for the 20% - 30% mixtures were not calculated, since apparent viscosity was not well correlated by power law.
Figures 5 and 6 show the values of K and n, for every temperature (20˚C - 40˚C) and for every mixture concentration (30% - 80%). Regarding the consistency index, the value of temperature affects K values specially for. On the other hand, at low concentrated mixture (40%) the 60% and 80% mixtures, and the relationship is linear and inverse: the higher the temperature, the lower the K value K seems to be independent on T. It is yet possible
Table 5 . Rheological characteristic of some fruits, vegetables and mixtures, K and n from Ostwald de Wale’s power-law model, except when indicated.
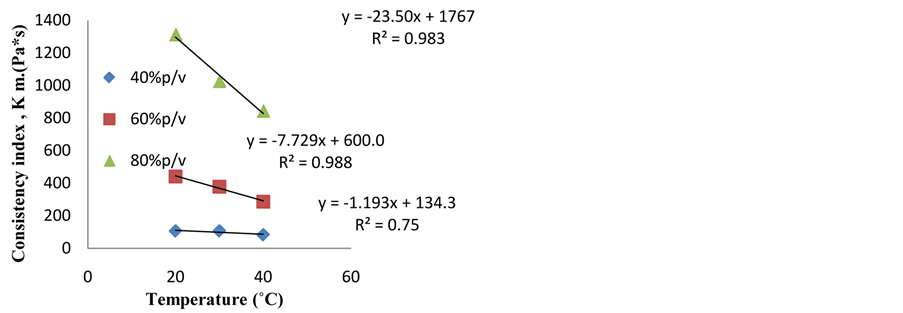
Figure 5. Consistency index values for different puree concentrations and temperatures.
to establish very simple equations to predict K as a function of T with fairly good R2 values.
Regarding the flow index, (Figure 6) it is evident that n values are affected by temperature for the 40% and 80% mixture. In the case of the mixture of 60%, seems that n value is independent on T. Again, it is possible to write very simple equations to predict n values as a function of T.
3.3. Effect of Time over Viscosity (Tyxothropy)
Raw data for 80%, 60%, 40% 30%, and 20% mixtures
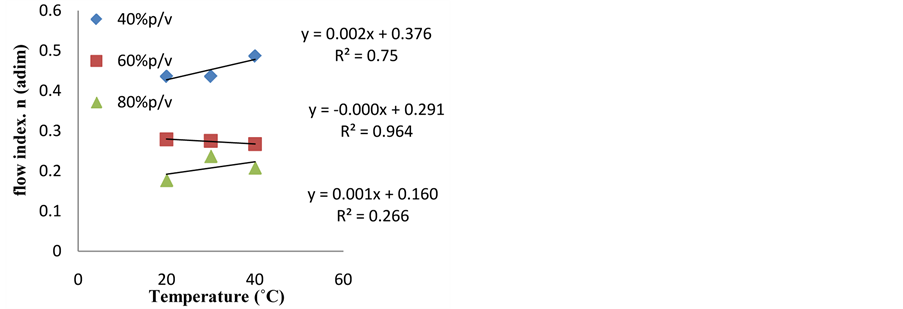
Figure 6. Effect of time over viscosity. 80% solids puree.
were obtained by duplicate. Viscosities calculated with the shear rate/shear stress values were quite similar for all the mixture concentrations. No apparent effect of time, i.e. thyrotrophic effects was noticed. As example show Figure 7, where upwards and downwards values of viscosities were calculated for the 80% mixture.
3.4. Simulation of the Puree’s Rheological Behavior
The model employed to simulate the rheological behavior of purees was Carbopol (hydroxymethyl-cellulose), which rheological characteristics are dependent on both concentration and pH.
Figure 8 show the comparison of the rheograms for 80%, 60%, 40% and 30% mixture at 20˚C, and the solid lines represent the Carbopol lines. As observed, Carbopol solutions have the capability of simulating fairly well the rheological behavior of the purees, in terms of the level of viscosity (K) and the pseudoplasticity of the fluids (n).
4. Conclusions
All mixtures show non-Newtonian behavior. The curves are typical rheofluidizing fluids, as previously reported. As observed, the rheological curves are very different with regard to the solids contents, independent from the temperature. Rheological data were fitted to the power law model. Correlation factors R2 for the different mixtures were as follows: 0.991 - 0.995 for 80%, 0.961 - 0.986 for 60%, and 0.890 - 0.925, for 40%. In the case of the 30% puree, R2 values were not acceptable. This flow is very near to the Newtonian behavior.
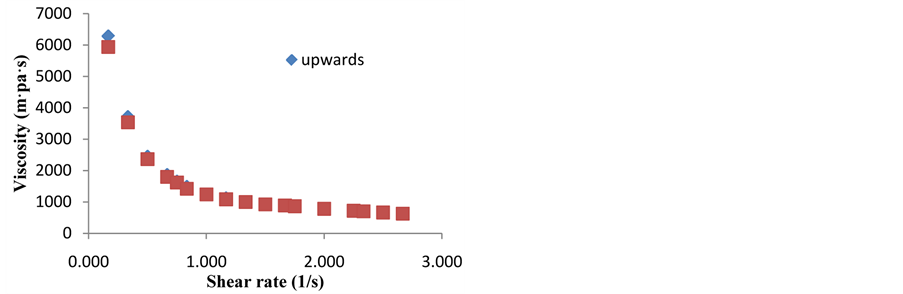
Figure 7. Comparison of 80%, 60% and 40% solids purees and Carbopol.
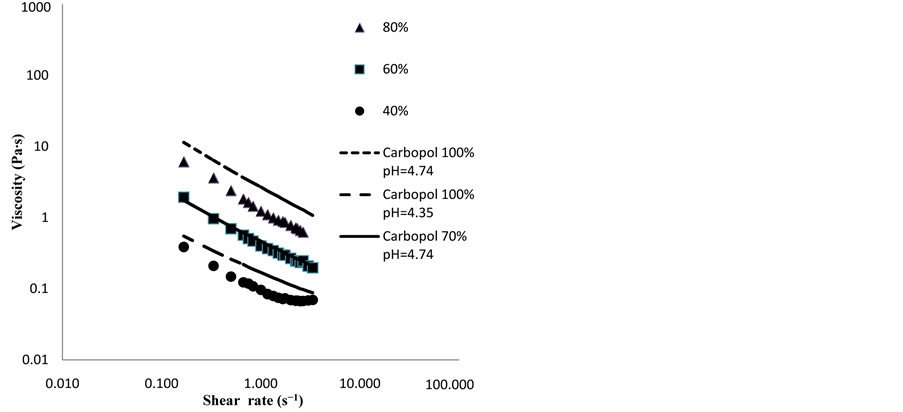
Figure 8. Viscosity versus shear rate for the 40% - 60% and 80% solids puree in comparison with the Carbopol solutions.
Ea values were calculated for the 80%, 60% and 40% mixtures. Values of 15.98, 14.89 and 20.96 kJ/mol were found. Finally, rheological behavior of FVW purees was well characterized by Carbopol solutions at given concentrations and pH values, as shown in Figure 6. Those measurements were carried out at 20˚C.
Acknowledgements
Authors thank to PROMEP (Project Analisis integral de tratamiento de aguas residuales a traves de procesos biologicos), which supported this work. The participation of Marcos Martinez (UPIBI) in some rheological measurements is acknowledged and thanked.
REFERENCES
- B. E. Logan, S. E. Oh, I. Kim and S. Van Ginkel, “Biological Hydrogen Production Measured in Batch Anaerobic Respirometers,” Environmental Science & Technology, Vol. 36, No. 11, 2002, pp. 2530-2535. http://dx.doi.org/10.1021/es015783i
- J. Mata-Alvarez, F. Cecchi, P. Llabrés and P. Pavan, “Anaerobic Digestion of the Barcelona Central Food Market Organic Wastes: Plant Design and Feasibility Study,” Bioresource Technology, Vol. 42, No. 1, 1992, pp. 33-42. http://dx.doi.org/10.1016/0960-8524(92)90085-C
- S. N. Misi and C. F. Forster, “Semi-Continuous Anaerobic Co-Digestion of Agro-Waste,” Environmental Technology, Vol. 23, No. 1, 2002, pp. 445-451.
- H. Bouallagui, R. BenCheikh, L. Marouani and M. Hamdi, “Mesophilic Biogas Production from Fruit and Vegetable Waste in Tubular Digester,” Bioresource Technology, Vol. 86, No. 1, 2003, pp. 85-90. http://dx.doi.org/10.1016/S0960-8524(02)00097-4
- H. Bouallagui, Y. Touhami, R. BenCheikh and M. Hamdia, “Bioreactor Performance in Anaerobic Digestion of Fruit and Vegetable Wastes: Review,” Process Biochemistry, Vol. 40, No. 3-4, 2005, pp. 989-995. http://dx.doi.org/10.1016/j.procbio.2004.03.007
- E. I. Garcia-Peña, P. Parameswaran, D. W. Wang, M. Canul-Chan and R. Krajmalnik-Brown, “Anaerobic Digestion and Codigestion Process of Vegetable and Fruits Residues: Process and Microbial Ecology,” Bioresource Technology, Vol. 102, No. 20, 2011, pp. 9447-9455. http://dx.doi.org/10.1016/j.biortech.2011.07.068
- V. S. Mohan, G. Mohanakrishna, R. K. Goud and P. N. Sarma, “Acidogenic Fermentation of Vegetable Based Market to Harness Biohydrogen with Simultaneous Stabilization,” Bioresource Technology, Vol. 100, No. 12, 2009, pp. 3061-3068. http://dx.doi.org/10.1016/j.biortech.2008.12.059
- S. W. Van Ginkel, S. E. Oh and B. E. Logan, “Biohydrogen Gas Production from Food Processing and Domestic Wastewaters,” International Journal of Hydrogen Energy, Vol. 30, No. 15, 2005, pp. 1535-1542. http://dx.doi.org/10.1016/j.ijhydene.2004.09.017
- K. Vijayaraghavan, D. Ahmad and C. Soning, “Bio-Hydrogen Generation from Mixed Fruit Peel Waste Using Anaerobic Contact Filter,” International Journal of Hydrogen Energy, Vol. 32, No. 18, 2007, pp. 4754-4760. http://dx.doi.org/10.1016/j.ijhydene.2007.07.001
- P. Yang, R. Zhang, J. A. McGarveyc and J. R. Benemann, “Biohydrogen Production from Cheese Processing Wastewater by Anaerobic Fermentation Using Mixed Microbial Communities,” International Journal of Hydrogen Energy, Vol. 32, No. 18, 2007, pp. 4761-4771. http://dx.doi.org/10.1016/j.ijhydene.2007.07.038
- G. Mohanakrishna, R. Kannaiah Goud, S. Mohan and P. N. Sarma, “Enhancing Biohydrogen Production through Sewage Supplementation of Composite Vegetable Based Market Waste,” International Journal of Hydrogen Energy, Vol. 35, No. 2, 2010, pp. 533-541. http://dx.doi.org/10.1016/j.ijhydene.2009.11.002
- B. Ruggeri and T. Tommasi, “Efficiency and Efficacy of Pre-Treatment and Bioreaction for Bio-H2 Energy Production from Organic Waste,” International Journal of Hydrogen Energy, Vol. 37, No. 8, 2012, pp. 6491-6502. http://dx.doi.org/10.1016/j.ijhydene.2012.01.049
- E. I. Garcia Peña, M. Canul-Chan, I. Chairez, E. Salgado and J. Aranda, “Continuous Bio-Hydrogen Production Based on the Evaluation of Kinetic Parameters of a Mixed Microbial Culture Using Fruit and Vegetable Wastes as Feedstock,” Biomass Bioenergy, 2013.
- H. A. El-Mansy, A. M. Sharoba, H. E. L. M. Bahlol and A. I. El-Desouky, “Rheological Properties of Mango and Papaya Nectar Blends,” Annals of Agricultural Science, Moshtohor, Vol. 43, No. 2, 2005, pp. 665-686.
- G. C. Antonio, F. R. Faria, C. Y. Takeiti and K. J. Park, “Rheological Behavior of Blueberry,” Ciencia e Tecnologia de Alimentos, Vol. 29, No. 4, 2007, pp. 723-737.
- C. L. Nindo, J. Tang, J. R. Powers and P. S. Tlakhar, “Rheological Properties of Blueberry Puree for Prossesing Application,” LWT, Vol. 40, No. 2, 2007, pp. 292-299. http://dx.doi.org/10.1016/j.lwt.2005.10.003
- R. D. Andrade, R. Torres, E. J. Montes and O. A. Perez, “Effect of Temperature on the Rheological Behavior of Zapote Pulp (Calocarpum sapota Merr),” Revista Tecnica de la Universidad de Zulia, Vol. 33, No. 2, 2010, pp. 138-144.
- R. Maceiras, E. Alvarez and M. A. Candela, “Rheological Properties of Fruit Purees: Effect of Cooking,” Journal of Food Engineering, Vol. 80, No. 3, 2006, pp. 763-769. http://dx.doi.org/10.1016/j.jfoodeng.2006.06.028
- M. C. Sanchez, C. Valencia, A. Ciruelos, A. Latorre and C. Gallegos, “Rheological Properties of Tomato Paste: Influence of the Addition of Tomato Slurry,” Journal of Food Science, Vol. 68, 2006, pp. 551-554. http://dx.doi.org/10.1111/j.1365-2621.2003.tb05710.x
- J. Ahmed, “Effect of Temperature on Rheological Characteristics of Ginger Paste,” Emirates Journal of Agricultural Sciences, Vol. 16, No. 1, 2004, pp. 43-49.
- J. Ahmed, Gangopadhaya and U. S. Shivhare, “Effect of Temperature on Rheological Characteristics of Green Chili Puree,” Journal of Food Science and Technology, Vol. 36, 1999, pp. 352-354.
- M. Fraiha, J. D. Biagi and A. C. de Oliveira, “Rheological Behavior of Corn and Soy Mix as Feed Ingredients,” Ciencia e Tecnologia de Alimentos, Vol. 31, No. 1, 2011, pp. 129-134. http://dx.doi.org/10.1590/S0101-20612011000100018
- Ansys Fluent Inc., “Fluent 13.0.,” Lebanon, 2010.
- B. Wu, “Advances in the CFD to Characterize Design and Optimize Bioenergy Systems,” Computers and Electronics in Agriculture, Vol. 93, 2013, pp. 195-208. http://dx.doi.org/10.1016/j.compag.2012.05.008
- P. Mavros, “Flow Visualization in Stirred Vessels. A Review of Experimental Techniques,” Chemical Engineering Research and Design, Vol. 79, No. 2, 2001, pp. 113-127. http://dx.doi.org/10.1205/02638760151095926
- E. L. Paul, V. A. Atiemo-Obeng and S. M. Kresta, “Handbook of Industrial Mixing,” Science and Practice Wiley, New York, 2004.
- T. Nagafune and Y. Hirata, “Measurement of Cavern Sizes and Shape in Agitated Yield Stress Aqueous Solutions with an Electrochemical Probe,” 14th European Conference on Mixing Warszawa, 10-13 September 2012.
- E. Galindo and A. W. Nienow, “Mixing of Highly Viscous Simulated Xanthan Fermentation Broths with the Lightnin A-315 Impeller,” Biotechnology Progress, Vol. 8, No. 3, 1992, pp. 233-239. http://dx.doi.org/10.1021/bp00015a009
- W. Kelly and B. Gigas, “Using CFD to Predict the Behavior of Power Law Fluids near Axial-Flow Impellers Operating in the Transitional Flow Regime,” Chemical Engineering Science, Vol. 58, No. 10, 2003, pp. 2141-2152. http://dx.doi.org/10.1016/S0009-2509(03)00060-5
- S. J. Curran, R. E. Hayes, A. Afacan, M. C. Williams and P. A. Tanguy, “Properties of Carbopol Solutions as Model for Yield-Stress Fluids,” Journal of Food Science, Vol. 67, No. 1, 2002, pp. 176-180. http://dx.doi.org/10.1111/j.1365-2621.2002.tb11379.x
- R. D. Andrade-Pizarro, R. Torres, E. J. Montes, O. A. Perez, C. E. Bustamante and B. B. Mora, “Effect of Temperature on the Rheological Behavior of Zapote Pulp (Calocarpum sapota Merr),” Revista Técnica de la Facultad de Ingeniería Universidad del Zulia, Vol. 33, No. 2, 2010, pp. 138-144.
- B. Metzner and R. E. Otto, “Agitation of Non-Newtonian Fluids,” AICHE Journal, Vol. 3, No. 1, 1975, pp. 3-11. http://dx.doi.org/10.1002/aic.690030103
NOTES
*Corresponding author.