Agricultural Sciences
Vol.5 No.2(2014), Article ID:42943,8 pages DOI:10.4236/as.2014.52021
Time for cotton to uptake water of a known isotopic signature as measured in leaf petioles
Wind, Erosion, and Water Conservation Research Unit, Cropping Systems Research Laboratory USDA-ARS, Lubbock, USA; *Corresponding Author: Robert.Lascano@ars.usda.gov
Copyright © 2014 Timothy S. Goebel, Robert J. Lascano. This is an open access article distributed under the Creative Commons Attribution License, which permits unrestricted use, distribution, and reproduction in any medium, provided the original work is properly cited. In accordance of the Creative Commons Attribution License all Copyrights © 2014 are reserved for SCIRP and the owner of the intellectual property Timothy S. Goebel, Robert J. Lascano. All Copyright © 2014 are guarded by law and by SCIRP as a guardian.
Received 24 November 2013; revised 16 January 2014; accepted 15 February 2014
KEYWORDS
ABSTRACT
While stable isotopes of water have been used to study water movement through the environment, they generally have not been used to examine shorter, more transient events, e.g., rainfall of <25 mm. With the development of robust methods that use isotope ratio infrared spectrometry, evaluating samples has become faster and simpler, allowing more soil and plant samples to be collected and analyzed. Using larger sampling rates can therefore increase the resolution of changes in stable isotopes within an ecosystem, and allows for a better understanding of how quickly rainwater that enters the soil by infiltration is transpired by a plant via rootwater uptake. Quantifying rainwater uptake by plants is essential to increase crop production in rainfed agriculture. Thus the objective of this study was to measure the time required by a plant to transpire water from a source of water with a different isotopic signature than the water that the plant was irrigated. To this end, cotton (Gossypium hirsutum (L.)) plants were grown in a greenhouse and the time required for the enriched water added the soil to show up in the meristematic petioles of cotton leaves was measured. The initial divergence from the irrigation water signature occurred as quickly as 4 hours. The water from the sampled petioles then reached equilibrium with the new source water within 12 hours. Cotton; Stable Isotopes; Water Use
1. INTRODUCTION
Stable isotopes of water have been used to study nutrient cycling, nitrogen fixation and in other ecology and agronomy studies for several decades [1-6]. However, the use of stable isotopes has generally been limited to investigations of large changes in the water regime caused by rainy seasons or changes to the ground water table to determine the water source used by specific plants in the study area [7-15]. Investigations into shorter, more transient environmental changes, such as rain events of <25 mm have not been undertaken because of the relatively small changes in the isotope values and the need to take larger frequency samples to discriminate the effects of the rain on plant water uptake. With the advent of Isotope Ratio Infrared Spectrometry (IRIS) the ability to process and analyze soil and plant samples has become simpler and faster, allowing for studies that require a large number of samples to quantify the process studied.
One complication of using IRIS to analyze water from plant extracts is the interference caused by the -OH bonds from organic compounds that will co-distill with the plant water such as methanol (MeOH), ethanol, (EtOH) as well as organic acids (-COOH) [16]. The interference from these compounds can lead to erroneous isotope ratios. To quantify this interference companies that manufacture and sell isotope analyzers, e.g., Los Gatos Research (http://www.lgrinc.com) and Picarro (http://www.picarro.com)1 developed software that evaluates the level of contamination in a sample. Furthermore, it was recently reported that it is possible to calibrate IRIS instruments for these contaminants using MeOH and EtOH and to remove the effects these contaminants have on the resulting isotope ratio [17]. In addition, Leen et al. [18] showed that the calibration of IRIS instruments is not uniform and therefore, the calibration of each instrument is required to accurately remove the effects of organic contamination on IRIS instrumental output.
To determine root-water uptake of rainwater, with accumulations of <25 mm, requires knowing the amount of time that it will take for a plant to uptake the rainwater and for that water to move from the roots through the xylem to the leaves. While there are examples of experiments evaluating plant water uptake using stable isotopes [19-25], to our knowledge, determining the amount of time it takes for water to move through the plant using stable isotopes in cotton has not been reported. Thus the intent of this study was to determine the time that it takes for enriched isotopic water, compared to untreated, i.e., irrigation water, reach the petioles in the meristem of cotton plants in a greenhouse environment.
2. MATERIALS AND METHODS
2.1. Isotopic Enrichment of Source Water
To determine the response time to changes in isotopic concentrations of source-water in cotton, the experimental set of plants must be dosed with water that is either enriched or depleted in δ18O or δ2H with respect to the control source-water. For this experiment the water was isotopically enriched using the partitioning effect caused by evaporation where light water, i.e.,  will evaporate at a faster rate than heavy water, i.e., DH16O,
  , DH18O,
  , or
, or  [6,7,16,26,27]. To accomplish this a 130-L plastic trashcan was filled with tap water from Lubbock, TX on 31 May 2012, and placed in a greenhouse and was allowed to enrich through evaporation over the course of 20 days. While environmental variables such as temperature, humidity and wind speed will affect evaporation rate and thus enrichment rate, the 130-L trashcan was left in the greenhouse for the duration of this experiment to reduce the debris that might collect from exposure to the natural environment. The greenhouse used in all these experiments is located on the facilities of the Cropping Systems Research Laboratory, USDA-ARS, in Lubbock, TX. To check the progress of enrichment, water in the 130-L trashcan was sampled 10 times between the 31 May and 17 June 2012, with thoroughly mixed water samples and analyzed on a Liquid Water Isotope Analyzer (LIWA) (Los Gatos Research (LGR), Model DLT-100, Mountain View, CA) located at the USDA-ARS research facility in Lubbock, TX. For these measurements, we followed the IAEA Protocol for analysis of stable isotopes using IRIS instruments [28]. The results of the water enrichment obtained by evaporation over a period of 20 days showed that the δ18O increased linearly from −6 δ18O on the 31 May to −1.2 δ18O on the 17 June 2012 as shown in Figure 1.
2.2. Greenhouse Experimental Design
Two experiments were conducted with cotton plants grown in the greenhouse previously described. The first experiment; hereafter, referred to as the control experiment, was done with cotton plants that were watered with the same water source to determine the variation of δ18O and δ2H isotope signatures in the leaf petioles during two diurnal periods (48 h). The second experiment evaluated the δ18O and δ2H of cotton petiole water over time when half of the plants were dosed with enriched water from the trashcan instead of the irrigation water. For this experiment; hereafter, referred to as the water uptake experiment, the δ18O and δ2H of the petiole water was evaluated over time to determine the amount of time required to observe enrichment of the petiole water due to the movement of the enriched water into the roots and through the petioles through transpiration.
Control. Five Cottonseeds (FiberMax, 91880B2F) were planted on 1 February 2012 in fifty 2-gallon (7.6 L) pots and arranged in two rows of 25 plants (Figure 2). Each pot
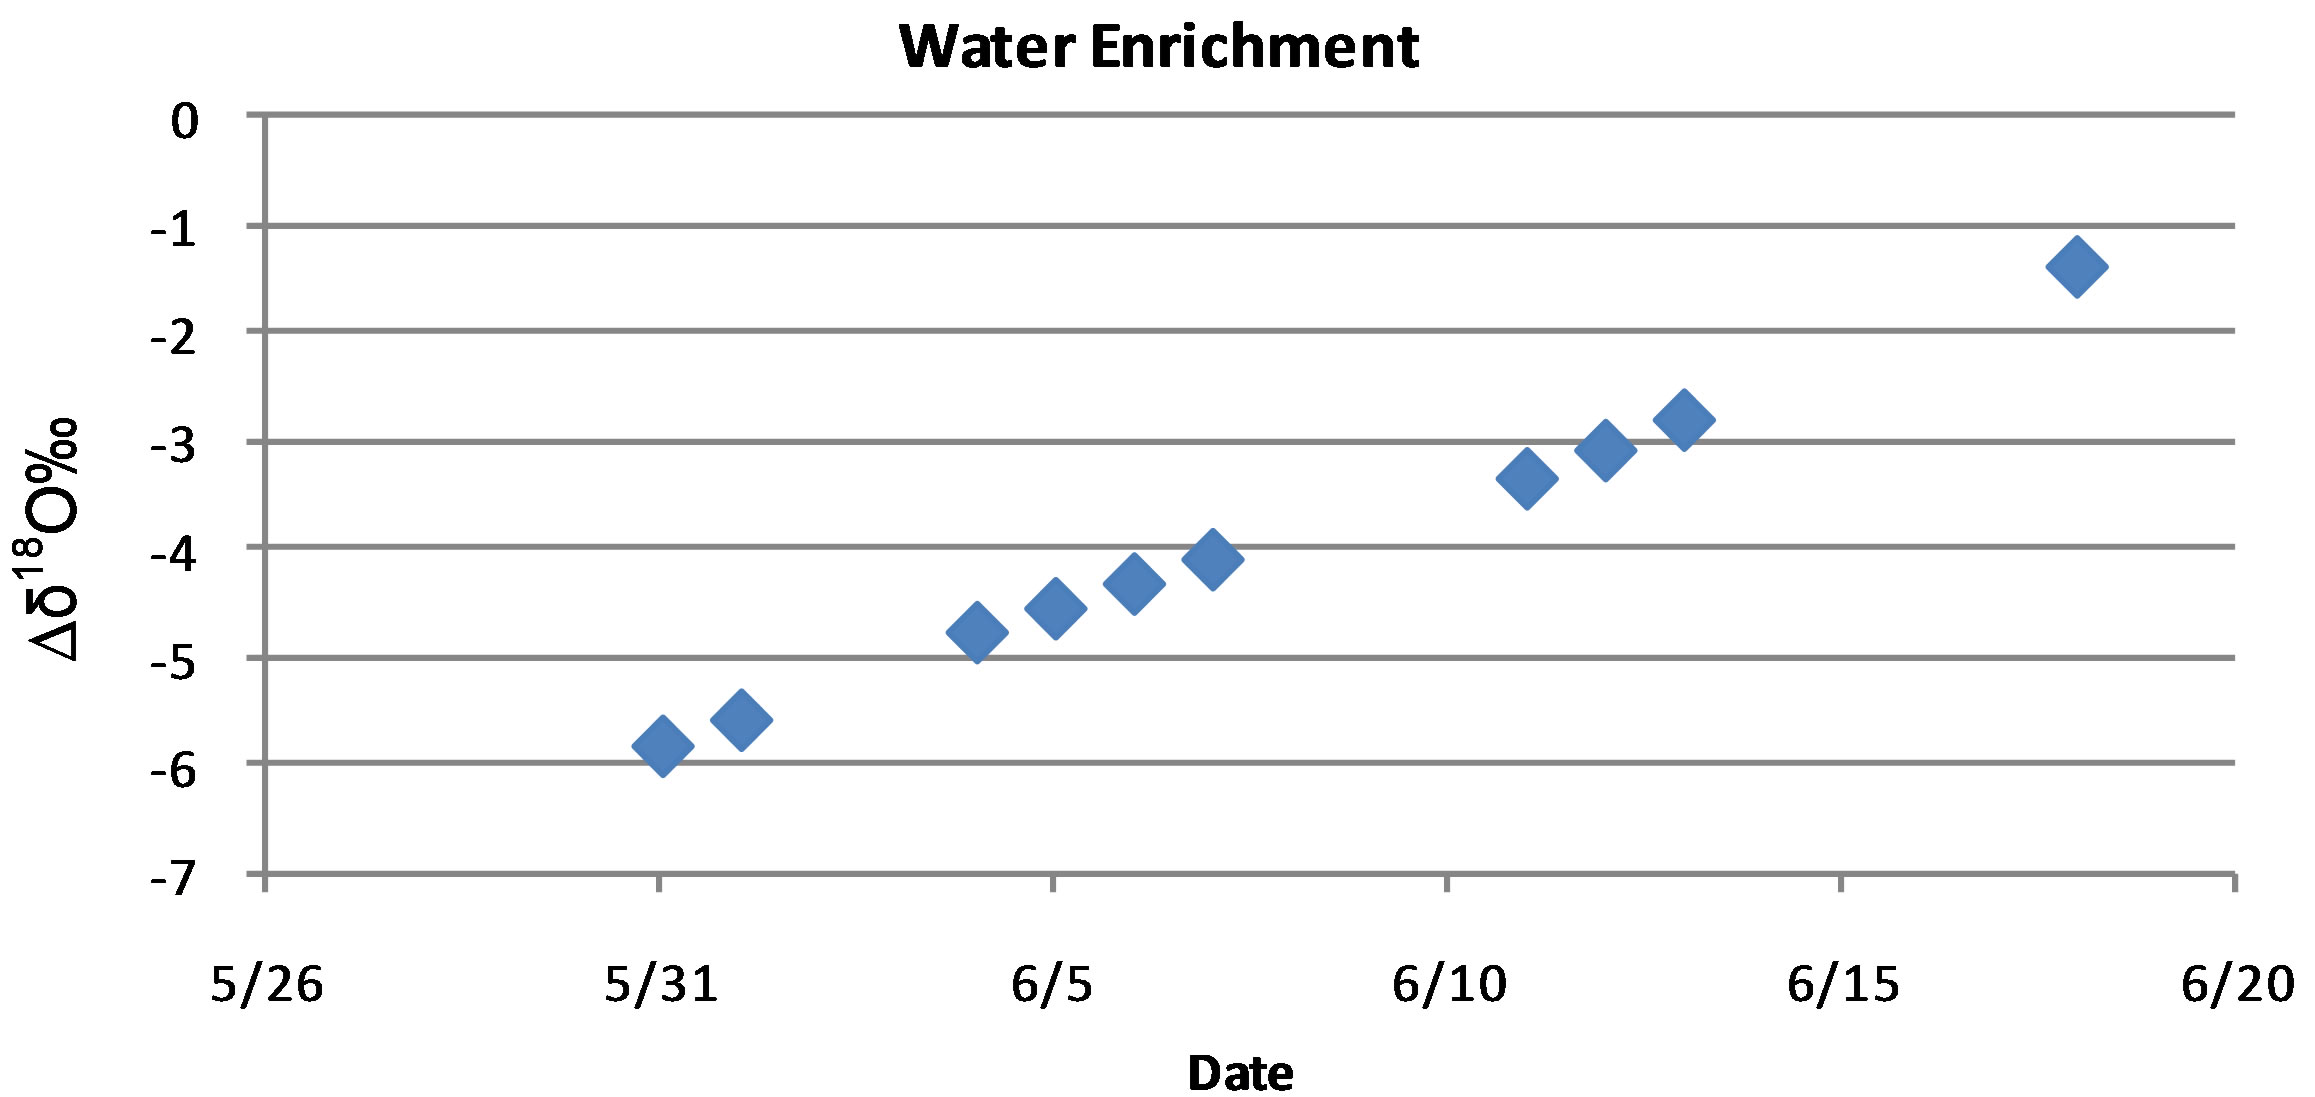
Figure 1. Isotopic enrichment of tap water placed in a 130-L trashcan and allowed to evaporate from the 31 May to the 17 June 2012.
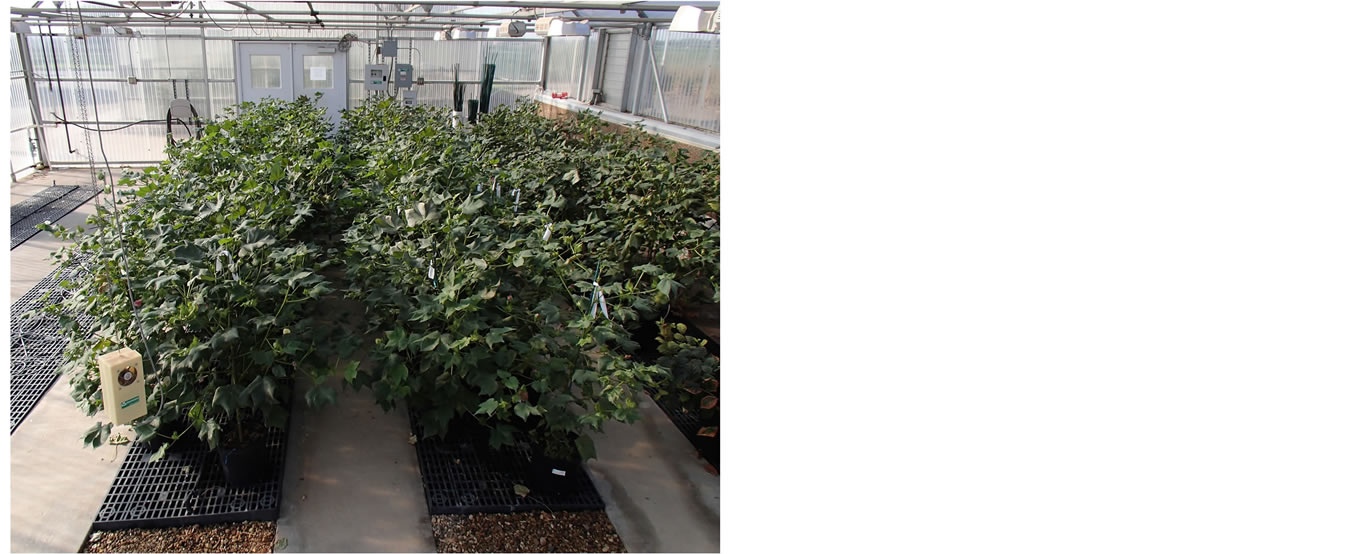
Figure 2. Cotton plants grown in the greenhouse for the control and water uptake experiments.
had a drip emitter an irrigated with tap water from Lubbock, TX. After emergence one cotton plant was kept per pot and the rest were removed. Approximately three months after emergence the 48-hour diurnal experiments started on the 18 April 2012 when cottons plants had passed the open boll stage with the following protocol. Starting at 6:00 AM, local time and before sunrise, samples from the leaf petioles of individual cotton plants were taken every two hours, for a total of 25 sampling periods over two days. Three petioles were cut from the top of the cotton plants and then petioles were further reduced into ~13 mm pieces and placed in an 8 mL screw top vial that was sealed and placed in a freezer (Frigidaire®, −4˚C) located on site where they remained until the samples were to be extracted.
Water Uptake Experiment. Cottonseeds, same variety as used in control experiment, were planted on 14 March 2012 in fifty 2-gallon (7.6 L) pots and arranged in two rows of 25 plants each, as was done in the control experiment and as shown in Figure 2. The cotton plants were again grown to maturity and watered using one drip emitter per pot. At the onset of this experiment the watering drip emitters for one row (25 pots) of plants were shut off on 20 June 2012. The watering cycle of the drip emitters was continued but the cotton plants were thereafter watered using the isotopically enriched water obtained from the trashcan shown in Figure 1. This required adding 150 mL of water to each pot on the preset schedule of the emitters, which was once every two hours from 7:00 until 11:00, then every 0.5 hours from 12:00 until 19:00. Petiole plant samples were taken following the same protocol as in the control experiment, i.e., every two hours for 48 h. Petioles were sampled from the top of the plant and reduced in size to 13 mm and placed in a screw top vial, sealed and placed in the freezer until time for extraction.
2.3. Extraction of Petiole Water
To determine the isotopic concentration of water from the petiole, all the water must be extracted. There are several methods to accomplish this; however, cryogenic distillation of the petiole water was used and it is a well-documented method [29-32]. The first step to distillation is to determine the calibration of extraction time. Given that fractionation of heavy water from light water will occur during distillation, the amount of time required to achieve complete distillation of all of the water in the petiole is necessary and must be determined. To accomplish this, petiole samples were taken from the cotton plants grown in the greenhouse for the control experiment 3 weeks before the control experiment was conducted. Three petioles were sampled and reduced in size to ~13 mm, placed in an 8 mL glass screw top vial, sealed and stored in the freezer until time for extraction. To begin the extraction procedure the stored vials were removed from the freezer, the caps were removed and both the caps and the vials were placed into an ignition tube (Pyrex®, 25 × 200 cm) and a rubber stopper was used to seal the ignition tube [33] The tube was then placed in liquid nitrogen (LN2) for 20 minutes prior to placement on the distillation apparatus. The ignition tube was then placed on the distillation apparatus and vacuum was applied until the pressure read <13 Pa. The port was then isolated from the vacuum and tested for leaks, if none were present then the LN2 was removed from the ignition tube and placed under the collection tube. A 1000 mL beaker was then placed under the ignition tube containing the petiole samples and boiling water was added, a heating mantle was turned on and the timer was set. The amount of time the petiole was allowed to stay on the distillation port varied from 4, 6, 8, 10, 15, 20, 25, 30, 40, 50, 60, 70, 80, 90, 100, 110, and 120 minutes. The results from the petiole extraction time are shown in Figure 3 indicating that after 60 minutes the δ18O and δ2H signatures were constant.
2.4. Calibration of Contaminants
Organic contaminants have been shown to cause spectral interference in water samples obtained by vacuum distillation of plant material [16-18]. However, the effects of these organic compounds can be evaluated and corrected using a procedure developed by Schultz et al. [17]. Thus, to correct for the effects of the organic compounds in water samples, calibration of the LIWA instrument used for the organics was necessary. As pointed out by Schultz et al. [17], methanol and ethanol are proxies that can be used to further evaluate the interference of organic compounds both on the narrowband (NB) and broadband (BB) absorption spectra of water analyzed by infrared spectroscopy. Further, Leen et al.
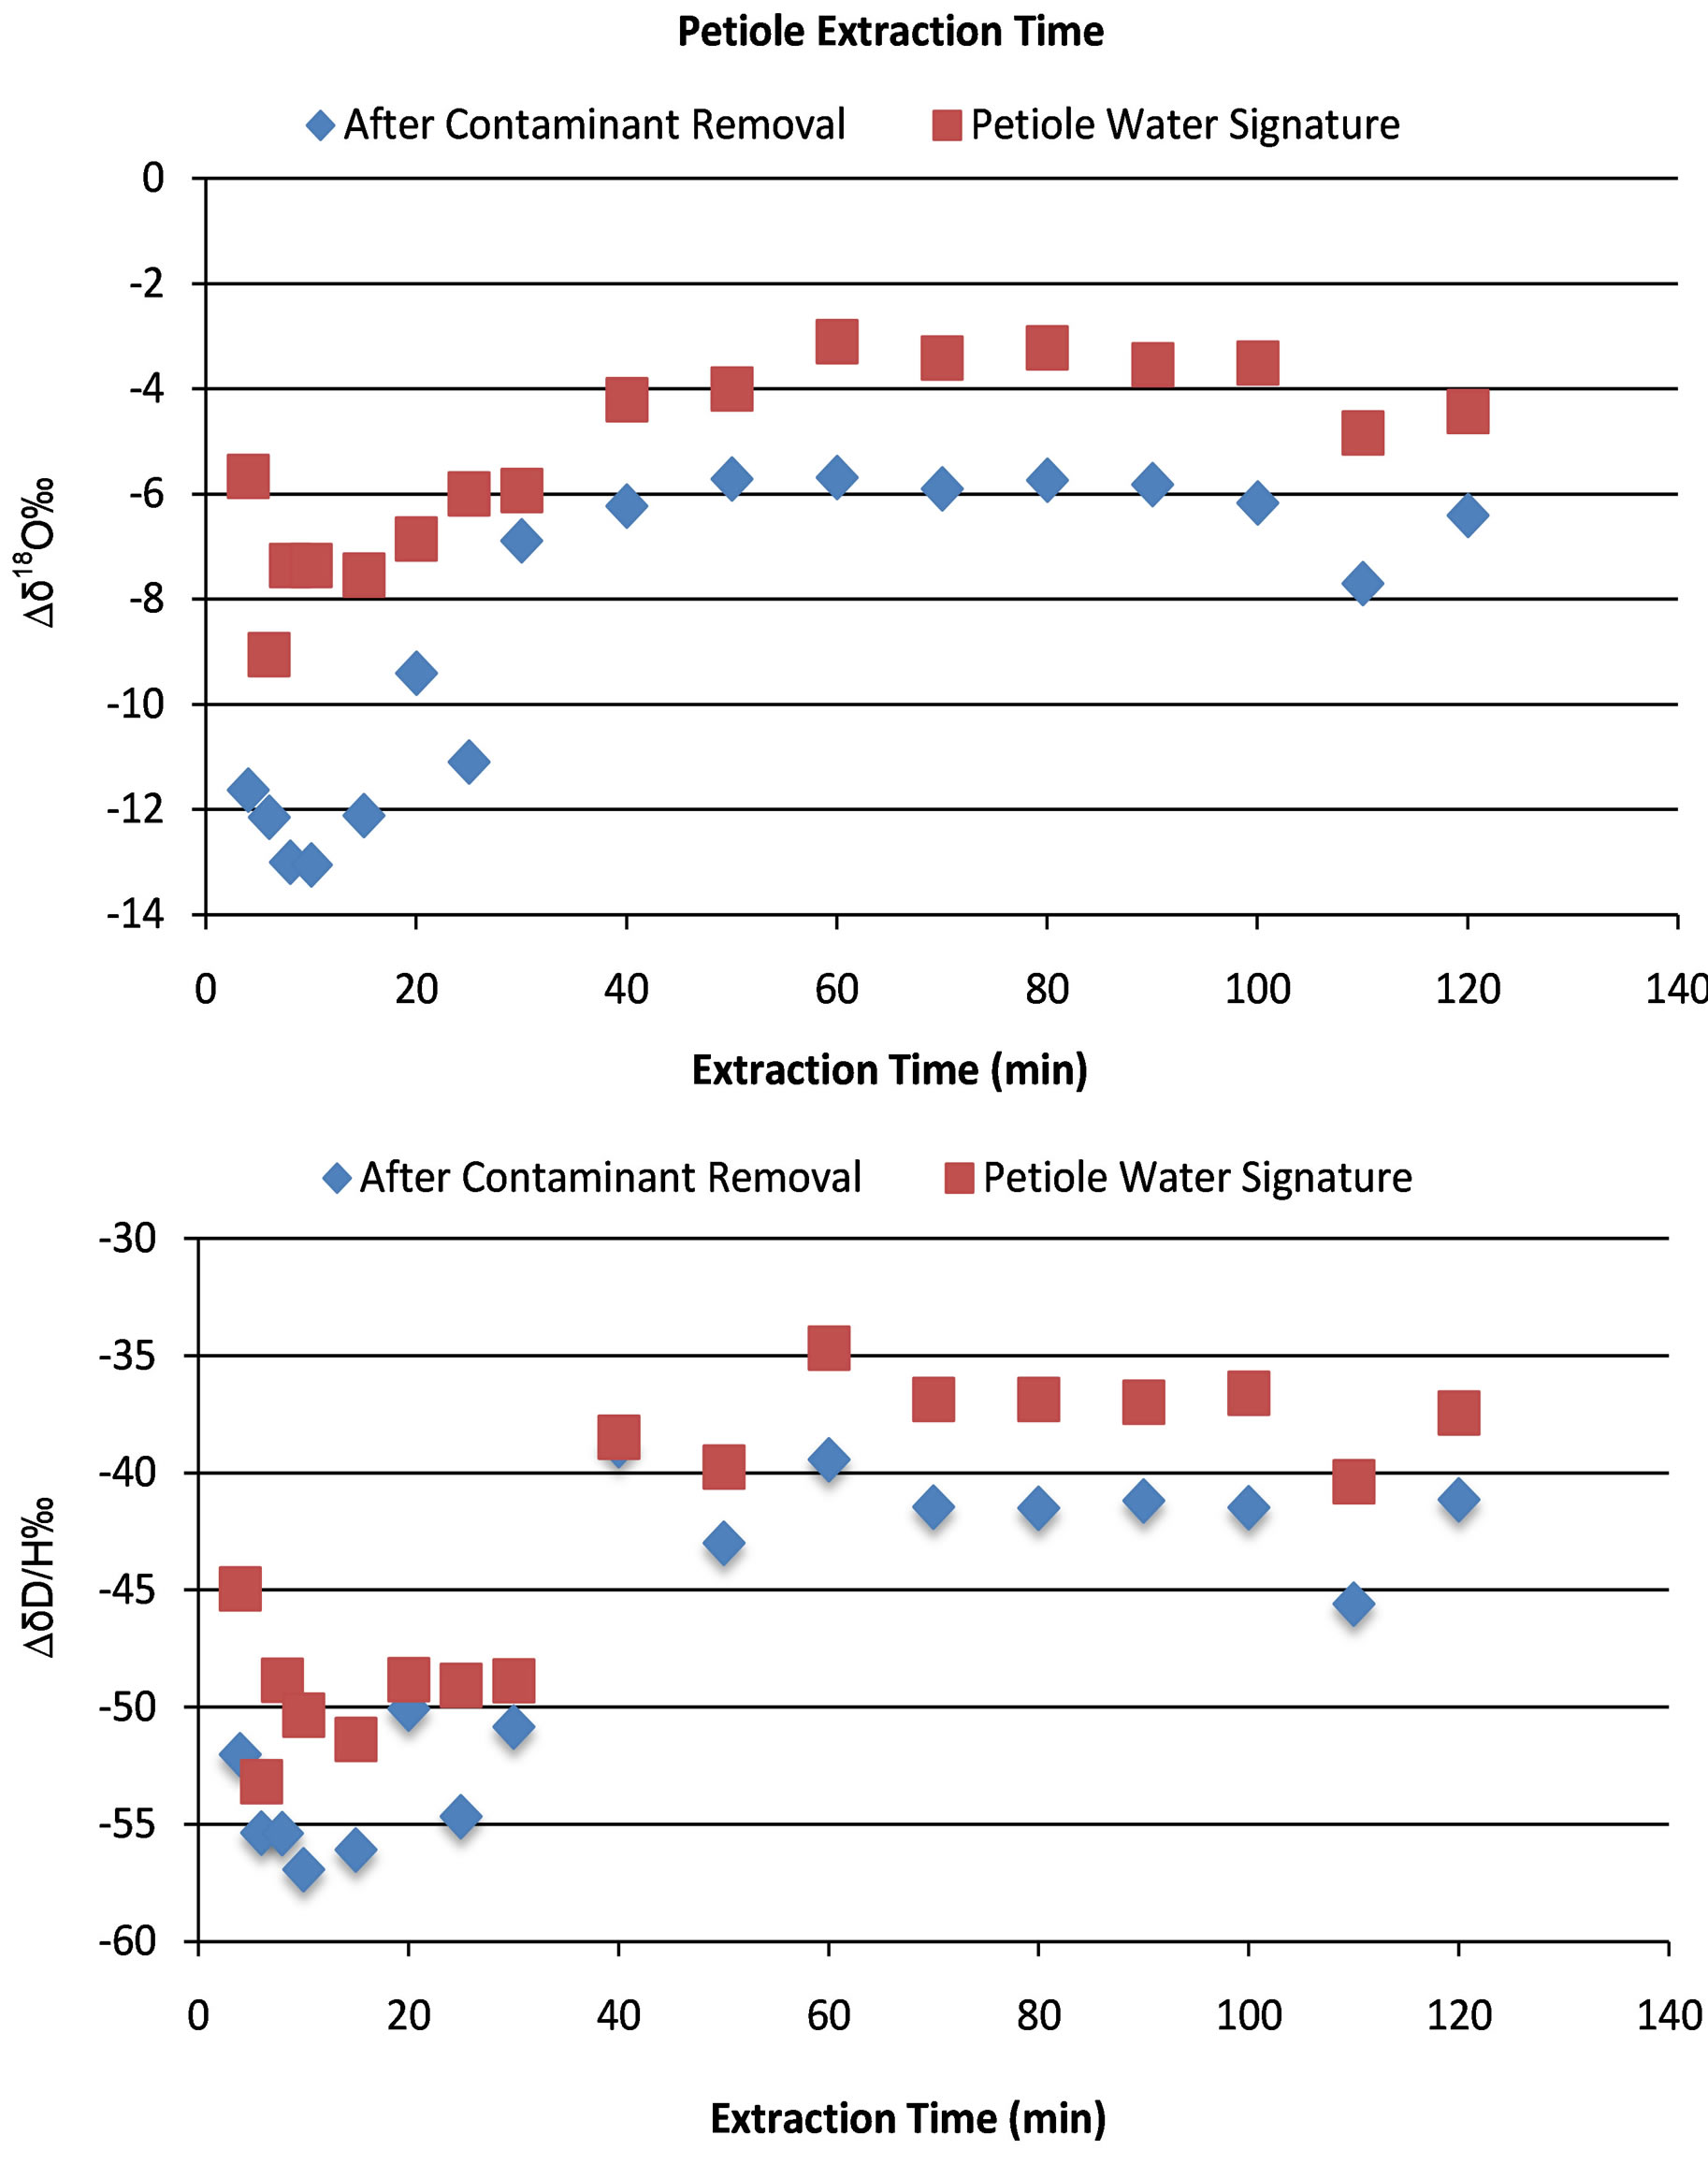
Figure 3. Effect of extraction time on Δδ18O and Δδ2H of the petiole water including the removal of contaminants that were co-distilled with the petiole water.
[18] showed that each LIWA instrument required an instrument-specific calibration and thus methanol and ethanol calibration plots were developed following the methods described by Schultz et al. [17]. In these experiments, we only used petioles, which means that the organic contaminants co-distilled with the plant material were less than from other plant structures such as the leaves. Because the broadband interferences (represented by EtOH) and narrowband interferences (represented by MeOH) were lower, and based on the results from the LGR-Spectral Contaminant Identifier (LGR-SCI) software, narrower calibration ranges were used. Ethanol solutions were made using concentration ranges of 0.2% to 2.0% and methanol concentration ranges from 20 to 2000 ppmv (Figure 4).
2.5. Removal of Contaminants
To determine the level of contamination in the water extracted from the petioles sampled, the spectral data from each plant sample was analyzed using the LGR-SCI Software (Version 1.0.0.69). This software calculates the level of broadband and narrow band contamination from the spectra produced by each sample analyzed. The output from the software then becomes the input for the equations obtained from the calibration of ethanol and methanol, shown in Figure 4, resulting in a new value. Thus, it is possible to remove contaminants from the results obtained with the LIWA instrument.
The effect of the contaminant removal is shown in Figure 3 where the net effect is a decrease in the δ18Ο and δ2Η values. The removal of the effect of narrow and

Figure 4. Calibration of the LGR DLT-100 instrument for interferences from organics using ethanol to represent broadband interferences (BB) and methanol to represent narrowband interferences (NB).
broadband interferences for the data keeps the trends but decreases net result of δ18Ο and δ2Η values for the petiole water to a value that is closer to the water that was used for irrigation at −6‰ Δδ18Ο.
3. RESULTS
The use of a trashcan filled with tap water and sampled periodically resulted in a linear relationship of enrichment with time. This simple method provided a water source for plants that was ~−4.5‰ δ18Ο more enriched than the irrigation water. This has a practical application in that it provides at a low cost small batches of enriched water can be used in both greenhouse and small-scale plot experiments to evaluate water movement without the need to wait for rainfall events or the expense of buying large volumes enriched water that would be needed for greenhouse experiments.
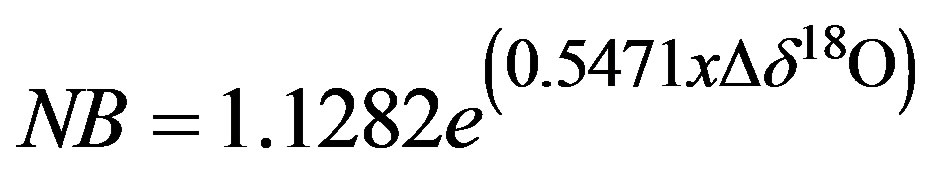
The results from the calibration of contaminants (Figure 4) are similar to those given by Schultz et al. (17), even though they were studying a variety of different plants and plant tissues, and our focus was on cotton petioles. By avoiding the leaves of the cotton plant we were able to minimize the contaminant concentration in the extracted water sample. As such, narrowband contamination of samples were never >4000 (AU) and so the equation for the removal of narrow band (NB) contaminants was:
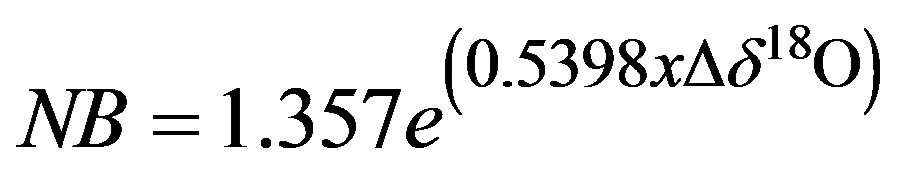 (1)
(1)
and
 (2)
(2)
The amount of time that the petioles are extracted is important due to fractionation (Figure 3). If the leaf petioles are distilled for a period that is not long enough to achieve full extraction of the plant water then some residual heavy water will be left in the petioles and the resulting water sample will be depleted with respect to the total water in the petiole prior to distillation. The results from the extraction timing experiments show that the minimum time required to achieve a uniform sample was 60 minutes (Figure 3). Nevertheless, for the cotton petioles collected in our experiments, we used 90 minutes as the standard extraction time to account for some variability in the mass of petioles sampled. The removal of the organic contamination resulted in a decrease in the δ18Ο value of ~2‰. The final result then approaches the value of the water applied to the plants of −6.37‰ δ18Ο.
In the control experiment, there was variation across the two rows sampled at any particular time; however, there was no discernable variation between the two rows across the entire 48 hours of the experiment as show in Figure 5. During the enrichment experiment divergence occurred between the cotton plants in a row that was a control and the row of cotton plants that were irrigated using the enriched water. The divergence appears to begin as early as 4 hours but did not reach its maximum until 12 hours. The results from the δ2H were similar and thus the data are not shown.
4. DISCUSSION
The use of a trashcan as a container to store water that was used for the enrichment of water and then subsequently used as a source water for greenhouse experiments provided a simple and inexpensive way to develop an isotopically different water for our purpose and tests. We successfully applied the methods developed by Schultz et al. [17] to remove the organic contaminants from the measurements obtained with the IRIS instruments. The removal of the organic contaminants brought the isotope ratio closer to that of the source water.
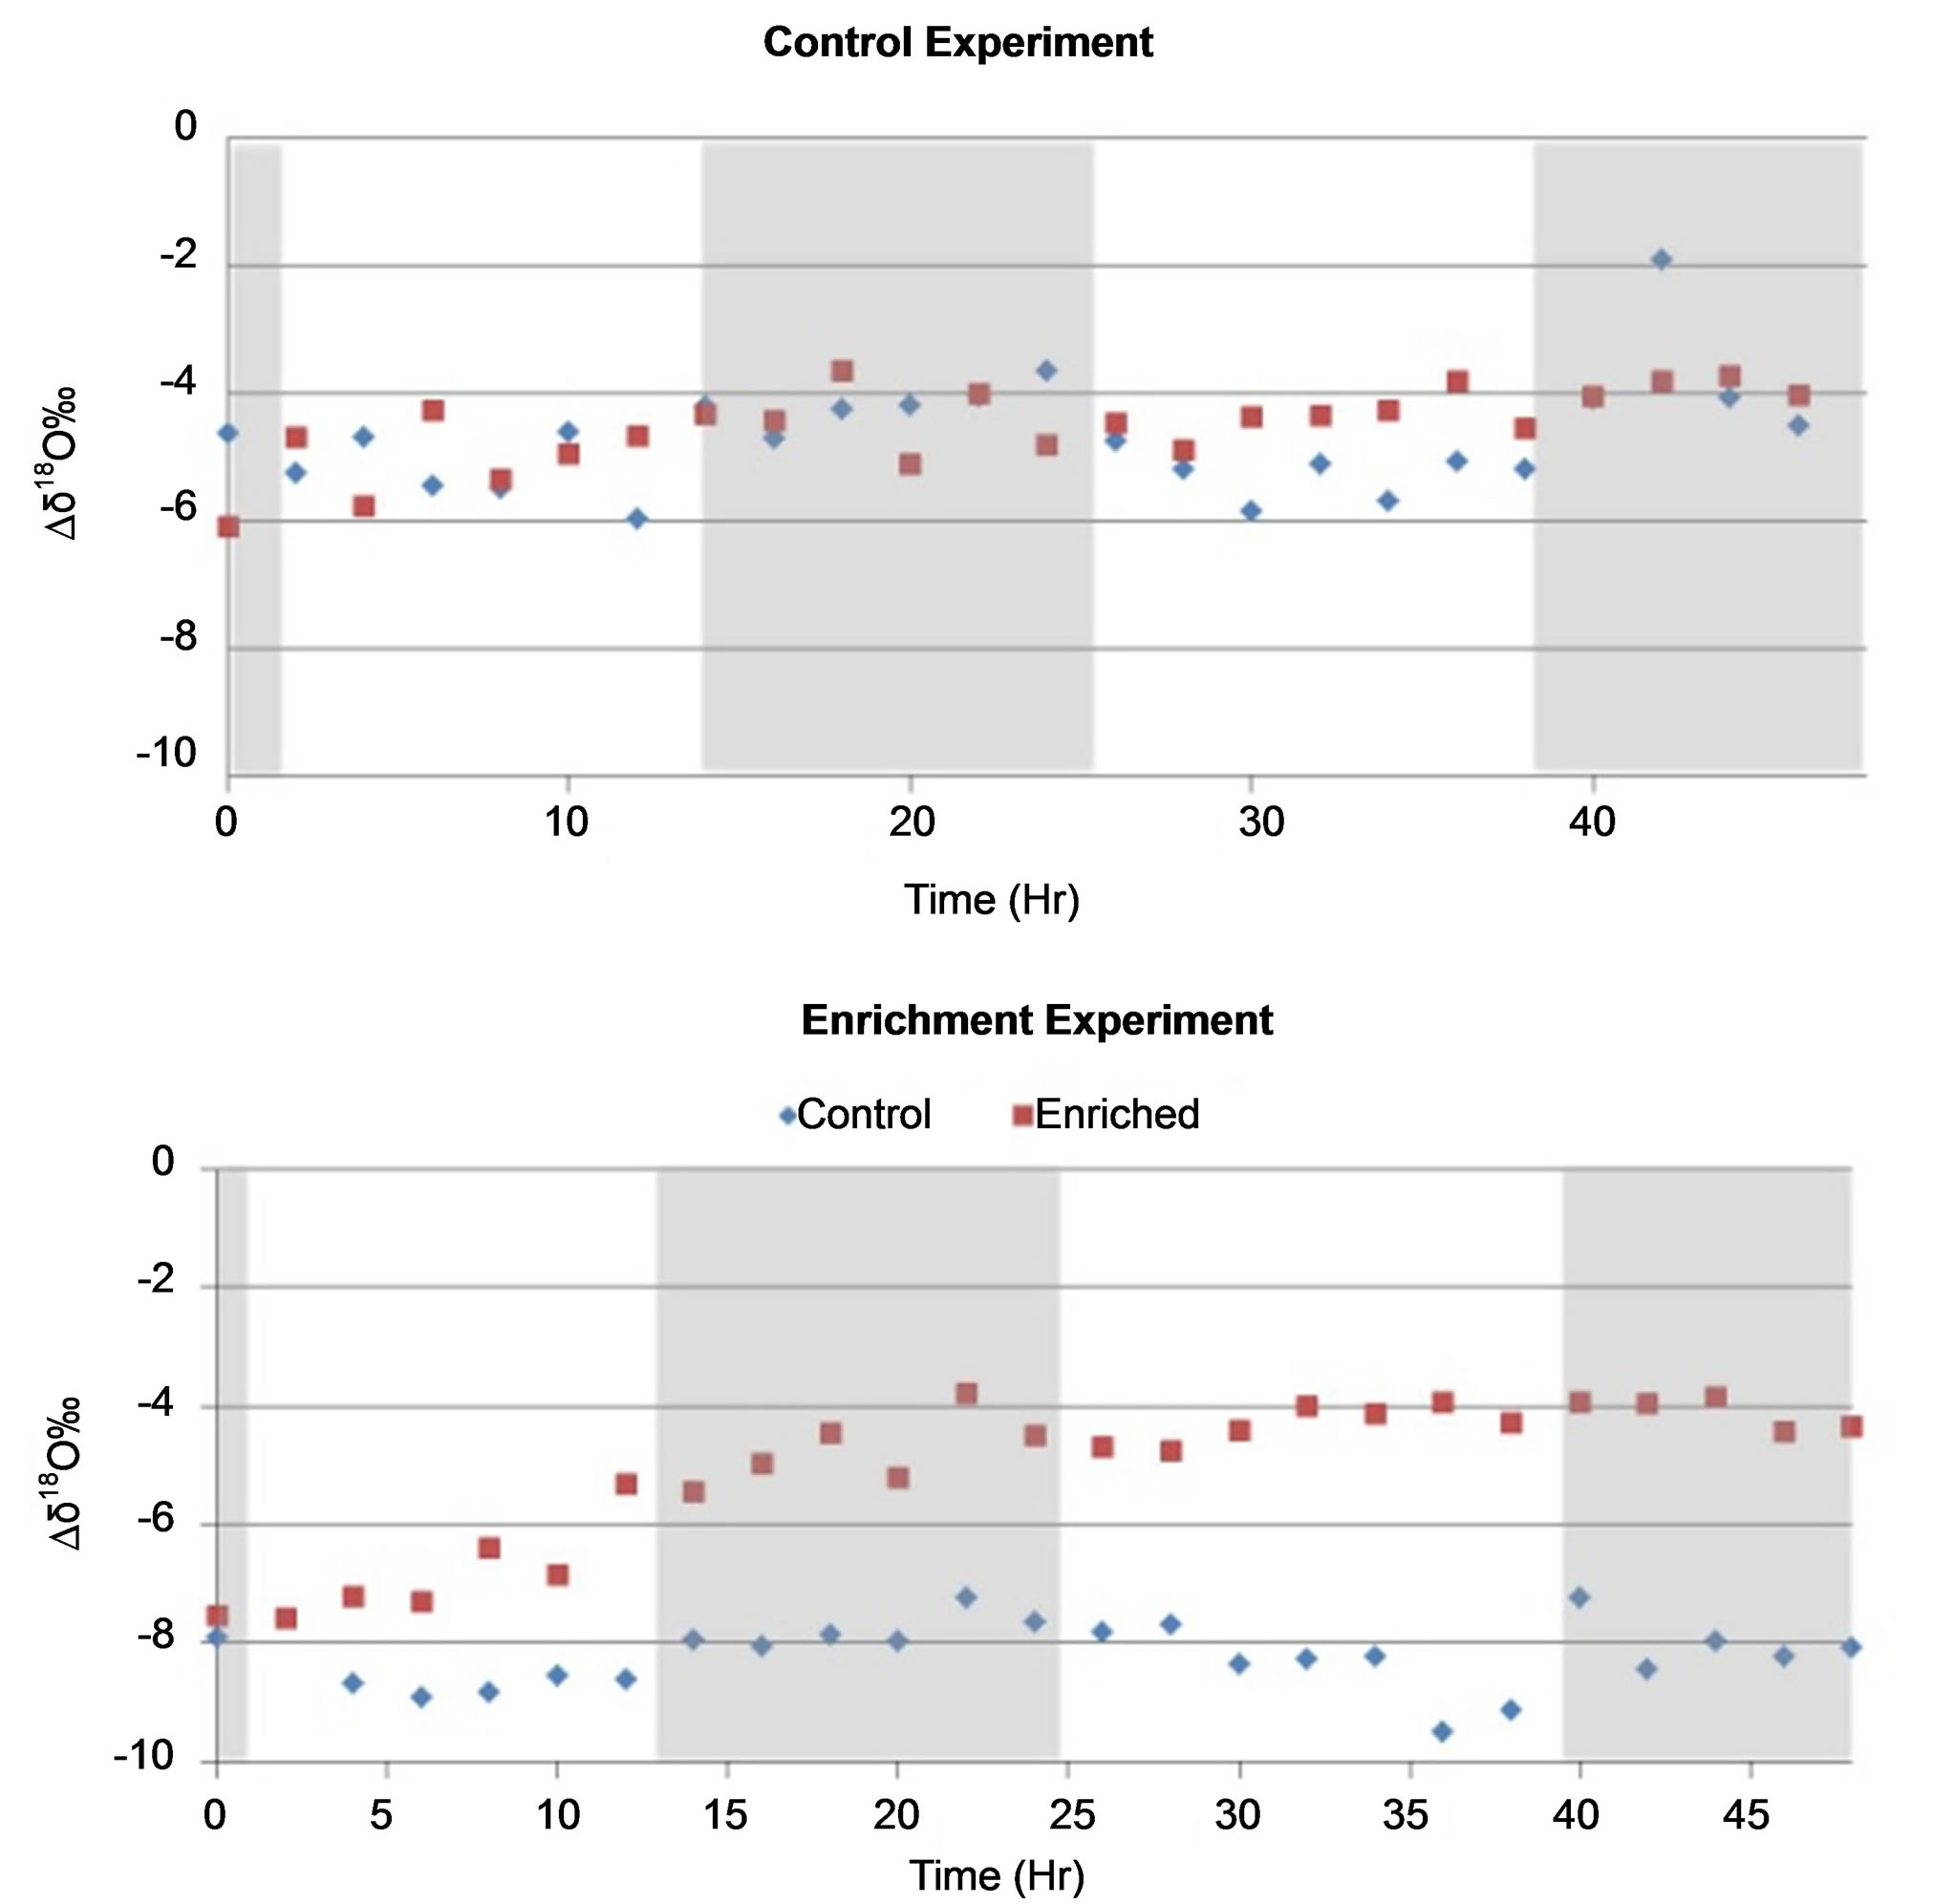
Figure 5. δ18O signature of water extracted from cotton petioles sampled every two hours from the control experiment (A), and water uptake experiment (B) using enriched water (−1.37‰ δ18O) as source water for half of the cotton plants and tap water as the control (−6.37‰ δ18O). Shaded areas differentiate day and night conditions.
The greenhouse experiments showed full equilibration of the enriched source water and control within 14 hours (Figure 5) with a divergence from the control plants in as little as 4 hours. The use of a greenhouse and cotton plants in pots gave us greater control over the water supply the plant was transpiring. These results clearly suggest that the uptake of rainwater by cotton plants from rain events 25 mm or less could be observed in as little as a few hours after the rain and that is unnecessary to obtain samples for more than 24 hours (one diurnal cycle). Instead it would be more desirable to obtain samples more frequently over a single diurnal cycle after a rain event.
The extrapolation of our method and of the results obtained from these experiments to cotton plants grown under field conditions will be somewhat more complicated. For example, at any giving point during the growing season a cotton plant may have access to stored soil water that was supplied by rain and/or by irrigation. Further, as roots develop and mine deeper soil the transpiration stream is a mixture of water from different soil depths and from different rain events. While the rain itself may be enriched or depleted when compared to the water stored in the soil, the net effect will be a dilution of the rainwater signature in the cotton petioles due to mixing with water supplied by deeper roots. If mixing occurs with water from roots near the surface and water supplied from deeper roots then either larger rainfall events would be necessary or rainwater with a large difference in δ18Ο and δ2H would be needed to track the rainwater movement.
The results from these experiments suggest that it should be possible to observe rainfall events that are smaller than seasonal changes in precipitation such as monsoon seasons. The water from smaller rain events may only infiltrate a few centimeters into the soil and then effectively disappear within in a few days as soil water evaporation occurs. The results from the greenhouse experiments suggest that even in the course of one day the root-water uptake of rainwater can be observed and measured in the cotton petioles. This will make future investigations into rainwater uptake by crops under different management practices possible and will allow us to quantify the use of rainwater by crops that are not irrigated thus improving the management of dryland crops such as cotton. This information is essential in dryland agriculture and in areas where irrigation water is declining, such as the Southern High Plains of Texas, where most of the rain occurs during the growing season and about 50% of individual rain events are <6 mm.
ACKNOWLEDGEMENTS
This research was supported in part by the Ogallala Aquifer Program, a consortium between USDA Agricultural Research Service, Kansas State University, Texas AgriLife Research, Texas AgriLife Extension Service, Texas Tech University, and West Texas A&M University.
REFERENCES
- Wickman, F.E. (1952) Variations in the relative abundance of the carbon isotopes in plants. Geochemicaet Cosmochemica Acta, 2, 243-254. http://dx.doi.org/10.1016/0016-7037(52)90018-5
- Keeling, C.D. (1958) The concentration and isotopic abundances of atmospheric carbon dioxide in rural areas. Geochemicaet Cosmochemica Acta, 13, 322-334. http://dx.doi.org/10.1016/0016-7037(58)90033-4
- Keeling, C.D. (1961) The concentration and isotopic abundances of atmospheric carbon dioxide in rural and marine air. Geochemicaet Cosmochemica Acta, 24, 277- 298. http://dx.doi.org/10.1016/0016-7037(61)90023-0
- Park, R. and Epstein, S. (1961) Metabolic fractionation of 13C & 12C in plants. Plant Physiology, 36, 133-138. http://dx.doi.org/10.1104/pp.36.2.133
- Dawson, T.E., Mambelli, S., Plamboek, A.H., Templer, P.H. and Tu, K.P. (2002) Stable isotopes in plant ecology. Annual Review Ecological Systems, 33, 507-559. http://dx.doi.org/10.1146/annurev.ecolsys.33.020602.095451
- Flanagan, L.B., Ehleringer, J.E. and Pataki, D.E. (2005) Stable isotopes and the biosphere-atmosphere interactions. In: Mooney, H.A., Ed., Physiological Ecology, Elsevier, San Diego, 9-28. http://dx.doi.org/10.1146/annurev.ecolsys.33.020602.095451
- Allison, G.B. and Hughes, M.W. (1983) The natural use of tracers as indicators of soil-water movement in a temperate semi-arid region. Journal of Hydrology, 60, 157- 173. http://dx.doi.org/10.1016/0022-1694(83)90019-7
- Yakir, D., DeNiro, M.J. and GAT, J.R. (1990) Natural deuterium and oxygen-18 enrichment in leaf water of cotton plants grown under wet and dry conditions: Evidence for water compartmentation and its dynamics. Plant Cell and Environment, 13, 49-56. http://dx.doi.org/10.1111/j.1365-3040.1990.tb01298.x
- Brugnoli, E. and Bjorkman, O. (1992) Growth of cotton under continuous salinity stress: Influence on allocation pattern, stomatal and non-stomatal components of photosynthesis and dissipation of excess light energy. Planta, 187, 335-345. http://dx.doi.org/10.1007/BF00195657
- Scrimgeour, C.M. (1995) Measurement of plant and soil water isotope composition by direct equilibration methods. Journal of Hydrology, 172, 261-274. http://dx.doi.org/10.1016/0022-1694(95)02716-3
- Gat, J.R. (1996) Oxygen and hydrogen isotopes in the hydrologic cycle. Annual Reviews in Earth Planetary Science, 24, 225-262. http://dx.doi.org/10.1146/annurev.earth.24.1.225
- Tang, K. and Feng, X. (2001,) The effect of soil hydrology on the oxygen and hydrogen isotopic compositions of plants’ source water. Earth and Planetary Science Letters, 185, 355-367. http://dx.doi.org/10.1016/S0012-821X(00)00385-X
- Gan, K.S., Wong Yong, S.C. and Farquhar, G.D. (2002) 18O Spatial patterns in vein xylem water, leaf water, and dry matter in cotton leaves. Plant Physiology, 130, 1008- 1021. http://dx.doi.org/10.1104/pp.007419
- Grazis, C. and Feng, X. (2004) A stable isotope study of soil water: Evidence for mixing and preferential flow paths. Geoderma, 119, 97-111. http://dx.doi.org/10.1016/S0016-7061(03)00243-X
- Barbour, M.M., Roden, J.S., Farquhar, G.D. and Ehleringer, J.R. (2004) Expressing leaf water and cellulose oxygen isotope ratios as enrichment above source water reveals evidence of a Peclet effect. Oecologia, 138, 426- 435. http://dx.doi.org/10.1007/s00442-003-1449-3
- West, A., Goldsmith, G., Brooks, P. and Dawson, T. (2010) Discrepancies between isotope ratio infrared spectroscopy and isotope ratio mass spectrometry from the stable isotope analysis of plant and soil waters. Rapid Communication Mass Spectrometry, 24, 1948. http://dx.doi.org/10.1002/rcm.4597
- Schultz, N.M., Griffis, T.J., Lee, X. and Baker, J.M. (2011) Identification and correction of spectral contamination in 2H/1H and 18O/16O measured in leaf, stem and soil water. Rapid Communications Mass Spectrometry, 25, 3360. http://dx.doi.org/10.1002/rcm.5236
- Leen, J.B., Berman, E.S.F., Liebson, L. and Gupta, M. (2012) Spectral contaminant identifier for off-axis integrated cavity output spectroscopy measurements of liquid water isotopes. 83, 044305-1-044305-5.
- Rowland, D.L., Leffler, A.J., Sorenson, R.B., Dorner, J.W. and Lamb, M.C. (2008) Testing the efficacy of deuterium application for tracing water uptake in peanuts. Transactions of the ASABE, 51, 455-461. http://dx.doi.org/10.13031/2013.24387
- Wang, P., Song, X., Han, D., Zhang, Y. and Liu, X. (2010) A study of root water uptake of crops indicated by hydrogen and oxygen stable isotopes: A case in Shanxi Provence, China. Agricultural Water Management, 97, 475-482. http://dx.doi.org/10.1016/j.agwat.2009.11.008
- Barbour, M.M. (2007) Stable oxygen isotope composition of plant tissue: A review. Functional Plant Biology, 34, 83-94. http://dx.doi.org/10.1071/FP06228
- Cernusak, L.A., Pate, J.S. and Farquhar, G.D. (2002) Diurnal variation in the stable isotope composition of water and dry matter in fruiting lupines angustifolius under field conditions. Plant, Cell and Environment, 25, 893- 907. http://dx.doi.org/10.1046/j.1365-3040.2002.00875.x
- Farquhar, G.D. and Cernusak, L.A. (2005) On the isotopic composition of leaf water in the non-steady state. Functional Plant Biology, 32, 293-303. http://dx.doi.org/10.1071/FP04232
- Wang, L., Good, S.P., Caylor, K.K. and Cernusak, L.A. (2012) Direct quantification of leaf transpiration isotopic composition. Agricultural and Forest Meteorology, 154, 127-135. http://dx.doi.org/10.1016/j.agrformet.2011.10.018
- Gan, K.S., Wong, S.C., Yong, J.W.H. and Farquhar, G.D. (2002) 18O Spatial patterns of vein xylem water, leaf water, and dry matter in cotton leaves. Plant Physiology, 130, 1008-1021. http://dx.doi.org/10.1104/pp.007419
- Chialvo, A.A. and Horita, J. (2009) Liquid-vapor equilibrium isotope fractionation of water: How well can classical water models predict it? Journal of Chemical Physics, 130, Article ID: 094509. http://dx.doi.org/10.1063/1.3082401
- Horita, J., Rozanski, K. and Cohen, S. (2008) Isotope effects in the evaporation of water: A status report of the Craig-Gordon model. Isotopes in Environmental Health Studies, 44, 23-49. http://dx.doi.org/10.1080/10256010801887174
- Newman, B., Tanweer, A. and Kurttas, T. (2009) IAEA standard operating procedure for the liquid-water stable isotope analyser. http://www-naweb.iaea.org/napc/ih/documents/other/laser_procedure_rev12
- Revesz, K. and Woods, P.H. (1990) A method to extract soil water for stable isotope analysis. Journal of Hydrology, 115, 397-406. http://dx.doi.org/10.1016/0022-1694(90)90217-L
- Ehleringer, J.R. and Osmond, C.B. (1989) Stable isotopes. In: Pearcy, R.W., Ehleringer, J.R., Mooney, H.A. and Rundel, P.W., Eds., Plant Physiological Ecology: Field Methods and Instrumentation, Kluewer, London, 281. http://dx.doi.org/10.1007/978-94-009-2221-1_13
- Dalton, F.N. (1989) Plant root water extraction studies using stable isotopes. In: Loughman, B.C., Gasparikova, O., Kolek, J., Eds., Structural and Functional Aspects of Transport in Roots, Kluwer, Dordrecht, 151. http://dx.doi.org/10.1007/978-94-009-0891-8_29
- Ehleringer, J.R., Roden, J. and Dawson, T.E. (2000) In: Sala, O., Jackson, R., Mooney, H.A. and Howarth, R., Eds., Methods in Ecosystem Science, Springer, New York, 181. http://dx.doi.org/10.1007/978-1-4612-1224-9_13
- Goebel, T.S. and Lascano, R.J. (2012) System for high throughput water extraction from soil material for stable isotope analysis of water. Journal of Analytical Sciences, Methods and Instrumentation, 2, 203-207. http://dx.doi.org/10.4236/jasmi.2012.24031
NOTES
1Mention of trade names or commercial products in this publication is solely for the purpose of providing specific information and does not imply recommendation or endorsement by the US Department of Agriculture.