Food and Nutrition Sciences
Vol.4 No.6(2013), Article ID:33007,11 pages DOI:10.4236/fns.2013.46088
Combined Effect of Garlic Juice and Sa-Tay Marinade on Quality Changes of Oyster Meat during Chilled Storage
![]()
1Department of Food Technology, Faculty of Agro-Industry, Prince of Songkla University, Songkhla, Thailand; 2Aquatic Animal Biotechnology Research Center, Faculty of Science and Industrial Technology, Surat Thani Campus, Prince of Songkla University, Surat Thani, Thailand.
Email: *sunisa.s@psu.ac.th, sunisasiripongvutikorn@gmail.com
Copyright © 2013 Bunyarat Bunruk et al. This is an open access article distributed under the Creative Commons Attribution License, which permits unrestricted use, distribution, and reproduction in any medium, provided the original work is properly cited.
Received February 22nd, 2013; revised March 24th, 2013; accepted April 2nd, 2013
Keywords: Oyster Meat; Garlic Juice; Sa-Tay; Marinated
ABSTRACT
Traditionally, meat has been marinated to improve yield, flavor, tenderness, and may increase product shelf life. Sa-tay is a popular dish in Thai restaurant. Physical, chemical, microbiological and sensory qualities after the oyster meat treated with garlic 0, 2 ml of garlic juice then marinated with Sa-tay condiment (8%, wt/wt) were monitored during chilled storage, 4˚C ± 2˚C. pH and glycogen content of all treatments decreased while TVB, lactic acid content, ammonia content and K-value increased as storage time. A TBARS, rancidity indicator, of the control was higher compared with other treatments. Mesophilic and lactic acid bacteria of all treatments particularly the oyster treated with the juice increased as storage time increased. However, psychrophilic bacteria, coliforms, fecal coliforms, Escherichia coli, Staphylococcus aureus, Salmonella spp. and Vibrio spp. were low throughout the storage. Consumer acceptability scores of all treatments were higher than borderline (>5) at the end of the storage, 12 days.
1. Introduction
Oyster is one of the delicious, nutritious and may be the most expensive bivalve mollusks [1]. It is often eaten raw or lightly cooked, which leads to high risk to have direct implications for disease transmission since bivalve mollusks are filter-feeders that obtain food from the environment by filtering seawater through their gills [2,3]. The pathogenic bacteria, biological toxins and harmful chemicals which accumulate in the oyster are the results of limits of consumers’ safety. In addition, oyster is perishable product therefore qualities and economic losses are normally found and necessary to have a proper manage.
Marinating is a process which meat is soaked in marinade-ingredients prior to further process [4]. Marinade is a seasoned solution that serves as substances for meat to be soaked. It is commonly used to increase meat yield, improve meat flavor, tenderness and juiciness by increasing water holding capacity, lower cooking losses, resulted to extend the shelf life of meat [5]. Marinating can be performed through soaking, injection, or tumbling [6]. Generally, garlic is often used as a seasoning agent in marinated meat because of its possessed antibacterial activity leading to lower bacterial count [7]. Nurwantoro et al., [8] addressed that counts of E. coli, Salmonella, Staphylococcus, Streptococcus, Klebsiella, Proteus, Bacillus, Clostridium, and Heliobacter pylory were reduced when treated with garlic. And allicin is a majority active compound responsible for antibacterial action and typical smell of crushed garlic [9]. Pĕrez-Giraldo et al., [10] reported that allicin with concentration of 4 mg/ml could inhibit the formation of biofilms (bacterial capsules) nearly 50% cultures of S. epidermidis incubated 24 hours.
Sa-tay is a popular ordered dish for all age people in Thai restaurant or even street food shop due to its good smell, creamy, mild taste and extractive color as yellow or brow-yellow. Generally, the ingredients consist of turmeric rhizome, galangal rhizome and garlic bulb. However, the difference of ingredients in term of variety and quantity used in the recipe from home to home or region to region can be found [11]. Since some ingredients used in the Sa-tay have been reported that may contain antimicrobial, antioxidant and medicinal value [12] then the objective of this study was to determine the effect of garlic juice and Sa-tay marinade on physical, chemical and microbiological qualities and sensorial score of oyster meat during chilled storage.
2. Materials and Methods
2.1. Garlic Juice Preparation
The fresh garlic washed with tap water was blended with blender in a Philips HR-2068 blender (Thailand) before brought to blend with sterilized distilled water at a ratio of 1:3 (garlic:water) until it turn to be slurry.
2.2. Sa-Tay Marinade Preparation
The Sa-tay marinade included of brand curry powder 50%, garlic 25% and galangal 25%. The fresh garlic and galangal was blended with blender in a Philips HR-2068 blender (Thailand) before brought to blend with the curry powder and marinade with oyster meat for 30 min.
2.3. Oyster Preparation
The oyster meat was washed with tap water before divided into four groups as control sample and oyster meat treated with garlic juice 2 ml, garlic 2 ml + Sa-tay marinated 8% and Sa-tay marinated 8%, respectively. The marinated and un-marinated samples were subjected to analyze for physical, chemical and microbiological quailties and sensorial acceptability during chilled storage.
2.4. Physical Analysis
2.4.1. pH
Samples were blended with sterilized distilled water at a ratio of 1:5 (sample:water) and allowed to stand for 2 min before measuring their pH measured with a pH meter (Mettler 350, Singapore).
2.4.2. Color Value
Color of the marinated oyster meat was measured using a color meter (Hunter lab Universal Software). The color was expressed in L*, a*, and b* values, where L means degree of lightness of the samples and ranges from 0 - 100, a means redness to greenness (+ is red, − is green) and b means yellowness to blueness (+ is yellow, − is blue).
2.5. Chemical Analysis
2.5.1. Acidity
The method used to determine % lactic acid was based on Simsek et al., [13]. Five grams of oyster meat sample was blended and homogenized with 50 ml of distilled water. Then, 5 drops of 1% phenolphthalein were added and mixed. The samples were titrated with 0.1 M NaOH. The formula to calculate % lactic acid (LA) was as followed:
whereMolarity of NaOH = 0.1 Molecular mass of LA = 90.08
2.5.2. Determination of K-Value Using Ion Exchange Chromatography
K-value was determined using anion-exchange column chromatography [14]. A ground sample (1 g) was subjected to a serial extraction using 10% PCA and 5% PCA. The final extract (2 ml) was adjusted to pH 9.4 using 0.5 N NH3 (aq). The prepared extract (pH 9.4) was loaded onto an anion-exchange column (1 × 10 cm2) containing Resin-AG (R) 1-X4, 400 meshes Cl-form. The column was rinsed using deionised water (20 ml). The elution was performed using 45 ml of solution A (0.001 N HCl). The eluate was collected, and the volume was made up to 50 ml using solution A. Thereafter, the column was eluted with 45 ml of solution B (0.01 N HCl containing 0.6 M NaCl). The resulting eluate was made up to 50 ml using solution B. Both eluates were read at 250 nm using the corresponding eluent (solution A or B) as the blank. K-value was calculated as follows:
where A is A250 of eluate A representing the amount of inosine (HxR) and hypoxanthine (Hx), and B is A250 of eluate B representing the amount of ATP, ADP, AMP, and IMP.
2.5.3. Total Volatile Base (TVB)
Total volatile base (TVB) contents in the oyster meat were determined using the Conway micro-diffusion method as described by Conway and Byrne [15]. The sample, 2 g was mixed with 8 ml of 4% tricloroacetic acid (TCA) then homogenized at 6500 rpm for 1 min. The homogenate was filtered through Whatman No. 41 filter paper and the filtrate was used for analyses. Sample extract (1 ml) was placed in the outer ring. The inner ring solution (1% boric acid containing the Conway indicator) was then pipette into the inner ring. To initiate the reaction, K2CO3 (1 ml) was mixed with sample extract. The Conway unit was closed and incubated at room temperature for 90 min. The inner ring solution was then titrated with 0.02 N HCl until the green color turned to pink. TVB were released after addition of saturated and diffused into the boric acid solution. The titration of solution was performed and the amount of TVB was calculated.
2.5.4. Thiobarbituric Acid Reactive Substances (TBARS) Value
Ten-gram sample of oyster meat was blended with 50 ml distilled water for 2 min then transferred to a distillation tube. The cup used for blending was washed with an additional 47.5 ml of distilled water. This was added to a distillation tube containing 2.5 ml 4 N HCl and a few drops of antifoam agent. Five-ml of 0.02 M 2-thiobarbituric acid in 90% glacial acetic acid (called a TBA reagent) was added to a vial containing 5 ml of distillate and mixed well. The vials were capped and heated in boiling water for 30 minutes and cooled to room temperature. The absorbance was measured at 352 nm using a spectrophotometer [16].
2.5.5. Determination of Ammonia Content
Ammonia content was determined as described by Parris and Foglia [17]. Sample powder (10 g) was placed in a 600 ml round bottom flask containing 200 ml of distilled water; 10 g carbonate-free MgO and a few drops of antifoam. The mixture was distilled and the distillate 100 ml was collected in an erlenmeyer flask containing 20 ml of 0.1 N HCl. Collected distillate was titrated using 0.05 N NaOH and methyl red was used as an indicator. Ammonia content was calculated and expressed as mg/g sample.
2.5.6. Determination of Glycogen
Sample (50 mg) was boiled with 400 µl of 33% KOH for 20 min. After cooling 700 µl of 96% ethanol was added. The mixture was placed in an ice bath to allow the complete precipitation (~2 h). Thereafter, the mixture was centrifuged at 7500 ×g for 20 min and the supernatant was discarded. One ml of distilled water was added to the pellet, followed by sonication. Subsequently, 100 µl of sample solution was incubated at 90˚C in 2 ml of anthrone reagent (38 ml of concentrated sulphuric acid was added to 15 ml of distilled water and 0.075 g of anthrone) for 20 min in dark and the absorbance was read at 620 nm. Glycogen concentration was calculated from standard curve using glycogen from oyster (II) as standard [18].
2.6. Bacteriological Analysis
Total viable count, psychotrophic count, S. aureus, Salmonella spp., E. coli, Vibrio cholera, V. parahaemolyticus and V. vulnificus were determined as procedure of BAM [19,20]. Lactic acid bacteria were determined as procedure of De Man [21].
2.7. Sensory Evaluation
All treatments were baked with casserole electricity (House worth HW-1707S, China) at 180˚C for 5 minutes until the core temperature of the meat sample ranged of 80˚C ± 2˚C. The cooked samples were brought to serve to thirty panelists comprising post-graduate students and technicians from the Department of Food Technology, Prince of Songkla University. The panelists were asked to evaluate the attribute preferences as appearance color, flavor, taste, texture and overall of each sample using a nine-point hedonic scale, from “1-dislike extremely” to “9 like extremely”
2.8. Statistical Analyses
Data were subjected to Analysis of Variance (ANOVA) and mean comparison was performed using the Duncan’s New Multiple Range Test (DMRT). Statistical analyses were carried out using the SPSS statistical software version 6 (SPSS, Inc., Chicago, IL).
3. Results and Discussion
3.1. Physical Qualities
3.1.1. Change in pH Value
pH is a function of conversion of glycogen to lactic acid, acid and the degradation of muscle components e.g. proteins and nucleotides to amine compound, base, during storage meat. The initial pH value of the control samples was 6.57 and decreased to 5.6 during storage. Similar pH trends were found in the oyster meat treated with garlic 2 ml, garlic 2 ml + Sa-tay marinated 8% and Sa-tay marinated 8% which ranged from 5.54 to 6.54, 5.69 to 6.65 and from 5.78 to 6.69, respectively (Figure 1). This result was in agreement with the finding of Balasundari et al., [22] who reported that pH of Pacific oysters (Crassostrea gigas) decreased from 6.30 to 5.89 during storage at 5˚C for 18 days. A decrease of pH in oyster meat might be due to the relative high level of glycogen in the meat and the fact that the spoilage of mollusk shellfish was partly fermentative as reported by Cao et al. [23]. However, it was found that oyster meat marinated with Sa-tay marinated 8% (without injected with garlic juice) seemed to have higher pH value but not significant difference compared with other treatments. Hunter and Linden; Pottinger [24,25] also addressed the decreasing of pH as a
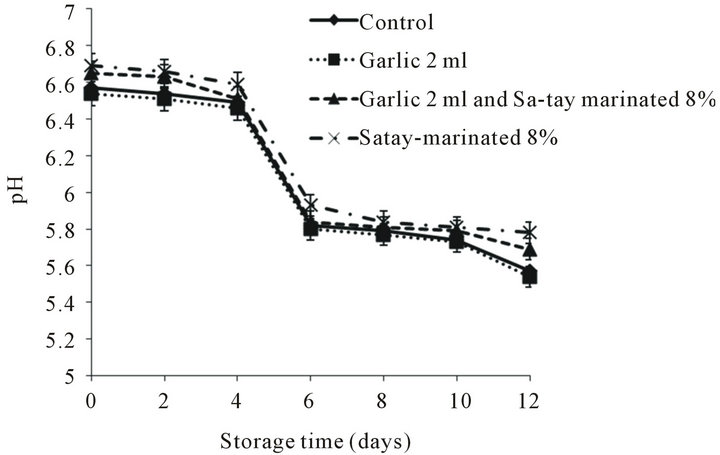
Figure 1. Effect of garlic juice and Sa-tay marinade on pH values of oyster meat during storage at 4˚C.
basis for determining microbial quality in oysters: pH 6.2 - 5.9 good, pH 5.8 “off”, pH 5.7 - 5.5 musty, pH 5.2 and below sour or putrid. Therefore, pH of all treatments in this present studied around 5.5 - 5.8 could be classified as fair.
3.1.2. Color
Three color parameters, lightness (L*), redness (a*) and yellowness (b*), were showed in Figure 2. L* of all treatments decreased with increased storage time and the lowest values of L* was found in the meat treated with garlic juice (Figure 2(a)). This may be due to an increase binding reaction of myoglobin and myofibrillar protein in muscle structure led to the decreased lightness [26]. Moreover, as the pH drop the myoglobin began to unfold, while the myofibrillar proteins were accumulating like charges causing repulsion in the myofibrillar proteins allowed light to be absorbed easily giving the appearance of dark color meat [27-31]. Many researchers reported that negative color attributes have been observed using lactic acid in marinades, turning the meat a dark gray or gray-brown color [32,33]. In addition, there were some fluctuation in the redness, a* value during chilled storage (Figure 2(b)) except the oyster meat treated with garlic juice that tended to decreased as storage time increased. This may due to greenish or blue-green color of garlic juice containing organosulfur compound reacted with amino acid in garlic and/or oyster meat [34].
There were 2 trends of b* value changes during storage as a decrease group and constancy group as shown in Figure 2(c). The yellowness of marinated oyster meat was a function of Sa-tay condiment containing turmeric rhizome powder [35].
3.2. Chemical Qualities
3.2.1. Lactic Acid Content
Initial of lactic acid content was about 0.03% - 0.17% (Figure 3) and these values also correlated significantly to pH change during chilled storage (Figure 1). It meant that an increase of lactic content caused a decrease of pH. Moreover, lactic acid content in the oyster meat treated with garlic juice was highest may be explained that besides the combined effect of glycolysis pathway and fermentation of lactic acid bacteria [36], garlic juice may also play a role to enhance lactic acid bacterial growth as it’s containing prebiotic compound [37,38]. On the other hand, oyster meat marinated with the Sa-tay had lower lactic acid content compared with un-marinated sample. This may be due to anti-lactic bacteria property and/or dehydrated condition when the oyster meat marinated with Sa-tay paste.
3.2.2. K-Value
Initial K-value of all treatments was around 11.53% -
 (a)
(a)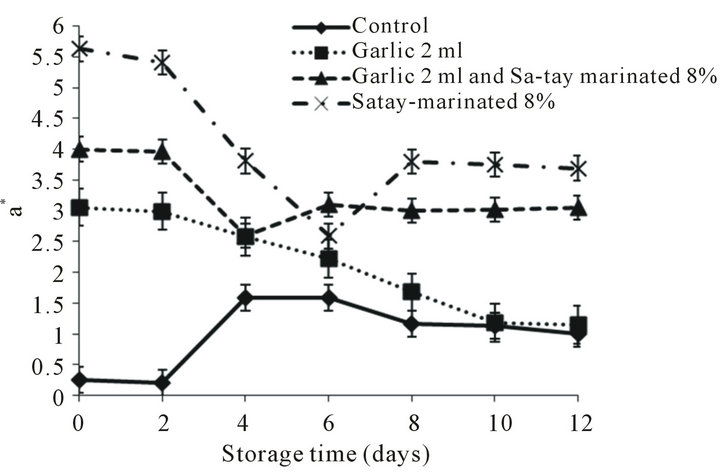 (b)
(b)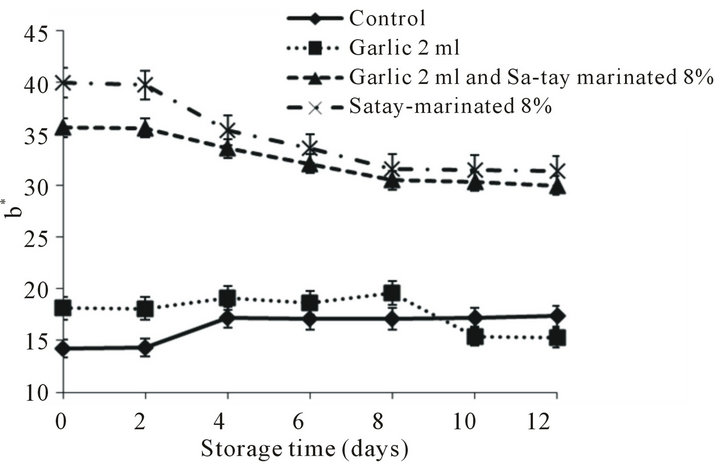 (c)
(c)
Figure 2. Effect of garlic juice and Sa-tay marinade on color L*, a* and b* values of oyster meat during storage at 4˚C. (a): L*value, (b): a* value, (c): b*value.
15.38%. As storage time increased K-value increased (Figure 4). However, the oyster meat treated with garlic 2 ml had the higher K-value at the end of storage, 12 days. Pacheco-Aguilar et al., [39] reported that final Kvalue of shrimp meat was 50.7% after storage in ice for 15 days. Lakshmanan et al., [40] reported K-value of fishes vary with species, with threadfin bream having Kvalue of 35% as limit of acceptability [41] while Catla have a acceptability limit when K-value of 55% was ob-

Figure 3. Effect of garlic juice and Sa-tay marinade on lactic acid content in oyster meat during storage at 4˚C.
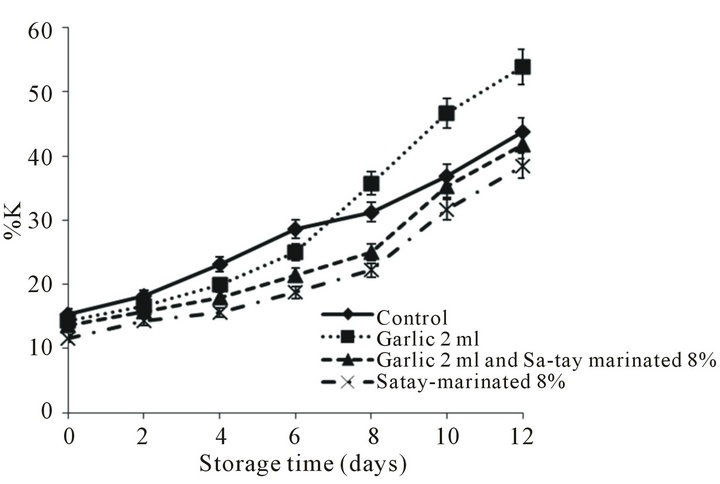
Figure 4. Effect of garlic juice and Sa-tay marinade on K value in oyster meat during storage at 4˚C.
tained. Lakshmanan et al., [40] reported a K-value of 53% for Labeo rohita as limit of acceptability, while for Scophthalmus maximus a K-value of 75% - 85% was considered as the limit of acceptability [42]. K-value of 20% is generally regarded as the optimum freshness limit of shrimp, while 60% is considered as the rejection point [43]. Therefore, based on K-value of 60% it was found that oyster-injected with the garlic juice 2 ml had shorter shelf-life compared with other treatments. The faster nucleotide degradation of oyster-injected with the juice determined by K-value may cause by activity of lactic acid bacteria.
3.2.3. Total Volatile Base Nitrogen Value
TVB, which comprised the volatile amines (mainly dimethylamine, trimethylamine and ammonia) of all treatments increased as increased storage time as shown in Figure 5 even it was lower 30 mg N/100 g which was considered to be unfit for human consumption [44-46]. Such a lower level, ≤20 mg/100 g, in the oyster meat may be due to high content of glycogen that undergoes general acidication as fermention of lactic acid. How-
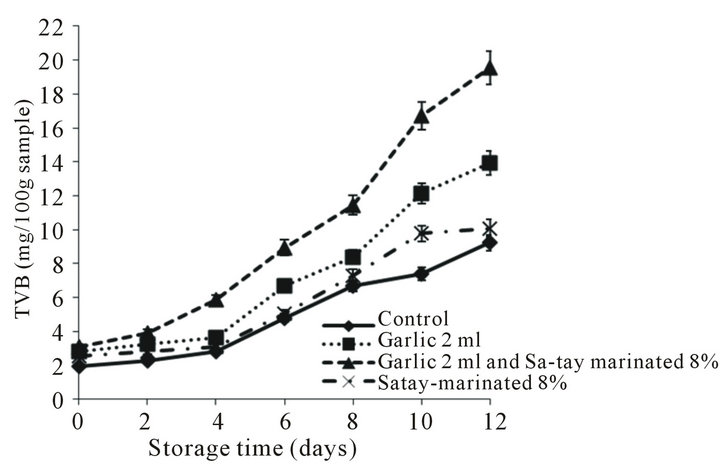
Figure 5. Effect of garlic juice and Sa-tay marinade on total volatile base nitrogen (TVB) values in oyster meat during storage at 4˚C.
ever, TVB value was highest in the oyster meat injected with garlic juice and marinated with Sa-tay may be due to fault positive reaction in the Conway method used. This experiment agreed with [47] who first reported that TVB of nugget salmon with added pepper-garlic was higher than control sample due to sulfur compound (basic compound) derived from garlic reacted with boric acid led to higher volume of HCl. And it was proved that the garlic juice had high TVB value meant it contained volatile base compound (data not showed) when determined by Conway assay. Therefore, TVB value may not a good indicator for quality determining of marinated food or food containing garlic or volatile base stuff.
3.2.4. TBARS Values
The TBARS values indicate the content of secondary lipid oxidation products, mainly aldehydes (or carbonyls), which contribute to off-flavors in oxidized meat and meat product [47]. The effect of the garlic juice and Satay marinade on the lipid oxidation evaluated as TBARS values of oyster meat refrigerated for 12 days was shown in Figure 6. The TBARS values increased in all treatments over time particularly in the control sample. However, the TBARS values of oyster treated with garlic juice and Sa-tay marinade were lower than control sample (p < 0.05). This may be due to antioxidant property of sulfur compounds derived garlic [47,48] and curcuminoid derived from turmeric rhizome [49].
3.2.5. Ammonia Content
Ammonia contents of oyster meat with during refrigerated storage were depicted in Figure 7. Ammonia content of all samples increased, particularly in the oyster meat injected with garlic juice when storage time increased. An increase was noticeable during 8 - 12 days of storage. Paarup et al., [50] reported that increasing of ammonia contents of squids was also found at day 16 of storage. Ammonia is derived from both enzymatic (en-
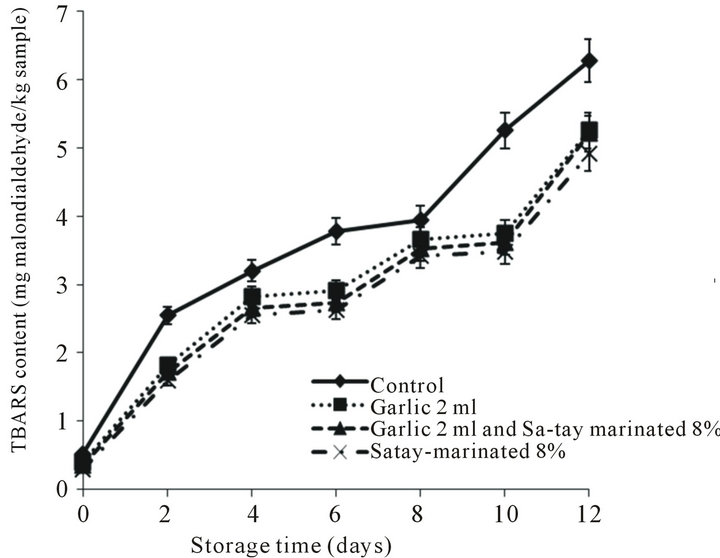
Figure 6. Effect of garlic juice and Sa-tay marinade on 2-thiobarbitulic acid reactive substances (TBARS) values in oyster meat during storage at 4˚C.
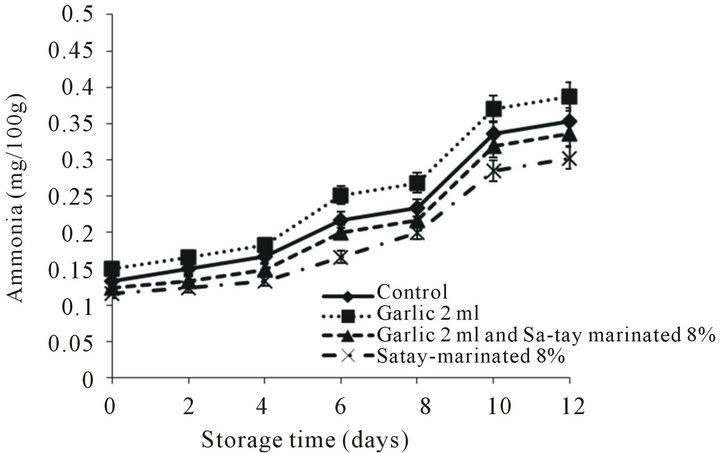
Figure 7. Effect of garlic juice and Sa-tay marinade on ammonia values in oyster meat during storage at 4˚C.
dogenous and exogenous enzyme) determination of free amino acids or from decomposition of nucleic bases [51]. Since the distillation method was used in this present study for ammonia determination, the cleavage of amino groups in the proteins at high temperature and alkaline pH might occur. Moreover, all volatile amines might be co-distilled with ammonia, possibly leading to the overestimated ammonia content.
3.2.6. Glycogen Content
Glycogen has served as the indicator of the reproduction-cycle, as glycogen is the energy source of oyster during the proliferation of sex cells [52]. The content of glycogen varies remarkably during the reproduction-cycle. For instance, oysters cultured in Cork Harbour, Ireland, begin to store glycogen in winter, reaching the maximum in spring and decreasing to the minimum at the end of the reproductive cycle in summer or autumn [53]. The initial glycogen content of all treatment was around 6.39 - 6.49 mg/100 g dw and gradually decreased in the first four days then sharply declined afterward (Figure 8). Comparing pH, lactic acid content, K-value and glycogen content meant that injecting garlic juice into to the oyster meat seemed to accelerate the spoilage which was not expectation of using garlic juice as antibacterial agent.
3.3. Microbiological Quality
Mesophilic and lactic acid bacteria of all treatment was around 1.04 ± 0.02 - 2.75 ± 0.04 log cfu/g, and 1.07 ± 0.03 - 1.72 ± 0.04 log cfu/g, respectively and gradually increased as increased storage time (Table 1). However, it was found that the oyster meat injected with garlic juice without Sa-tay marinating was highest in the both bacterial count. It confirmed that garlic juice played a key role for lactic acid bacterial growth. However, psychrophilic, coliforms, fecal coliforms, E. coli, S. aureus, Salmonella spp. and Vibrio spp. were low throughout the storage as showed in Table 1.
3.4. Sensory Quality
The sensorial scores of the treatment such as appearance, color, texture, flavor and overall during storage were shown in Table 2. It was found that all sensory attributes of all oysters slightly decreased but still higher than 5 which was considered as off stage. Surprising, even garlic juice seemed to cause faster spoilage determined by physical (pH), chemical (TVB, ammonia, K-value), microbiological aspects (TVC, lactic acid bacteria counts), there was no negative result on consumer acceptability particularly when using Sa-tay as a marinade agent brought higher sensorial scores compared with un-marinated.
4. Conclusion
According to the results of this study, it was found that treated oyster meat with garlic juice pronounced more TVB, ammonia content and increased K-value, TVC,
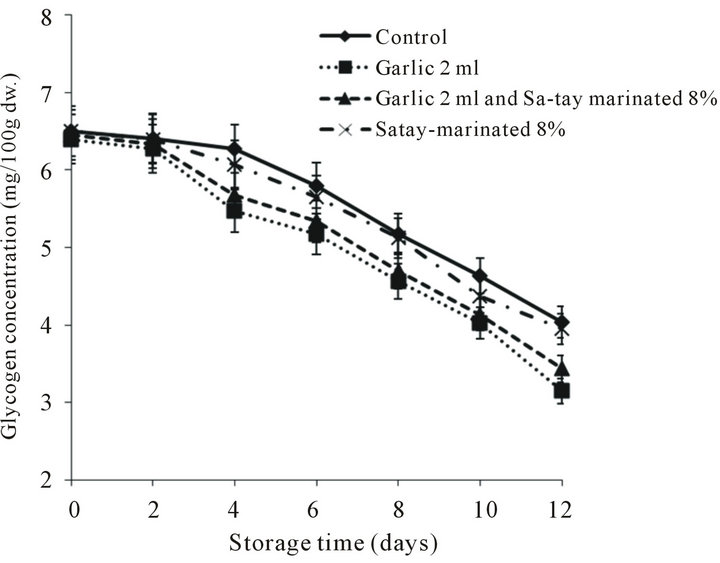
Figure 8. Effect of garlic juice and Sa-tay marinade on glycogen content in oyster meat during storage at 4˚C.
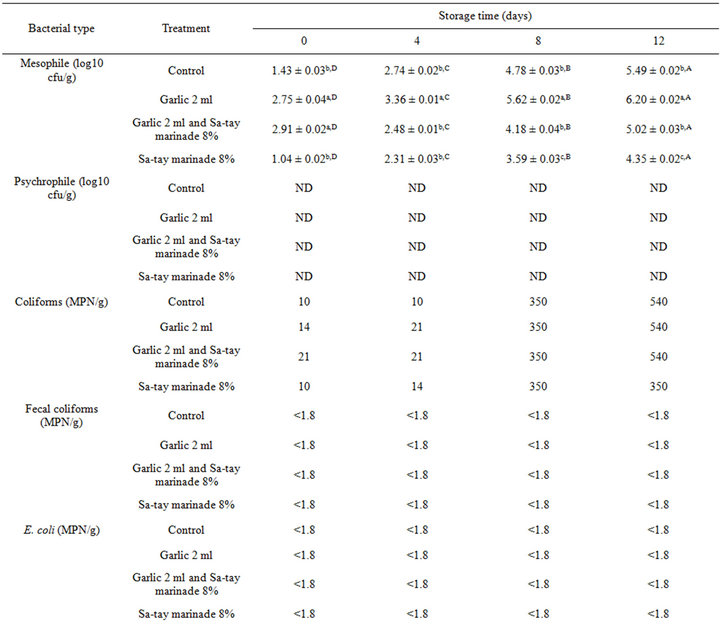
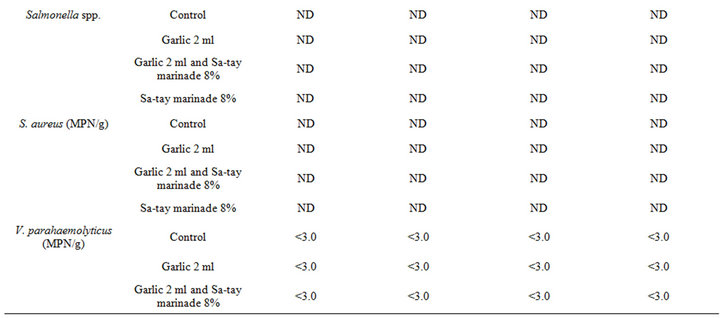
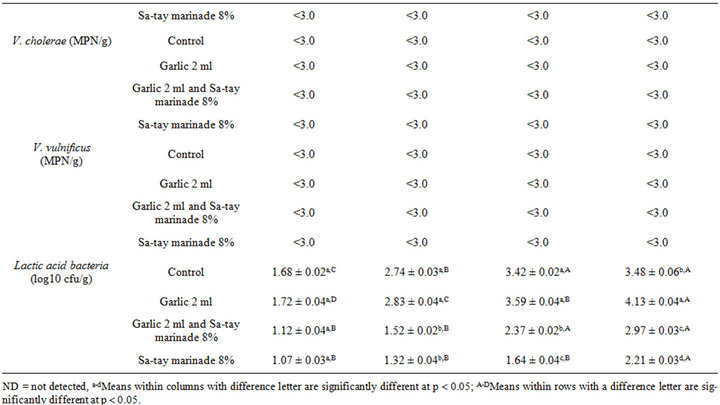
Table 1. Effect of garlic juice and Sa-tay marinade 8% on microorganism values in oyster meat during storage at 4˚C.
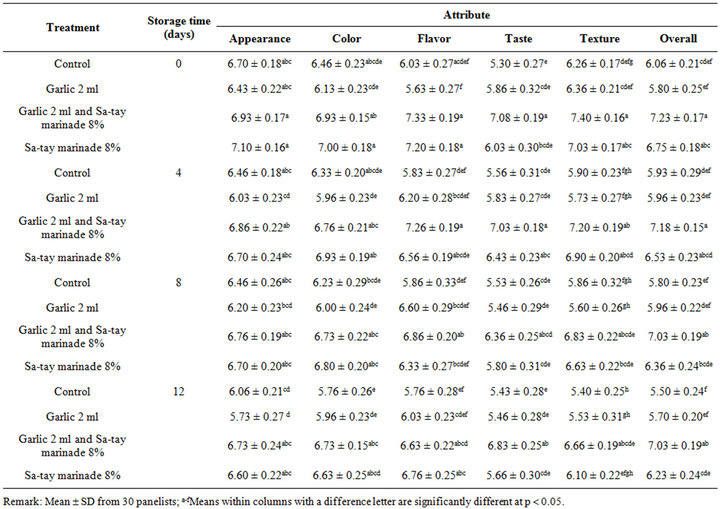
Table 2. Effect of garlic juice and Sa-tay marinade 8% on consumer acceptability in oyster meat during storage at 4˚C.
lactic acid bacteria. However, garlic juice did not have a negative effect on consumer acceptability whether with or without Sa-tay marinade. Moreover, using Sa-tay as a marinade agent brought higher sensorial scores compared with un-marinated. Therefore, it was clearly showed that marinade Sa-tay can be used for new value added product and as natural preservative agent. However, negative results of using garlic juice as activated K-value and TVC count as well as type of lactic acid bacteria would be further investigated.
5. Acknowledgments
This research was financial supported by Aquatic Animal Biotechnology Research Center, and Prince of Songkla University, Surat Thani Campus, 2011, and Graduate School of Prince of Songkla University, Hat-Yai campus.
REFERENCES
- S. Bussarawit and V. Simonsen, “Genetic Variation in Populations of White Scar (Crassostrea belcheri) and black scar (C. iredalei) along the Coast of Thailand by Means of Isozymes,” Phuket Marine Biology Center Research Bulletin, Vol. 67, No. 67, 2006, pp. 11-21.
- M. Jakabi, D. S. Gelli, J. C. M. D. Torre, M. A. B. Rodas, B. D. G. M. Franco, M. T. Destro and M. Landgraf, “Inactivation by Ionizing Radiation of Salmonella Enteritidis, Salmonella Infantis, and Vibrio parahaemolyticus in oysters (Crassostrea brasiliana),” Journal of Food Protection, Vol. 66, No. 6, 2003, pp. 1025-1029.
- J. K. Lee, D. W. Jung, S. Y. Eom, S. W. Oh, Y. Kim, H. S. Kwak and Y. H. Kim, “Occurrence of Vibrato parahaemolyticus in Oysters from Korean Retail Outlets,” Food Control, Vol. 19, No. 10, 2008, pp. 990-994. doi:10.1016/j.foodcont.2007.10.006
- D. P. Smith and L. L. Young, “Marination Pressure and Phosphate Effects on Broiler Breast Fillet Yield, Tenderness, and Color,” Poultry Science, Vol. 86, No. 12, 2007, pp. 2666-2670. doi:10.3382/ps.2007-00144
- C. Z. Alvarado and A. R. Sams, “Injection Marination Strategies for Remediation of Pale, Exudative Broeler Breast Meat,” Department of Poultry Science, Vol. 82, No. 8, 2003, pp. 1332-1336.
- C. Z. Alvarado and S. McKee, “Marination to Improve Functional Properties and Safety of Poultry Meat,” Department of Animal and Food Sciences Vol. 16, No. 1, 2007, pp. 113-120.
- L. P. Ress, S. F. Minney, N. T. Plummer, J. H. Slater and D. A. Skyrme, “A Quantitative Assesment of the Antimicrobial Activity of Garlic (Allium sativum),” World Journal of Microbiology and Biotechnology, Vol. 9, No. 3, 1993, pp. 303-307. doi:10.1007/BF00383068
- V. Nurwantoro, P. Bintoro, A. M. Legowo, L. D. Ambara, A. Prakoso, S. Mulyani and A. Purnomoadi, “Microbiological and Physical Properties of Beef Marinated with Garlic Juice,” Journal of the Indonesian Tropical Animal Agriculture, Vol. 36, No. 3, 2011, p. 3.
- D. C. Maidment, J. Z. Dembny and D. I. Watts, “The AntiBacterial Activity of 12 Alliums against Escherichia coli,” Food Science and Nutrition, Vol. 31, No. 4, 2001, pp. 238-241. doi:10.1108/EUM0000000005614
- C. Pĕrez-Giraldo, G. Cruz-Villalón, R. Sánchez-Silos, R. Martínez-Rubio, M. T. Blanco and A. C. Gómez-Garcia, “In vitro Activity of Allicin against Staphylococcus epidermidis and Influence of Subinhibitory Concentrations on Biofilm Formation,” Journal of Applied Microbiology, Vol. 95, No. 4, 2003, pp. 709-711. doi:10.1046/j.1365-2672.2003.02030.x
- S. Siripongvutikorn, N. Pengseng, S. Ayusak and W. Usawakesmanee, “Development of Green Curry Paste Marinade for White Shrimp (Litopenaeus vannamei). Songklanakarin,” Journal of Science and Technology, Vol. 30, No. 1, 2008, pp. 35-40.
- S. Ankri and D. Mirelman, “Antibicrobial Properties of Allicin from Garlic,” Microbes and Infection, Vol. 1, No. 2, 1999, pp. 125-129. doi:10.1016/S1286-4579(99)80003-3
- B. Simsek, O. Sagdic and S. Ozcelik, “Survival of Escherichia coli O157:H7 during the Storage of Ayran Produced with Different Spices,” Journal of Food Engineering, Vol. 78, No. 2, 2007, pp. 676-680. doi:10.1016/j.jfoodeng.2005.11.005
- H. Uchiyama and K. Kakuba, “A Simple and Rapid Method for Measuring K-Value, a Fish Freshness Index,” Bulletin of the Japanese Society of Scientific Fisheries, Vol. 50, No. 2, 1984, pp. 263-267. doi:10.2331/suisan.50.263
- E. J. Conway and A. Byrne, “An Absorption Apparatus for the Micro-Determination of Certain Volatile Substances I,” The micro-determination of ammonia. Journal of Biochemistry, Vol. 27, No. 2, 1936, pp. 419-429.
- P. Fernandez-Lopez, C. Sanchez, R. Batlle and C. Nerin, “Solid and Vapour Phase Antimicrobial Activities of Six Essential Oils: Susceptibility of Selected Food Borne Bacterial and Fungal Strains,” Journal of Agricultural and Food Chemistry, Vol. 53, No. 17, 2005, pp. 6939-6946. doi:10.1021/jf050709v
- N. Parris and T. A. Foglia, “Simplified Alcoholic Extraction Procedure for Ammonia in Meat Tissue,” Journal of Agricultural and Food Chemistry, Vol. 31, No. 4, 1983, pp. 887-889. doi:10.1021/jf00118a054
- R. Rosa and M. L. Nunes, “Tissue Biochemical Composition in Relation to the Reproductive Cycle of Deep-Sea Decapod Aristeus antennatus in the Portuguese South Coast,” Journal of the Marine Biological Association of the United Kingdom, Vol. 83, No. 5, 2003, pp. 963-970. doi:10.1017/S0025315403008154h
- US Department of Health and Human Service, US Food and Drug Administration, Center of Food Safety and Applied Nutrition, “Bacteriological Analytical Manual,” 2011.
- US Department of Health and Human Service, US Food and Drug Administration, Center of Food Safety and Applied Nutrition, “Bacteriological Analytical Manual,” 2002.
- J. M. De Man Rogosa and M. E. Sharpe, “A Medium for the Cultivation of Lactobacilli,” Journal of Applied Bacteriology, Vol. 23, No. 1, 1960, pp. 130-135. doi:10.1111/j.1365-2672.1960.tb00188.x
- S. Balasundari, J. Abraham, S. A. Shanmugam and G. Indra Jasmine, “Frozen Storage Performance of Edible Oyster Crassostrea madrasensis (Preston),” Journal of Food Science and Technology, Vol. 34, No. 5, 1997, pp. 434- 436.
- C. Q. Cao, G. D. Love, L. E. Hays, W. Wang, S. Z. Shen and R. E. Summons, “Biogeochemical Evidence for Euxinic Oceans and Ecological Disturbance Presaging the End-Permianmass Extinction Event Earth Planet,” Journal of Materials Science Letters, Vol. 281, No. 3-4, 2009, pp. 188-201.
- A. C. Hunter and B. A. Linden, “An Investigation of Oyster Spoilage,” Journal of the American Chemical Society,” Vol. 18, No. 11, 1923, pp. 538-540.
- S. R. Pottinger, “Some Data on pH and the Freshness of Shucked Eastern Oysters Comm,” Fisheries Research, Vol. 10, No. 9, 1948, pp. 1-3.
- Y. J. Kim, S. K. Jin, W. Y. Park, B. W. Kim, S. T. Joo and H. S. Yang, “The Effect of Garlic or Onion Marinade on the Lipid Oxidation and Meatquality of Pork during Cold Storage,” Journal of Food Quality, Vol. 33, No. S1, 2010, pp. 171-185. doi:10.1111/j.1745-4557.2010.00333.x
- A. B. Saunders, “The Effect of Acidification on Myofibrillar Proteins,” Meat Science, Vol. 37, No. 2, 1994, pp. 271-280. doi:10.1016/0309-1740(94)90086-8
- G. Offer and J. Trinick, “On the Mechanism of Water Holding in Meat. The Swelling and Shrinking in Meat,” Meat Science, Vol. 8, No. 4, 1983, pp. 245-281. doi:10.1016/0309-1740(83)90013-X
- N. Aktas, M. I. Aksu and M. Kaya, “The Effect of Organic Acid Marination on Tenderness, Cooking Loss and Bound Water Content of Beef,” Journal of Muscle Foods, Vol. 14, No. 3, 2003, pp. 181-194. doi:10.1111/j.1745-4573.2003.tb00699.x
- M. Serdaroglu, K. Abdraimov and A. Onenc, “The Effects of Marinating with Citric Acid Solutions and Grapefruit Juice on Cooking and Eating Quality of Turkey Breast,” Journal of Muscle Foods, Vol. 18, No. 2, 2007, pp. 162- 172. doi:10.1111/j.1745-4573.2007.00074.x
- R. M. Burke and F. J. Monahan, “The Tenderisation of Shin Beef Using a Citrus Juice Marinade,” Meat Science, Vol. 63, No. 2, 2003, pp. 161-168. doi:10.1016/S0309-1740(02)00062-1
- J. T. Sawyer, J. K. Apple and Z. B. Johnson, “The Impact of Lactic Acid Concentration and Sodium Chloride on pH, Water-Holding Capacity, and Cooked Color of InjectionEnhanced Dark-Cutting Beef,” Meat Science, Vol. 79, No. 2, 2008, pp. 317-325. doi:10.1016/j.meatsci.2007.10.016
- J. T. Sawyer, J. K. Apple, Z. B. Johnson, R. T. Baublits, and J. W. S. Yancey, “Fresh and Cooked Color of DarkCutting Beef Can Be Altered by Post-Rigor Enhancement with Lactic Acid,” Meat Science, Vol. 83, No. 2, 2009, pp. 263-270. doi:10.1016/j.meatsci.2009.05.008
- I. Shinsuke, K. Akita, T. Muneaki and S. Hiroshi, “Identification of Two Novel Pigment Precursors and a ReddishPurple Pigment Involved in the Blue-Green Discoloration of Onion and Garlic,” Journal of Agricultural and Food Chemistry, Vol. 54, No. 3, 2006, pp. 843-847. doi:10.1021/jf0519818
- V. Badmaev, M. Majeed and L. Prakash, “Curcuminoids: Bioactive Compounds from Turmeric,” Sabinsa Corporation, Windsor, 2004.
- J. Aarnikunnas, “Metabolic Engineering of Lactic Acid Bacteria and Characterization of Novel Enzymes for the Production of Industrially Important Compounds,” Department of Basic Veterinary Sciences Division of Microbiology and Epidemiology University of Helsinki, Helsinki, 2006.
- A. J. Moshfegh, J. E. Friday, J. P. Goldman and J. K. Ahuja, “Presence of Inulin and Oligofructose in the Diets of Americans,” Journal of Nutrition, Vol. 129, No. 7, 1999, pp. 1407-1411.
- G. R. Gibson and R. A. Rastall, “Prebiotics: Development and Application,” In: L. V. Claire, A. R. Bodun and G. R. Gibson, Eds., Human Colonic Microbiology and the Role of Dietary Intervention: Introduction to Prebiotics,” John Wiley and Sons, Inc., London, 2006, pp. 11-39.
- R. Pacheco-Aguilar, M. E. Lugo-Sanchez and M. R. Robles-Burgueno, “Postmortem Biochemical Characteristic of Monterey Sardine Muscle Stored at 0˚C,” Journal of Food Science, Vol. 65, No. 1, 2000, pp. 40-47. doi:10.1111/j.1365-2621.2000.tb15953.x
- P. T. Lakshmanan, P. D. Antony and K. Gopakumar, “Nucleotide Degradation and Quality Changes in Mullet (Liza corsula) and Pearlspot (Etroplus suratensis) in Ice and at Ambient Temperatures,” Food Control, Vol. 7, No. 6, 1996, pp. 227-283. doi:10.1016/S0956-7135(96)00015-1
- J. Yongswawatdigul and J. W. Park, “Biochemical and Conformation Changes of Actomyosin from Threadfin Bream Stored in Ice,” Journal of Food Science, Vol. 67, No. 3, 2002, pp. 895-990. doi:10.1111/j.1365-2621.2002.tb09440.x
- Y. Ozogul, G. Ozyurt, F. Ozogul, E. Kuley and A. Polat, “Freshness Assessment of European Eel (Anguilla anguilla) by Sensory, Chemical and Microbiological Methods,” Food Chemistry, Vol. 92, No. 4, 2005, pp. 745-751. doi:10.1016/j.foodchem.2004.08.035
- S. Ehira, “Biochemical Study on the Freshness of Fish,” Bulletin of Tohoku Regional Fisheries Research Laboratory, Vol. 88, No. 1, 1976, pp. 1-5.
- A. El-Marrakchi, B. Bennour, N. Bouchriti, A. Hamama and H. Tagafait, “Sensory, Chemical, and Microbiological Assessments of Moroccan Sardines (Sardina pilcharddus) Stored in Ice,” Journal of food protection, Vol. 53, No. 7, 1990, pp. 600-605.
- S. Harpaz, L. Glatman, V. Drabkin and A. Gelman, “Effects of Herbal Essential Oils Used to Extend the Shelf Life of Fresh Water Reared Asian Sea Bass Fish (Lates calcarifer),” Journal of Food Protection, Vol. 66, No. 3, 2003, pp. 410-417.
- C. Pakawatchai, S. Siripongvutikorn and W. Usawakesmanee, “Effect of Herb and Spice Pastes on the Quality Changes in Minced Salmon Flesh Waste during Chilled Storage,” Asian Journal of Food and Agro-Industry, Vol. 2, No. 4, 2009, pp. 481-492.
- T. Juntachote, E. Berghofer, S. Siebenhandl and F. Bauer, “The Antioxidative Properties of Holy Basil and Galangal in Cooked Ground Pork,” Meat Science, Vol. 72, No. 3, 2006, pp. 446-456. doi:10.1016/j.meatsci.2005.08.009
- G. C. Yang, P. M. Yasaei and S. W. Page, “Garlic as Anti-Oxidants and Free Radical Scavengers,” Journal of Food and Drug Analysis, Vol. 1, No. 4, 1993, pp. 357- 364.
- S. Li, W. Yuan, G. Deng, P. Wang, P. Yang and B. B. Aggarwal, “Chemical Composition and Product Quality Control of Turmeric (Curcuma longa L.) Pharm,” Crop Science, Vol. 2, No. 29, 2011, pp. 28-54.
- T. Paarup, J. A. Sanchez, A. Moral, H. Christensen, M. Bisgaard and L. Gram, “Sensory, Chemical and Bacteriological Changes during Storage of Iced Squid (Todaropsis eblanae),” Journal of Applied Microbiology, Vol. 92, No. 5, 2002, pp. 941-950. doi:10.1046/j.1365-2672.2002.01604.x
- Y. Huang, K. Kouadio and K.W. Gates, “Effect of Packaging on Chemical Changes and Quality of Refrigerated Spot (Leiostomus xanthurus),” Journal of Aquatic Food Product Technology, Vol. 1, No. 2, 1993, pp. 111-127. doi:10.1300/J030v01n02_10
- P. S. Galstoff, “The Amencan Oyster Crassostrea virginica Gmelln Fish,” USA Bulletins, Vol. 64, No. 1, 1964, pp. 1-480.
- L. G. Linehan, T. P. O’connor and G. Burnell, “Seasonal Variation in the Chemical Composition and Fatty Acid Profile of Pacific Oysters (Crassostrea gigas),” Food Chemistry, Vol. 64, No. 2, 1999, pp. 2111-2214. doi:10.1016/S0308-8146(98)00144-7
NOTES
*Corresponding author.