Food and Nutrition Sciences
Vol.3 No.12(2012), Article ID:25295,9 pages DOI:10.4236/fns.2012.312221
The Application of the Korean Dietary Pattern Score; KNHANES (Korean National Health and Nutrition Examination Survey) 2007
![]()
Department of Nutrition Science and Food Management, Ewha Womans University, Seoul, South Korea.
Email: *misocho@ewha.ac.kr
Received October 8th, 2012; revised November 8th, 2012; November 25th, 2012
Keywords: Korean Dietary Pattern; Korean Dietary Index; Korean Dietary Pattern Score (KDPS); Korean-Style MealScore (KSMS); Food Group Score (FGS)
ABSTRACT
The aim of this study was to apply the Korean Dietary Pattern Score (KDPS) to Korean subjects based on traditional Korean-style meals. The KDPS is based on the 3-Chup Bansang (the traditional Korean daily table setting) and considers the intake of 6 major food groups according to the Korean Dietary Reference Intakes (KDRIs). The KDPS consists of 2 parts: the Korean-Style Meal Score (KSMS) and the Food Group Score (FGS). The KDPS was applied dietary data collected during the Korean National Health and Nutrition Examination Survey (KNHANES) in 2007. Socio-demographic status, gender, age, and body mass index are all factors that have been shown to be meaningful predictors for the KDPS. When the effect of the KDPS on risk of disease was evaluated, a higher total KDPS was associated with a decreased risk of elevated systolic blood pressure (p < 0.05) and hypercholesterolemia (p < 0.05). In addition, as the KSMS increased, the risk of central obesity (p < 0.05) and hypertension (p < 0.01) significantly decreased. A higher total KDPS suggests a greater diversity of food intake, and therefore greater dietary diversity appears to lower the risk of disease. The KDPS is relevant because it integrates scores for Korean-style meal patterns and meal evaluation from a nutritional perspective. In conclusion, the KDPS is appropriate for evaluating the quality of diet, adherence to Koreanstyle meal patterns, and risk of related diseases. These results will be useful for evaluating the nation’s dietary patterns, nutrition, and health status when planning nutrition policies and programs.
1. Introduction
Diet patterns often reflect the attributes of a region’s culture; a wide range of studies of diet patterns, including Mediterranean diets, are being conducted. Most studies investigating the relationship between diet and disease have been based on nutrient composition or food intake [1-4]. However, there is a growing understanding of the multidimensional aspects that influence chronic or metabolic diseases, and new approaches have centered on dietary patterns that comprehensively consider the individual nutrients and the effects of food [5-7]. The Mediterranean diet is believed to be a healthy diet. Nutrient studies, epidemiologic studies, and clinical trials indicate that the Mediterranean diet lowers the risk of chronic disease [8,9]. Accordingly, it is widely recommended as a healthy dietary pattern model to improve the quality of life [10,11].
The traditional Korean diet pattern has changed considerably in recent times due to social, cultural, and economic changes. The Korean diet has transformed into more complex and varied forms [12]. Typical traditional Korean food includes a carbohydrate-based food as the main dish, and side dishes in which proteins, vitamins, minerals, and fats are evenly included. Traditional Korean diet is effective for preventing non-communicable diseases due to the balance between vegetables (including seaweed) and meat [13-15]. The Korean diet, like the Mediterranean diet, has attributes that can reduce the risk of obesity and chronic diseases. Nonetheless, there are insufficient data available on the health benefits of Korean food. The purpose of this study was to develop and apply a new indicator, based on the 3-Chup Bansang (the traditional Korean daily table setting; “Chup” is Korean for side dish), for adherence to traditional Korean meal patterns in Korea. This study will complement previous nutrient epidemiological research on the features of Korean dietary patterns.
2. Subjects and Methods
2.1. Data and Procedure
This study selected and analyzed data from the KNHANES 2007 for 2278 respondents (912 males and 1366 females) aged more than 20 years who participated in a 24-h recall survey and health screening survey.
The gender, age, level of education, and personal income were studied from a sociological point of view. Gender was classified as male or female. Age was classified into 6 groups: 20 - 29 years, 30 - 39 years, 40 - 49 years, 50 - 59 years, 60 - 69 years, and >70 years. Level of education was categorized as below elementary school, middle-high school graduate, and university level. Level of personal income was categorized into 4 groups, following the classification system used in the KNHANES 2007.
Body mass index (BMI; kg/m2) was categorized into 5 groups: <18.0, 18.0 - 22.9, 23.0 - 24.9, 25.0 - 29.9, and > 30.0. For the nutrient analysis, those who took vitamins/ minerals and those who did not were analyzed as 2 separate groups.
2.2. Korean Dietary Pattern Score (KDPS) Components and Scoring
KDPS is based on the 3-Chup Bansang (the traditional Korean daily table setting) (Figure 1) and the Korean Dietary Reference Intakes. The KDPS consists of 13 components (Table 1), and each component scores up to 10 points, resulting in a total possible score of 130 points. The Korean-Style Meal Score (KSMS) comprised components 1 - 7, and assessed dietary balance based on the 3-Chup Bansang; i.e., rice, soup, kimchi, soy sauce, raw vegetables, a grilled dish, a stewed dish, and a dried side dish. The scoring of KSMS is based on 3 meals a day for each component, and the criteria are as follows: 10 points if the dish item in each component is consumed 3 or more times; 7 points if consumed 2 times; 4 points if consumed once; and 1 point if consumed 0 times. The Food Group Score (FGS) comprised components 8 - 13 and measured adherence to the intake of the 6 major food groups based on the recommended serving size for Koreans; i.e., grains, meats, vegetables, fruits, milk, and oils. The FGS was scored based on the degree of compliance with the recommended individual serving size. For the grains, meats, and oils, the scoring based on consumption was as follows: if “the recommended individual serving size ±10%” was consumed, then full points were given; if not consumed at all or if more than 200% of the recommended individual serving size was consumed, then 0 points were scored; and in-between consumption were given proportional scores. For fruits, vegetables, and milk, if the consumption was more than the recommended individual serving size ±10%, full points were scored, and if less was consumed, then proportional scores were given. The 2 parts of the KDPS, the KSMS and FGS, assess different yet complementary areas. The KSMS measures the balance of the diet by determining the frequency of Korean food consumption, and the FGS measures the adequacy of food and nutritional consumption based on Korean dietary recommendations. A more detailed description of the KDPS and its validation is presented in the article by Lee & Cho [16].
2.3. Statistical Analysis
Data were analyzed using SAS 9.13 (Statistical Analysis System, SAS Institute, Cary, NC, USA) and SUDAAN 10.1 (SUDAAN, Research Triangle Institute, Research Triangle Park, NC, USA). After processing the data through the SAS program, statistical significance was tested using SUDAAN. The KNHANES data were not derived from a simple random sample, but from a multistage stratified probability sample, and therefore SUDAAN was used in order to take this sampling method into account. The average and standard deviation of all the variables were calculated and analyzed using Taylor series’ linearization variance estimation by considering the weight. Statistical significance was set at a level of α = 0.05.
The characteristics of each score component were ex-
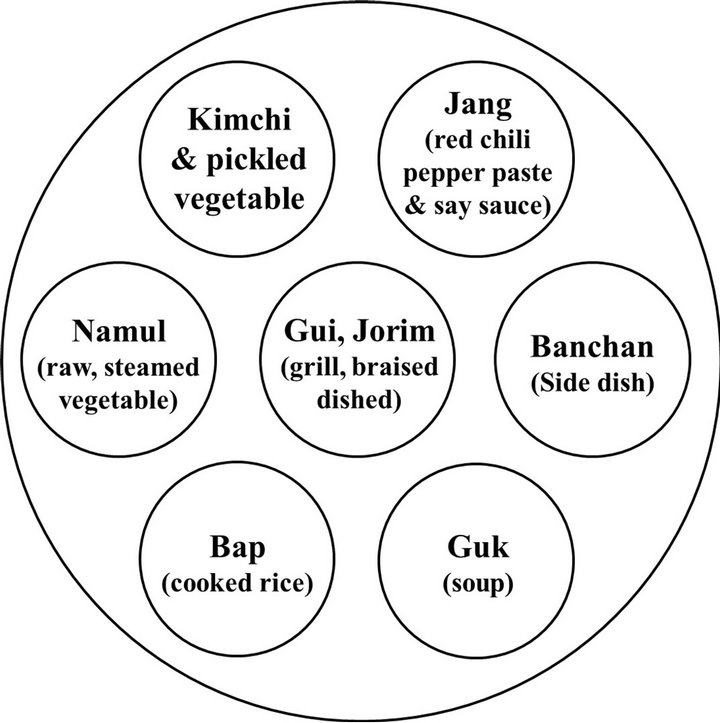
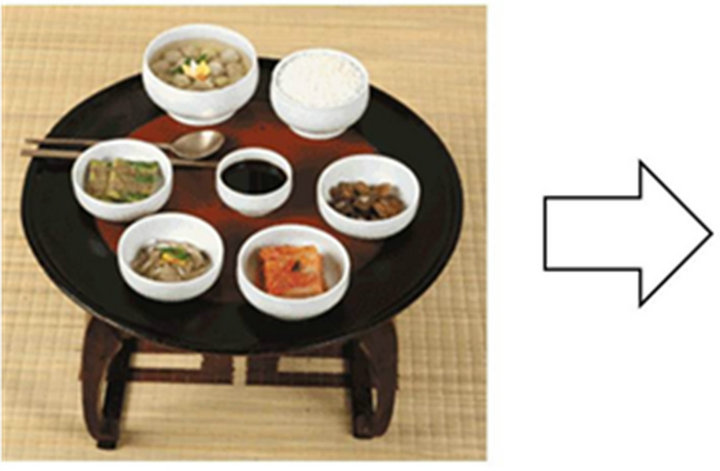
Figure 1. Model of 3-Chup Bansang.
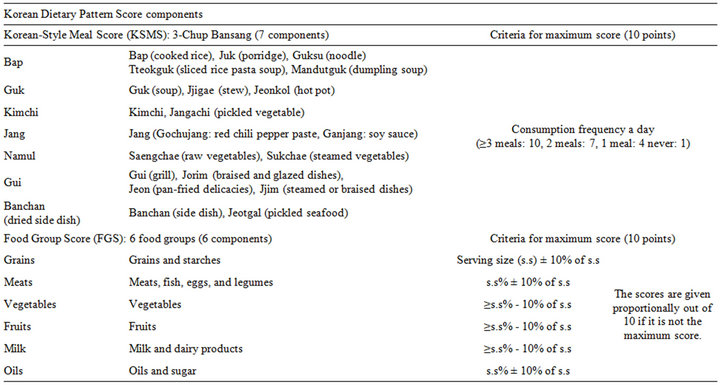
Table 1. Components of the Korean Dietary Pattern Score (KDPS) and criteria for maximum score of each component.
amined through descriptive analysis. Subjects were divided into 3 groups (upper, middle, and lower group) based on the KDPS score, and categorical variables were analyzed using the χ2 test. For continuous variables, we used the independent t-test, ANOVA (Bonferroni’s multiple comparison), and logistic regression. This study used a version of the methods of Kant et al. [17] and Kim et al. [18] for measuring the variety of food intake, and proposed a Food Variety Score (FVS). The FVS determines the frequency of consumption of 6 food groups (grains/starches, meats/fish/eggs/legumes, vegetables, fruits, milk/dairy products, and oils/sugar) that constitute the daily FGS. When a certain food group was consumed more than once a day, it was counted as 1 point, and the maximum possible points were 6. The disease risk of each group (upper, middle, and lower group) according to the total KDPS and KSMS was adjusted for gender and age, and odds ratios were calculated through logistic regression.
3. Results
3.1. General Characteristics of the Subjects, Socio-Demographic Factors and KDPS
The average KDPS was 61.38. The characteristics of the subjects according to socio-demographic factors are shown in Figure 2 and Table 2. The distributions of the KDPS, KSMS, and FGS were examined based on age. The highest possible score for the KDPS was 130 points, and the lowest possible score was 7. The highest score obtained was 102 points in the 60 - 69 years group, and the lowest was 19 points in the 20 - 29 years group. The highest average KDPS was found in subjects aged 50 - 59 years (63.9 points), and the lowest average was found in subjects aged 20 - 29 years (56 points). For the KSMS, the highest possible score was 70 and the lowest possible score was 7. The highest score obtained was 61 points in the 50 - 59 years group, whereas the lowest score was 7 points in the 20 - 29 and 30 - 39 years groups.
The overall average KSMS was 32.03; the highest average was found in those aged 50 - 59 years (33.8 points), and the lowest average was found in those aged 20 - 29 years (27.2 points). This indicates that those in their 50 s adhere to the traditional Korean diet pattern more than any other age group. The highest possible score for the FGS was 60, and the lowest possible score was 0. The highest score obtained was 57.0 in those aged 30 - 39 years, and the lowest was 5.0 in those aged >70 years. The highest average FGS (30.1) was found in subjects aged 30 - 59 years, and the lowest (26.8) was found in those aged > 70 years. Those aged 30 - 50 years can, therefore, be said to consume each food group according to the Korean recommendations (Figure 2).
The subjects were divided into 3 groups according to KDPS score: the upper group included those with scores of 69 - 130, the middle group included those with scores of 57 - 68, and the lower group included those with scores of 0 - 56. The socio-demographic characteristics
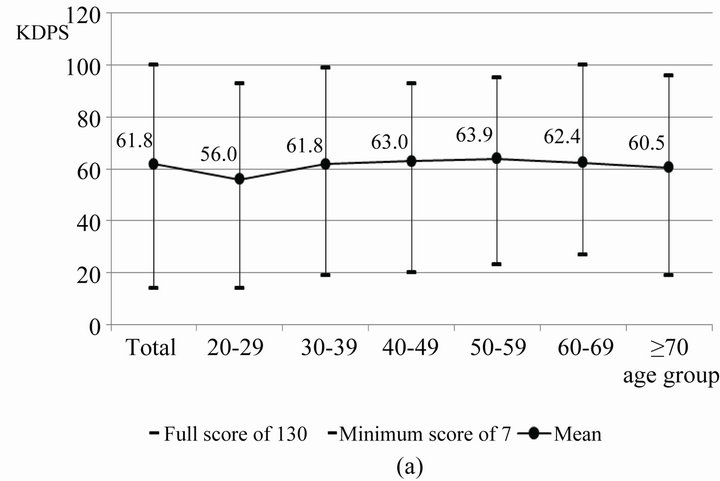
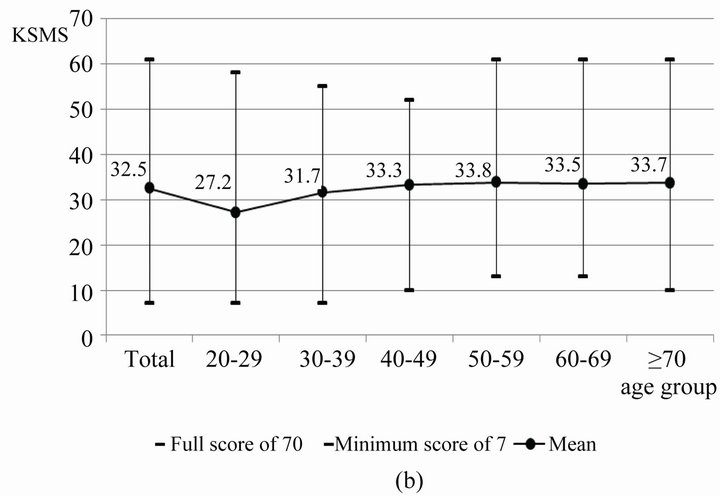
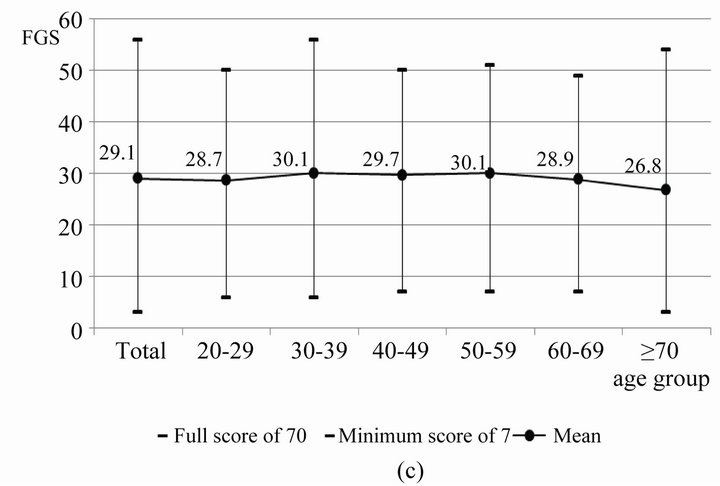
Figure 2. Score distributions of the KDPS, KSMS, and FGS among age groups.
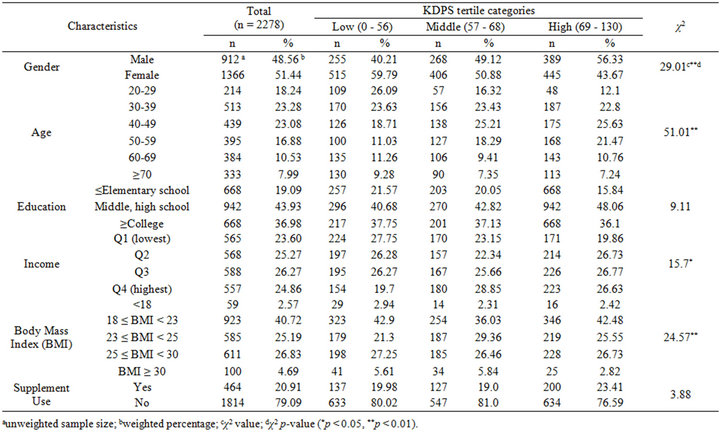
Table 2. General characteristics across tertile categories of the Korean Dietary Pattern Score (KDPS) in the KNHANES 2007.
of the 3 groups divided by the KDPS are shown in Table 2.
To assess the association between socioeconomic characteristics and the KDPS, we performed the chi-squared test, and the results show that gender (p < 0.01), age (p < 0.01), income level (p < 0.05), and BMI (p < 0.01) were significantly associated with the KDPS groups, namely, the upper, middle, and lower groups based on the KDPS score. The percentage of women was higher in the lower and middle groups. In terms of age distribution, subjects aged 40 - 49 years were most prominent in the middle and upper groups (25.21% and 25.63% of each group, respectively). Subjects with an education level above high school were the most common in all 3 groups. When analyzing the income levels into quartiles, in the lower group, the lowest income quartile (Q1) made up the highest percentage, and in the middle group, the highest quartile (Q 4) made up the highest percentage. In the upper group, each of the income quartiles made up similar distributions. Subjects with BMI of 18 - 23 were the most common, and represented 42.48% of the upper KDPS group.
3.2. Comparison of Total KDPS and Component Scores for Each KDPS Group
The average of each component score for the 3 groups divided by the KDPS is shown in Table 3. There was a significant difference (p < 0.05) between the 3 groups in all components, except for milk and dairy products, for which the score tended to increase with increasing KDPS score.
The average scores for KSMS and FGS followed a pattern similar to KDPS: the scores were highest in the upper KDPS group and lowest in the lower KDPS group. The overall average score for the milk and dairy products component was 2.2 (out of a maximum of 10 points), while the average for the upper group was 3.17; this was the lowest average among all the food groups. The component with the highest average score was the bap (rice/ porridge/noodles/sliced rice pasta soup) component (8.27), which represented the most well-balanced food group consumed in the daily diet.
Components with averages over 5 out of 10 were guk (soup/stew/hot pot) (5.74), kimchi (kimchi/pickled vegetable) (6.74), grains (6.99), meats (5.28), and vegetables (6.72). Other components were not being consumed at appropriate levels when compared to the healthy Korean diet standard.
3.3. KDPS, KSMS and Variety of Food Intake
Previous studies have reported that nutrition improves as the variety of food consumed increases [19]. However, it
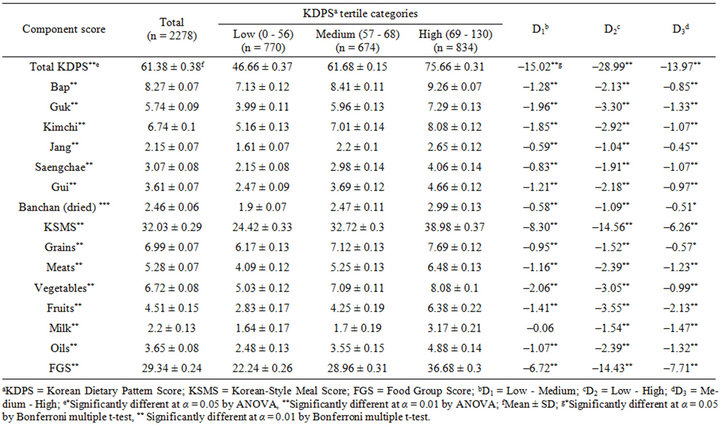
Table 3. Mean score of each component for the Korean Dietary Pattern Score (KDPS) across tertile categories of the KDPS in the KNHANES 2007.
has historically been difficult to assess the variety of food consumed.
The averages of food intake variety among the 3 KDPS groups are shown in Table 4. The Food Variety Score (FVS) followed a pattern that was similar to the KDPS scores: they were highest in the upper KDPS group and lowest in the lower KDPS group. The differences between the groups were significant (p < 0.01).
In order to see the difference in the FVS according to the degree of balance in Korean-style meal composition, subjects were divided into 3 groups based on the KSMS score: the upper group (scores 37 - 70), the middle group (scores 29 - 36) and the lower group (scores 0 - 28) (Table 4). The FVS increased as the KSMS scores increased. However, there was no significant difference in the average FVS between the middle and upper KSMS groups.
3.4. KDPS, KSMS and Risk of Disease
Logistic regression analysis was conducted to investigate the risk of disease according to the KDPS and KSMS. The analysis controlled for gender and age, factors that are expected to influence the KDPS, KSMS, and disease occurrence. The effects are expressed as odds ratios (ORs)
with 95% confidence intervals (CI).
The disease risks in the 3 KDPS groups are shown in Table 5. The lower KDPS group had a decreased risk of obesity, but the results were not statistically significant. The OR for elevated systolic blood pressure (SBP) and hypercholesterolemia was 0.58 in the upper KDPS group, compared with that in the lower KDPS group. As the KDPS increased, the risk of elevated SBP (p = 0.02) and hypercholesterolemia (p = 0.03) significantly decreased. Overall, the risk of disease in the upper KDPS group was lower than that in the lower KDPS group for most diseases. Therefore, people who consume the balanced Korean style meals that include the 6 food groups based on recommendation standards have a lower risk of disease.
The risk of disease for the 3 KSMS groups was assessed in order to further examine the relationship between dietary balance and risk of disease (Table 6). The OR for central obesity was 0.76 in the upper KSMS group, compared with the lower KSMS group. As the KSMS increased, the risk of central obesity significantly decreased (p = 0.02). The OR for hyperlipidemia in the upper KSMS group was 0.7, compared with the lower KSMS group. As the KSMS increased, the risk of high
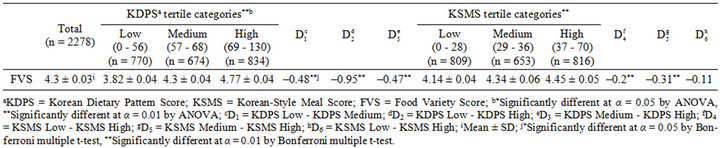
Table 4. Food variety score (FVS) across tertile categories of the Korean Dietary Pattern Score (KDPS) and Korean-Style Meal Score (KSMS).
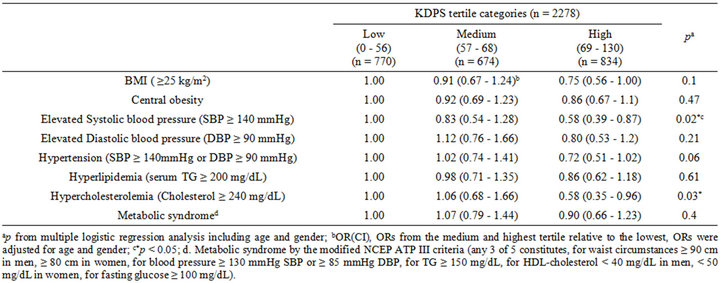
Table 5. Odds Ratio (95% Confidence Interval) of each risk factors of disease according to tertile of the Korean Dietary Pattern Score (KDPS) in the KNHANES 2007.
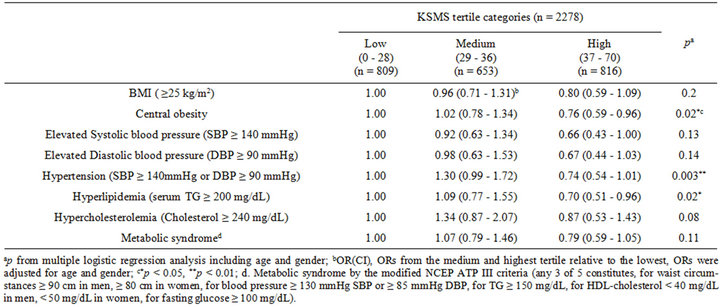
Table 6. Odds ratio (95% confidence interval) of each risk factors of disease according to tertile of the Korean-Style Meal Score (KSMS) in the KNHANES 2007.
blood pressure (p = 0.003) and hyperlipidemia (p = 0.02) significantly decreased. Although not all results were statistically significant, the risks of most diseases were generally lower in the upper KSMS group than that in the lower KSMS group.
4. Discussion and Conclusions
From a cultural perspective, this study applied the KDPS to Korean adults. The KDPS is a certified score that was developed to evaluate dietary adherence to Korean-style meals and the quality of an average Korean adult’s meal. Earlier studies have used scores based on the Korean dietary recommendations. However, it is difficult for those studies to determine to what degree an individual adheres to Korean-style meal patterns. In contrast, the KDPS is based on the daily basic table setting of 3-Chup Bansang and recommended serving portions for the average Korean. The KDPS has unique features: it not only assesses the level of adherence to Korean-style meal patterns, but also measures the healthiness of the food consumed. Another unique aspect of the KDPS is that it uses a continuous scale. Continuous scoring can minimize misclassification bias. The consideration of the effects of overconsumption is another unique feature of the KDPS. We applied over-consumption penalties to the components of the FGS.
This study examined the component scores of the KDPS across tertiles according to the groups of KDPS scores (upper, middle, and lower KDPS group). The score for milk and dairy products component was the lowest among all components. This result is in line with previous studies reported that the most insufficient food group in a Korean-style diet is milk and dairy products [20-22]. Further, the results of the logistic regression analysis showed that a higher KDPS correlated to a lower risk of obesity. This result is in keeping with the results from the studies of Schroder et al. [23] and Mendez et al. [24] who established that the rate of obesity decreased as the score for the Mediterranean diet pattern increased. Romaguera et al. [25], who used the modified-Mediterranean Diet Score (mMDS) to measure the degree of adherence to a Mediterranean diet pattern, showed that the risk of obesity reduced as the mMDS increased. Hence, it can be said that adherence to Korean-style meal patterns lowers the risk of obesity similarly to the Mediterranean diet pattern. In addition, as the KDPS increased, the risk of elevated SBP (p = 0.02) and hypercholesterolemia (p = 0.03) significantly decreased, suggesting further health benefits from adhering to Korean-style dietary patterns. These results are similar to those of Panagiotakos et al. [8], who revealed that a higher Mediterranean Diet Score resulted in a lower SBP.
This study is meaningful in its monitoring and evaluation of Korean subjects’ adherence to Korean dietary patterns. The KDPS can assess the degree of adherence to Korean dietary patterns and the consumption of a healthy diet in the following ways. First, previous dietary scoring methods were developed from a nutritional epidemiological point of view. Diet patterns are largely influenced by each country’s unique cultural characteristics. However, there have been few studies that have attempted to integrate the nutrition epidemiological point of view with cultural perspectives in developing dietary pattern scoring systems. Based on the cultural characteristics of Korean dietary patterns, this study developed an integrated score by combining nutritional science with food culture. Therefore, this score is highly applicable and relevant to health status in the Korean context.
Second, a number of previous diet pattern scoring methods used a food frequency questionnaire (FFQ) for investigating diet intake data. However, the FFQ have limitations in estimating the energy intake and are subject to high levels of possible error. The KDPS uses a 24-h recall method instead of the FFQ, which allows more precise data to be obtained on energy and food intake. Although the 24-h recall method has its own drawbacks in being unable to observe patterns of diet quality, the KDPS approach based on the 3-Chup Bansang overcomes this disadvantage.
Third, as the KDPS applies the Korean Dietary Reference Intake (KDRIs), which reflects the most appropriate Korean diet, the validity of the results is relatively high for the relationships between dietary patterns, food and nutrient intake, and health status.
Fourth, the KDPS can be used to propose and promote healthy dietary patterns to the public. As recommendations based on dietary patterns rather than nutrients or food groups are familiar to the general public, they may be more effective in improving public health. The KDPS provides a scientific basis for assessing the health benefits of maintaining a Korean-style diet.
This study has some limitations. The KNHANES data that were used for application of the KDPS are cross-sectional, and represent dietary patterns only at a certain point in time. As health status is heavily influenced by long-term diet patterns, it is difficult to use the KDPSbased results for determining a direct causal relationship between diet and health status. Further, as the KDPS was developed for Korean adults aged more than 20 years, it cannot be applied to younger age groups. Additional studies using modified KDPS methodology will be required for preparing new standards for other groups including children, teenagers, and pregnant and breastfeeding women. By doing so, it will be possible to evaluate the effects of a Korean-style diet and the quality of diet over a subject’s lifetime.
5. Acknowledgements
This research was supported by the Globalization of Korean Foods R & D program, funded by the Ministry of Food, Agriculture, Forestry and Fisheries, Republic of Korea (911046-1).
REFERENCES
- K. Kant, “Indexes of Overall Diet Quality: A Review,” Journal of the American Dietetic Association, Vol. 96, No. 8, 1996, pp. 785-791. doi:10.1016/S0002-8223(96)00217-9
- M. Gerber, “The Comprehensive Approach to Diet: A Critical Review,” Journal of Nutrition, Vol. 131, No. 11, 2001, pp. 3051S-3055S.
- P. F. Jacques and K. L. Tucker, “Are Dietary Patterns Useful for Understanding the Role of Diet in Chronic Disease?” The American Journal of Clinical Nutrition, Vol. 73, No. 1, 2001, pp. 1-2.
- D. R. Jacobs Jr. and L. M. Steffen, “Nutrients, Foods, and Dietary Patterns as Exposures in Research: A Framework for Food Synergy,” The American Journal of Clinical Nutrition, Vol. 78, No. 3, 2003, pp. 508S-513S.
- A. K. Kant, A. Schatzkin, B. I. Graubard and C. Schairer, “A Prospective Study of Diet Quality and Mortality in Women,” JAMA, Vol. 283, No. 16, 2000, pp. 2109-2115. doi:10.1001/jama.283.16.2109
- L. Harnack, K. Nicodemus, D. R. Jacobs Jr. and A. R. Folsom, “An Evaluation of the Dietary Guidelines for Americans in Relation to Cancer Occurrence,” The American Journal of Clinical Nutrition, Vol. 76, No. 4, 2002, pp. 889-896.
- J. D. Seymour, E. E. Calle, E. W. Flagg, R. J. Coates, E. S. Ford and M. J. Thun, “Diet Quality Index as a Predictor of Short-Term Mortality in the American Cancer Society Cancer Prevention Study II Nutrition Cohort,” American Journal of Epidemiology, Vol. 157, No. 11, 2003, pp. 980-988. doi:10.1093/aje/kwg077
- D. B. Panagiotakos, C. Pitsavos and C. Stefanadis, “Dietary Patterns: A Mediterranean Diet Score and Its Relation to Clinical and Biological Markers of Cardiovascular Disease Risk,” Nutrition, Metabolism & Cardiovascular Diseases, Vol. 16, No. 8, 2006, pp. 559-568. doi:10.1016/j.numecd.2005.08.006
- M. E. Rumawas, J. T. Dwyer, M. N. Mckeown, J. B. Meigs, G. Rogers and P. F. Jacques, “The Development of the Mediterranean-Style Dietary Pattern Score and Its Application to the American Diet in the Framingham Offspring Cohort,” Journal of Nutrition, Vol. 139, No. 6, 2009, pp. 1150-1156. doi:10.3945/jn.108.103424
- W. C. Willett, F. Sacks, A. Trichopoulou, G. Drescher, A. Ferro-Luzzi and E. Helsing, “Mediterranean Diet Pyramid: A Cultural Model for Healthy Eating,” The American Journal of Clinical Nutrition, Vol. 61, No. 6, 1995, pp. 1402-1406.
- L. Serra-Majem, B. Roman and R. Estruch, “Scientific Evidence of Interventions Using the Mediterranean Diet: A Systematic Review,” Nutrition Reviews, Vol. 64, No. 1, 2006, pp. S27-S47. doi:10.1111/j.1753-4887.2006.tb00232.x
- H. K. Moon, H. R. Chung and E. Y. Cho, “Analysis of Menu Patterns from the Korean National Nutrition Survey in 1990,” Korean Journal of Food Culture, Vol. 9, No. 3, 1994, pp. 241-250.
- H. Y. Cho, “The Historical Background and Characteristics of Korean Food,” Korean Journal of Food Culture, Vol. 13, No. 1, 1998, pp. 1-8.
- J. H. Kang, K. A. Kim and J. S. Han, “Korean Diet and Obesity,” The Korean Journal of Obesity, Vol. 13, No. 1, 2004, pp. 34-41.
- H. O. Jung, “A Study on Developing Korean Food Brands,” Korean Studies, Vol. 8, 2006, pp. 161-191.
- K. W. Lee and M. S. Cho, “The Development and Validation of the Korean Dietary Pattern Score (KDPS),” Korean Journal of Food Culture, Vol. 25, No. 6, 2010, pp. 652-660.
- A. K. Kant, A. Schatzkin, T. B. Harris, R. G. Ziegler and G. Block, “Dietary Diversity and Subsequent Mortality in the First National Health and Nutrition Examination Survey Epidemiologic Follow-Up Study,” The American Journal of Clinical Nutrition, Vol. 57, No. 3, 1993, pp. 434-440.
- S. Kim, P. S. Haines, A. M. Siega-Riz and B. M. Popkin, “The Diet Quality Index-International (DQI-I) Provides an Effective Tool for Cross-National Comparisons of Diet Quality as Illustrated by China and the United States,” Journal of Nutrition, Vol. 133, No. 11, 2003, pp. 3476- 3484.
- J. W. Lee, H. J. Hyun, C. S. Kwak, C. I. Kim and H. S. Lee, “Relationship between the Number of Different Food Consumed and Nutrient Intakes,” Korean Journal of Community Nutrition, Vol. 5, No. 2, 2000, pp. 297-306.
- S. H. Kim, C. H. Yu, J. Y. Kim and S. S. Lee, “The Effect of Milk Consumption on Blood Lipid Levels of the Korean College Women,” Korean Journal of Nutrition, Vol. 38, No. 7, 2005, pp. 561-569.
- J. S. Lee, C. H. Yu and C. E. Chung, “Relation between Milk Consumption and Bone Mineral Density of Female College Students in Korea,” Korean Journal of Nutrition, Vol. 39, No. 5, 2006, pp. 451-459.
- C. E. Chung, “Ready-to-Eat Cereal Consumption Enhances Milk and Calcium Intake in Korean Population from 2001 Korean National Health and Nutrition Survey,” Korean Journal of Nutrition, Vol. 39, No. 8, pp. 786-794.
- H. Schroder, J. Marrugat, J. Vila, M. I. Covas and R. Elosua, “Adherence to the Traditional Mediterranean Diet Is Inversely Associated with Body Mass Index and Obesity in a Spanish Population,” Journal of Nutrition, Vol. 134, No. 12, 2004, pp. 3355-3361.
- M. A. Mendez, B. M. Popkin, P. Jakszyn, A. Berenguer, M. J. Tormo and M. J. Sanchez, “Adherence to a Mediterranean Diet Is Associated with Reduced 3-Year Incidence of Obesity,” Journal of Nutrition, Vol. 136, No. 11, 2006, pp. 2934-2938.
- D. Romaguera, T. Norat, T. Mouw, A. M. May, C. Bamia, N. Slimani, N. Travier, H. Besson, J. Luan and N. Wareham, “Adherence to the Mediterranean Diet Is Associated with Lower Abdominal Adiposity in European Men and Women,” Journal of Nutrition, Vol. 139, 2009, pp. 1150- 115.
Abbreviations
KDPS: Korean Dietary Pattern Score KNHANES: Korean National Health and Nutrition Examination Survey FVS: Food Variety Score KSMS: Korean-Style Meal Score
NOTES
*Corresponding author.
K.W. Lee and M.S. Cho have no conflicts of interest.