Food and Nutrition Sciences
Vol. 3 No. 3 (2012) , Article ID: 17968 , 9 pages DOI:10.4236/fns.2012.33051
Effects of Sodium Citrate plus Sodium Diacetate and Buffered Vinegar on Quality Attributes of Enhanced Beef Top Rounds
![]()
1Department of Animal and Dairy Sciences, Meat Science Technology Center, University of Georgia, Athens, USA; 2Department of Food Science and Technology, University of Georgia, Athens, USA.
Email: *astelz@uga.edu
Received December 7th, 2011; revised February 3rd, 2012; accepted February 10th, 2012
Keywords: Beef; Enhancement; Quality; Sensory; Shelf-Life
ABSTRACT
The effect of two antimicrobials in the enhancement solution was investigated in this study. Sensory and shelf-life characteristics were measured for beef top rounds enhanced to 110% with 0.5% sodium chloride and 0.4% sodium tripolyphosphate (CNT); CNT with a 1% solution of 80% sodium citrate plus 20% sodium diacetate (SC + D); or CNT with 2% buffered vinegar (VIN) in the final product. SC + D and VIN had less (P < 0.05) thaw and cook loss than CNT roasts, however, only VIN was rated as being juicier (P < 0.05) by a trained sensory panel. Sensory tenderness scores favored SC + D and VIN compared to CNT roasts although there was no difference for Warner-Bratzler shear force values between treatments. SC + D and VIN were rated as having slightly stronger (P < 0.05) off-flavor scores than CNT roasts, but all treatments were within threshold levels. Enhancement solution did not influence subjective panel redness or overall color over 7 days of retail display (P > 0.05). However, SC + D had lower (P < 0.05) CIE a*, b*, chroma values than VIN samples. Retail display discoloration was similar (P > 0.05) for all enhancement solutions within each day. After 7 days of retail display, SC + D retarded (P < 0.05) lipid oxidation to a greater extent than VIN or CNT samples. Sodium citrate plus sodium diacetate or buffered vinegar may be included in enhancement solutions without having a large influence on subjective color, and may aid in improving sensory tenderness.
1. Introduction
Tenderness is considered to be the most important characteristic contributing to consumer perceptions of beef [1,2]. Due to increased industrialization, mechanical tenderization processes may replace traditional aging. Blade tenderization and moisture enhancement by brine injecttion are the two common methods practiced by the industry to improve the tenderness of lower quality meat cuts [3-6]. In spite of the advantages of the mechanical tenderization processes, there have been concerns over the internalization of pathogens. Blade tenderization has been reported to translocate Escherichia coli O157:H7 present on the surface of beef inside rounds into the deep muscle tissues [7,8]. Three outbreaks due to E. coli O157: H7 between August 2000 and August 2004 have been linked to mechanically tenderized beef products [9-12]. In response to these outbreaks, in 2005 the United State Department of Agriculture-Food Safety Inspection Service (FSIS) mandated that establishments manufacturing mechanically tenderized beef products reassess their HACCP plans [11]. Surface decontamination of muscles prior to mechanical tenderization using hot water or organic acid washes has been studied by various researchers [13,14]. Some researchers have considered the inclusion of antimicrobials such as sodium lactate or sodium lactate and diacetate blends in the brine solution for needle injection, along with salt and phosphate and have found them to be effective against E. coli K12 [15-17]. One caveat to including antimicrobials in enhancement solutions is that they must be labeled on the ingredient statement. Both consumers and processors are increasingly interested in additives with clean label applications, such as buffered vinegar, where the active ingredient is acetic acid. Ponrajan and others [18] found that sodium citrate plus sodium diacetate or buffered vinegar can have positive antimicrobial effects against E. coli O157:H7 when included in beef enhancement solutions.
As new ingredients are incorporated into meat products, it is important to evaluate their impact on color, shelf life, quality, and sensory characteristics. Therefore, the objective of this research was to evaluate the implications of including sodium citrate plus sodium diacetate or buffered vinegar in common beef enhancement solutions on beef top round shelf-life, color, sensory, and tenderness characteristics.
2. Materials and Methods
2.1. Meat Procurement and Enhancement
Sixty Institutional Meat Purchase Specifications 169A beef top rounds (semimembranosus) from market cows were obtained (FPL Food LLC, Augusta, GA, USA) 3 d post harvest and transported (0˚C ± 2˚C) to the University of Georgia Meat Science Technology Center (Athens, GA, USA). On the day of the experiment, top rounds were randomly assigned to one of three enhancement treatments (n = 20 each) including: 1) 0.5% sodium chloride and 0.4% sodium tripolyphosphate as the control (CNT); 2) CNT with a 1% solution of 80% sodium citrate plus 20% sodium diacetate (SC + D) (IONAL LC, WTI Inc., Jefferson, GA, USA); or 3) CNT with 2% buffered vinegar (VIN) (MOstatin V, WTI Inc.) in the final product. A recirculating multi-needle injector (Injectamatic PI21 Automatic Pickle Injector, Koch Equipment LLC, Kansas City, MO, USA) with 21 needles (4 mm diameter) operating at 41strokes per min and 130 kPa pump pressure was calibrated to deliver 10% pickup. The enhancement solutions were mixed 12 h prior to injection for one hour. Immediately prior to injection, the enhancement solution was remixed to ensure complete dissolution. Muscle weight (Panther Model, Mettler-Toledo Inc., Worthington, OH) and muscle and enhancement solution pH (pH 11 series pH/mV/˚C meter, Oakton Instruments, Vernon Hills, IL, USA with pH probe EW-05998-20 GG9, Cole-Parmer Instrument Company, Vernon Hills, IL, USA) were measured before and after injection for each top round. Objective CIE L*, a*, b* color was collected at illuminant D65 with a 2˚ viewing angle and a 50 mm measuring area (CR-310 Chromo meter, Minolta Corporation, Osaka, Japan) calibrated with white and black tiles. pH and objective color were measured after a slice was removed from the lean face to expose fresh lean. After enhancement, the top rounds were vacuum packaged (B- 620 series; 30 - 50 cc O2/m2/24 h/101325 Pa/23˚C; Cryovac Sealed Air Corporation, Duncan, SC, USA) using a Type 800 (Henkelman BV, Hertogenbosch, the Netherlands) vacuum packager and stored in cold storage (0˚C ± 2˚C) for 10 d to simulate transportation and storage time [19]. All equipment was thoroughly cleaned between each treatment to prevent cross contamination of enhancement solutions.
2.2. Sample Preparation
After 10 d of cold storage, the top rounds were removed from the vacuum bags and allowed to drip for 10 min to remove excess purge. The muscles were weighed, and pH and objective color were measured at approximately the same location stated in section 2.1. Ten top rounds from each treatment were fabricated into four 2.54 cm thick steaks and one 5.08 cm thick roast. The four steaks from each top round were weighed and randomly placed on absorbent pads (Dri-Loc® AC-40, Cryovac Sealed Air Corporation) in trays (Cryovac® thermoformed polystyrene processor trays, Cryovac Sealed Air Corporation), which were then wrapped with an oxygen permeable polyvinylchloride overwrap (O2 transmission = 23,250 mL/ m2/24 h, 72 gauge; Pro Pack Group, Oakland, NJ, USA). The roast fabricated from each top round was immediately vacuum packaged and frozen (–28.8˚C ± 2˚C; d 10 post enhancement) for sensory analysis.
The remaining 10 top rounds from each treatment were fabricated into roasts 5.08 cm thick. Four roasts from each top round were re-vacuum packaged and randomly assigned to 0, 7, 14 or 21 d (d 10, 17, 24, 31 post enhancement) of additional storage (2˚C ± 2˚C) to simulate the time samples could remain in the food service cold chain [19]. At the end of the respective aging periods, all samples were frozen (–28.8˚C ± 2˚C) for future WarnerBratzler shear force (WBS) determination.
2.3. Warner-Bratzler Shear Force
The frozen roasts for WBS analysis were thawed for 48 h at 4˚C ± 2˚C. The roasts were cooked by roasting methods according to AMSA [20] in a normal air convection oven (General Electric Company, Fairfield, CT, USA) preheated to 163˚C for 30 min. Roasts were placed on a rack over a shallow pan to catch the drippings and cooked until they reached an internal temperature of 71˚C. The internal temperature of the roasts was monitored by a Digi-Sense® 12-channel scanning thermocouple thermometer (Model 9200-00, Cole-Parmer, Vernon Hills, IL, USA) with copper-constantan thermocouples (Omega Engineering, Stamford, CT, USA) inserted into the geometric center of each roast. The weight of each roast was recorded frozen, after thawing, and immediately after cooking to calculate percent thaw loss and cook loss. The cooked roasts were allowed to cool to room temperature (21.1˚C) for 4 h before six 1.27 cm cores from the semimembranosus muscle of each roast were cored parallel to the longitudinal orientation of the muscle fibers using a hand-held coring device. The cores were sheared once perpendicular to longitudinal orientation of the muscle fibers on a Universal Testing Machine (Instron Dual Column Model 3365, Instron Corp., Norwood, MA, USA) equipped with a Warner-Bratzler shear head and a 51 kgf load cell at a crosshead speed of 25 cm/min. The peak shear force (kgf) for each core was recorded (Bluehill software, Instron Corp.) and analyzed to obtain an average value for each roast.
2.4. Sensory Analysis
Top round roasts for sensory analysis were thawed and cooked similar to WBS roasts as described in section 2.3. After the roasts were cooked to an internal temperature of 71˚C, they were served in warmed yogurt makers (YM80, Euro Cuisine, Inc. Los Angeles, CA) to an 8 member trained sensory panel [20]. Each panelist evaluated 2 cubes per roast (1.27 cm3) from the semimembranosus muscle and evaluated 6 roasts per session, with 2 sessions per day over one week. The samples were given so that the panelists received two samples from each treatment in a random order at each session. The loaded yogurt makers were passed through a breadbasket from the sensory kitchen to the sensory analysis room. The sensory analysis room was equipped with negative pressure ventilation and 8 individual booths with red lighting to minimize panelist influence and mask differences in cooked roast color. The panelists evaluated each sample for initial tenderness (8 = extremely tender, 7 = very tender, 6 = moderately tender, 5 = slightly tender, 4 = slightly tough, 3 = moderately tough, 2 = very tough and 1 = extremely tough), sustained tenderness (8 = extremely tender, 7 = very tender, 6 = moderately tender, 5 = slightly tender, 4 = slightly tough, 3 = moderately tough, 2 = very tough and 1 = extremely tough), beef flavor intensity (8 = extremely intense, 7 = very intense, 6 = moderately intense, 5 = slightly intense, 4 = slightly bland, 3 = moderately bland, 2 = very bland and 1 = extremely bland), juiciness (8 = extremely juicy, 7 = very juicy, 6 = moderately juicy, 5 = slightly juicy, 4 = slightly dry, 3 = moderately dry, 2 = very dry and 1 = extremely dry), and off-flavor (6 = extreme off-flavor, 5 = very strong off-flavor, 4 = moderate off-flavor, 3 = slight off-flavor, 2 = threshold offflavor and 1 = none detected).
2.5. Objective and Subjective Shelf-Life Color
The packaged top round steaks were stored in a cold storage room (4˚C ± 2˚C) with 24 h luminescence (960 lux) to simulate retail display over 7 d. Objective L*, a*, b* was recorded on d 0, 1, 3, 5 and 7 as stated in section 2.1, except the Minolta Chromo meter was calibrated after the white and black calibration tiles were wrapped in the polyvinylchloride overwrap. In addition, hue angle [(tan–1(b*/a*)] and chroma value [(a*2 + b*2)0.5] were calculated [21]. Three objective color readings were recorded for each package on each day. A 6 member trained color panel also recorded subjective color on d 0, 1, 3, 5 and 7 for overall color (8 = extremely desirable, 7 = very desirable, 6 = desirable, 5 = slightly desirable, 4 = slightly undesirable, 3 = undesirable, 2 = very undesirable and 1= extremely undesirable), red color (8 = light cherry red, 7 = moderately bright cherry red, 6 = cherry red, 5 = slightly dark red, 4 = moderately dark red, 3 = dark red/purple/brown, 2 = very dark red/purple/brown and 1 = extremely dark red/purple/brown), and percent discoloration (8 = no discoloration, 7 = 0% - 5% discolored, 6 = 5% - 10% discolored, 5 = 10% - 25% discolored, 4 = 25% - 50% discolored, 3 = 50% - 75% discolored, 2 = 75% - 90% discolored and 1 = 100% discolored) as outlined by Hunt and others [21] and adapted by Gill and others [22]. All panelists recorded < 60 for the total error score on the Farnsworth-Munsell 100-Hue Test (Xrite, Grandville, MI, USA). On d 1 and d 7 designated steaks were removed from retail packaging and trimmed of external fat and connective tissue, vacuum packaged, and stored (–28˚C ± 2˚C) for subsequent lipid oxidation analysis.
2.6. Lipid Oxidation Measurement
Thiobarbituric acid reactive substance analysis (TBARS) for measuring lipid oxidation was adopted from Ahn and others [23] with adaptations from Pegg [24]. Briefly, steak samples were partially thawed (4˚C ± 1˚C) in vacuum bags and then a 5 g meat sample was placed in a 50 ml centrifuge tube and homogenized (Tissumizer Mark II, Tekmar Company, Cinncinati, OH, USA) with 15 ml of deionized distilled water for 30 s. One milliliter of meat homogenate was transferred to disposable glass test tubes (13 × 100 mm). Fifty microliters of butylated hydroxyanisole (7.2%) and 2 ml thiobarbituric acid/trichloroacetic acid (TBA/TCA) solution were added to the homogenate. The solution was vortexed and then incubated in a boiling water bath for 15 min to develop color. After color development the sample was cooled for 10 min in cold water. The test tubes were then centrifuged at 3077 g (CR 312, Jouan Inc, Winchester, VA, USA) for 15 min and the supernatant was separated for spectrophotometric analysis. The absorbance of the supernatant was measured at 532 nm (Model 4001/4, Genesys 20, Thermo Electron Corporation, Waltham, MA, USA) and fitted against a standard curve constructed using varying concentrations of distilled water and TBA/TCA solution. The 5 g samples were duplicated within each sample from each treatment and day (CV < 10%). Lipid oxidation values are expressed in milligrams of malonaldehyde (MDA) per kg of meat.
2.7. Statistical Analysis
All data was analyzed using the Mixed procedures of SAS (V.9.1 SAS Inst. Inc., Cary, NC, USA). For the analysis of shelf-life purge, objective color, subjective color, and TBARS, data was analyzed as a completely randomized split-plot design. Muscle was considered the wholeplot and steak within muscle was considered the subplot. Steak was the experimental and observational unit. The analysis of WBS and sensory attributes were also conducted using a split-plot design. Muscle was considered the whole-plot and roast was considered the subplot and experimental unit, while the core (WBS) or cube (sensory) was considered the observational unit. Muscle within treatment was considered the random term for all models. Degree of doneness was analyzed as a covariate for WBS and sensory analysis but was not significant and therefore was removed from the final model. In the case of a treatment by day of display interaction, data was reanalyzed by day of display [25]. The means were separated using the PDIFF option in LSMEANS with Tukey adjustment. Differences among means were considered significant at α ≤ 0.05.
3. Results and Discussion
3.1. Enhanced Top Round Characteristics
The percent purge of VIN enhanced top rounds after 10 d of storage was higher (3.54 ± 0.24; P < 0.05) when compared to CNT (2.44 ± 0.22) and SC + D (2.48 ± 0.20). Muscle pH was similar prior to enhancement for all treatments (CNT 5.56 ± 0.02; SC + D 5.57 ± 0.02; VIN 5.55 ± 0.03; P > 0.05). However, immediately after enhancement, muscle pH increased (P < 0.05) for CNT (5.72 ± 0.04) and VIN (5.77 ± 0.03) but remained unchanged for SC + D (5.69 ± 0.03). CNT muscle pH remained constant over the 10 d storage period, however, pH declined for both SC + D and VIN samples (5.78 ± 0.05; 5.51 ± 0.08 and 5.48 ± 0.08, respectively; P < 0.05). Paulson and others [15] observed a similar decrease in pH over a 14 d storage period when comparing sodium lactate or sodium lactate plus diacetate in brine solutions to a control brine. Objective CIE L*, a*, and b* values were not different among enhancement treatments (P > 0.05) but did decrease over time (P < 0.05), indicating that enhanced muscles became darker and less red after 10 d post enhancement storage (data not shown in tabular form).
3.2. Percent Thaw and Cook Loss
Thaw and cooking losses were greater (P < 0.05) for CNT top round roasts compared to SC + D or VIN roasts, and VIN enhanced roasts had more moisture loss (P < 0.05) than SC+D roasts (Table 1). Thaw loss increased (P < 0.05) from 10 to 17 d post enhancement storage, however, after 31 d of additional cold storage thaw loss was similar (P > 0.05) to 10 d (Table 2). Post enhancement storage of top round roasts did not influence (P > 0.05) moisture loss during cooking. The lower percent thaw loss and percent cook loss of the SC + D and VIN enhanced steaks could be attributed to the salts of organic acids present in the antimicrobials, which would increase the water holding capacity and cook yields as hypothesized by Jensen and others [26].
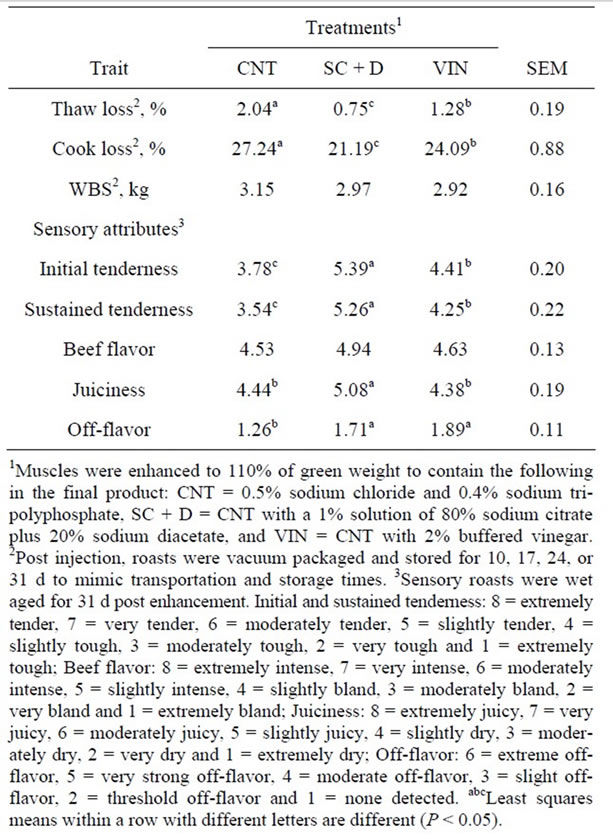
Table 1. Effects of antimicrobial enhancement solutions on least squares means for cooking characteristics, Warner Bratzler shear force (WBS) and sensory attributes of aged beef top round roasts.
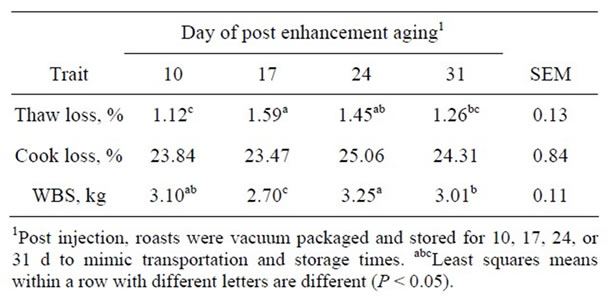
Table 2. Effect of days of post injection wet aging on least squares means for cooking characteristics and Warner Bratzler shear force (WBS) for beef top round roasts.
3.3. Warner-Bratzler Shear Force
Warner-Bratzler shear force was not affected by enhancement solution (P > 0.05; Table 1). However, post enhancement top round roast storage time did influence WBS (P < 0.05; Table 2) with roasts stored for an additional 17 d being the most tender (P < 0.05). Roasts stored for 31 d had similar (P > 0.05) WBS to roasts stored for 10 d and were more tender (P < 0.05) than roasts stored for 24 d post enhancement. The reasons for slight variation in tenderness due to post enhancement storage in the current study are not clear. However, Belew and others [1], while studying the WBS of 40 bovine muscles, classified the muscles as “very tender” evaluating the sensory attributes of eleven beef muscles (WBS < 3.2 kg), “tender” (3.2 < WBS < 3.9 kg), “intermediate” (3.9 < WBS < 4.6 kg) and “tough” (WBS > 4.6 kg). The results of the current study indicate that all muscles from the three enhancement treatments and storage times, which were obtained from market cows, would be considered as tender. Gruber and others [27] evaluated WBS for 17 muscles from USDA Select and upper two-thirds USDA Choice between 2 to 28 d of aging. The WBS value for the semimembranosus after 28 d of aging was 4.96 kg and 4.45 kg for USDA Select and upper two-thirds USDA Choice, respectively. Rhee and others [28] reported the WBS for eleven beef muscles at 72 h postmortem followed by 14 d of aging at 2˚C to be 4.64 kg. The results of the current study indicate that enhancement of muscles from market cows by multi-needle injection improves the tenderness of this cut regardless of post enhancement aging times.
3.4. Sensory Analysis
Initial and sustained tenderness scores from the trained sensory panel rated CNT top round roasts as less tender (P < 0.05) than SC + D roasts with VIN roasts being intermediate (Table 1). Although the WBS values for roasts from all treatments fell within the very tender category (Belew et al., 2003), SC + D roasts were rated as slightly tender while VIN and CNT roasts were rated as slightly tough and moderately tough, respectively. There was no difference (P = 0.09) in beef flavor intensity among the three enhancement solutions. Trained panelists rated the SC + D roasts as being juicier (P < 0.03) than CNT or VIN, which were similar (P = 0.80). It was expected that SC + D roasts would be rated as juicier since they had the least amount of moisture loss during thawing and cooking. Sensory off-flavor scores for SC + D and VIN enhanced roasts were rated at threshold levels and were greater (P < 0.01) than CNT enhanced roasts. Using a similar scale, Rhee and others [28] reported that the semimembranosus received an overall sensory tenderness rating of 4.2, juiciness of 5.0, beef flavor intensity of 4.2, and off-flavor score of 2.5 while after 14 d of aging at 2˚C. Lorenzen and others [29] reported that top rounds received an overall tenderness score of 5.4, flavor intensity score of 5.5 and cooked beef flavor intensity of 3.1 while evaluating USDA high (upper two thirds) Choice, low Choice, high Select and low Select. Evaluating seven beef muscles, Holmer and others [30] replaced sodium chloride in an enhancement solution with sodium citrate (main ingredient in the SC + D formulation) and only reported differences for juiciness in the longissimus and beef flavor intensity in the longissimus and complexus. The current study indicates that SC + D or VIN can be incorporated with enhancement solutions to improve tenderness and that SC + D can improve juiciness. However, further research is warranted to examine the effects of these ingredients on sensory off-flavor scores.
3.5. Lipid Oxidation
The effects of enhancement solutions on lipid oxidation of beef top sirloin steaks are shown in Figure 1. There was an enhancement solution by day of display interacttion (P < 0.01). Therefore, data is presented within day of display. On d 1 of retail display, the CNT steaks had similar (P > 0.06) TBARS value compared to SC + D and VIN enhanced steaks while SC + D had lower (P < 0.01) TBARS value than VIN. After 7 d of retail display, CNT and VIN steaks exhibited more (P < 0.04) lipid oxidation that SC + D enhanced steaks. Evaluating citric acid for preventing lipid oxidation during acidification of beef, Ke and others [31] concluded that lipid oxidation was inhibited only by citric acid and not by sodium tripolyphosphate or pH adjustment of the muscles. Similarly, Sallam
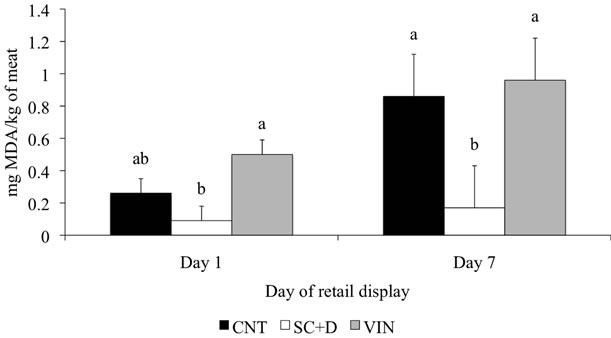
Figure 1. Least squares means (SE) for thiobarbituric acid reactive substances of enhanced top round steaks during 7 days of retail display. Data are expressed as milligrams of malonaldehyde (MDA) per kilogram of meat. CNT = 0.5% sodium chloride and 0.4% sodium tripolyphosphate, SC + D = CNT with a 1% solution of 80% sodium citrate plus 20% sodium diacetate, and VIN = CNT with 2% buffered vinegar. Within a day of retail display, bars with different letters differ (P < 0.05).
[32] concluded that sodium citrate had better antioxidant capacity than sodium acetate and sodium lactate when salmon slices were dipped in 2.5% solutions and stored at 1˚C. Hence, the sodium citrate present in SC + D could be attributed for its effectiveness in controlling the lipid oxidation to a greater extent. Based on conclusions made by Campo and others [33] under experimenttal conditions, a TBARS value of 2 mg malonaldehyde per kg of meat is considered a threshold level for the sensory acceptability of oxidized beef. From results of the current study, the maximum TBARS values for the three enhancement solutions were below this threshold level.
3.6. Objective and Subjective Shelf-Life Color
There was not a treatment by day of retail display interaction (P > 0.10) for CIE L*, a*, or b*. The enhancement solution did not have an effect on CIE L* values (P = 0.93), whereas the CIE a* and b* values for SC + D were lower than VIN (P < 0.01) and neither was different from CNT (P > 0.09; Table 3). Hue angle, which measures the rate of conversion from red to yellow spectrums, was similar among the treatments (P > 0.05) while chroma, which measures vividness, was lower for SC + D compared to VIN (P < 0.01). CIE L*, a*, b*, and chroma all
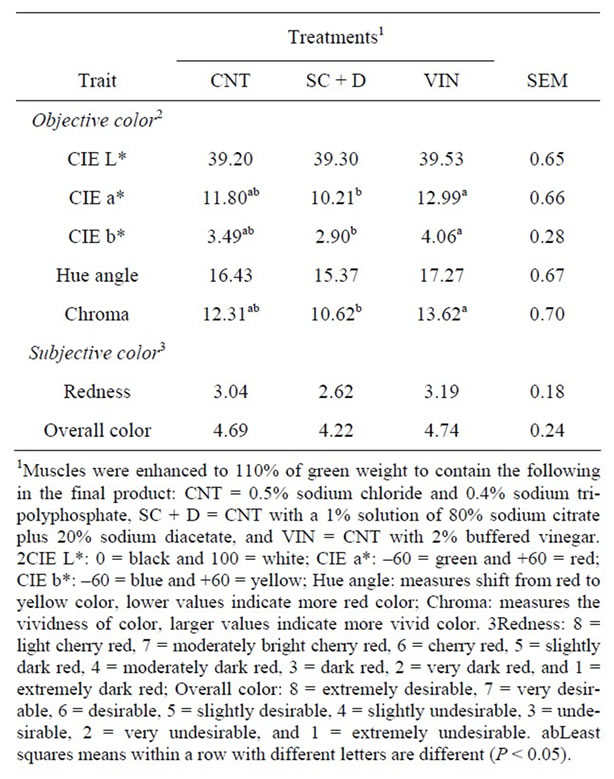
Table 3. Effects of antimicrobial enhancement solutions on least squares means for objective and subjective color for beef top rounds through 7 days of simulated retail display.
decreased as time on display increased, relating to the product becoming darker, less red, and less vivid with time (Table 4).
The addition of sodium citrate plus sodium diacetate or buffered vinegar to the enhancement solution did not influence (P > 0.05) trained color panel scores for redness or overall color (Table 3). However, trained color panel scores show that redness and overall color decreased (P < 0.01) as time on display increased for all the treatments. There was a treatment by day of retail display interaction for steak discoloration (P < 0.01). However, within day of display, all the treatments were similar in discoloration score, with the percent discoloration increasing with time on display (Figure 2). Steaks from all the enhancement treatments were able to resist discoloration greater than 5% for up to 5 d of retail display.
Wicklund and others [16] reported that use of sodium lactate in an enhancement solution made the steaks lighter in color with decreased redness when compared to control steaks. However, steaks enhanced with a lactate/diacetate mixture were reported to be darker and less red. Holmer and others [30] hypothesized that the addition of sodium chloride in enhancement solutions may decrease shelf-life color stability due to its pro-oxidant properties [34], while the use of sodium citrate provided color stability by delaying the conversion of oxymyoglobin to metmyoglobin. Contrary to this, the addition of sodium citrate or buffered vinegar to the enhancement solution did
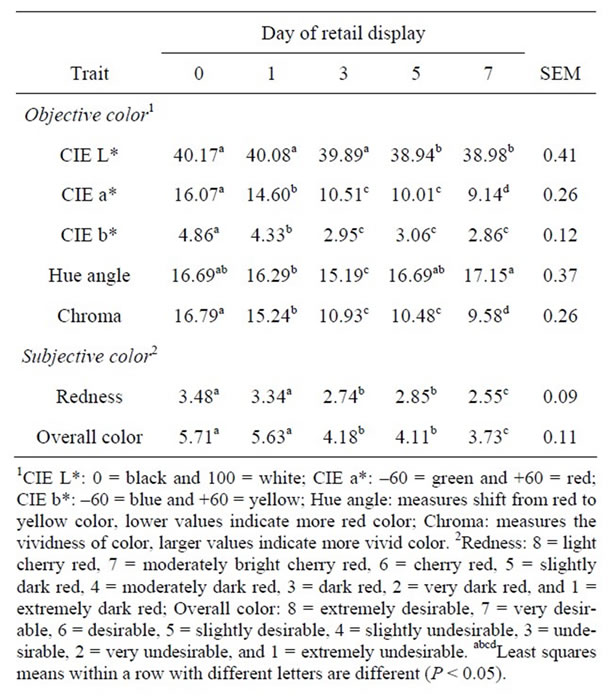
Table 4. Effects of day of simulated retail display on least squares means for objective and subjective color for enhanced beef top rounds.
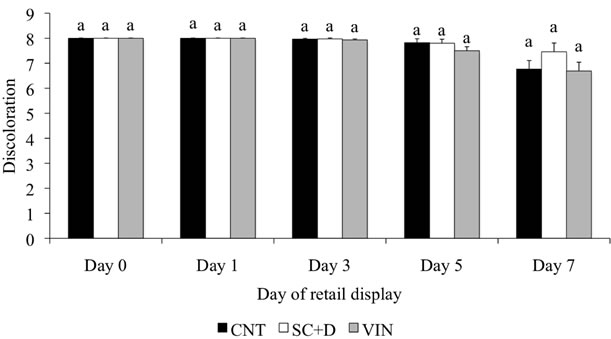
Figure 2. Least squares means (SE) for subjective discoloration of enhanced beef top round steaks during 7 days of retail display. CNT = 0.5% sodium chloride and 0.4% sodium tripolyphosphate, SC + D = CNT with a 1% solution of 80% sodium citrate plus 20% sodium diacetate, and VIN = CNT with 2% buffered vinegar. Discoloration: 8 = no discoloration, 7 = 1% - 5% discolored, 6 = 6% - 10% discolored, 5 = 11% - 25% discolored, 4 = 26% - 50% discolored, 3 = 51% - 75% discolored, 2 = 76 % - 90% discolored, and 1 = 91% - 100% discolored. Within a day of retail display, bars with different letters differ (P < 0.05).
not influence the steak color when compared to control steaks. The results from the current study indicate that sodium citrate plus sodium diacetate or buffered vinegar can be added to enhancement solutions for market cow muscles without having a negative impact on subjective color scores.
4. Conclusion
Sodium citrate plus sodium diacetate or buffered vinegar can be included in enhancement solutions, at levels used in the current research, as an incorporated antimicrobial for market cow top rounds while maintaining or improving steak color, oxidation stability, moisture retention, and tenderness when compared to control enhancement solutions containing only sodium chloride and sodium tripolyphosphate. Market cow top round roasts enhanced with sodium citrate plus sodium diacetate or buffered vinegar had improved trained sensory tenderness scores when compared to control roasts. However, there was a slight increase in off-flavor detection, which requires further research. Sodium citrate plus sodium diacetate or buffered vinegar can be used in beef enhancement solutions without adversely affecting most quality characteristics.
REFERENCES
- J. B. Belew, J. C. Brooks, D. R. McKenna and J. W. Savell, “Warner-Bratzler Shear Evaluations of 40 Bovine Muscles,” Meat Science, Vol. 64, No. 4, 2003, pp. 507- 512. doi:10.1016/S0309-1740(02)00242-5
- J. B. Morgan, J. W. Savell, D. S. Hale, R. K. Miller, D. B. Griffin, H. R. Cross and S. D. Shackelford, “National Beef Tenderness Survey,” Journal of Animal Science, Vol. 69, No. 8, 1991, pp. 3274-3283.
- K. J. Boyd, H. W. Ockerman and R. F. Plimpton, “Sensory Characteristics and Microbiological Evaluation of Stored Mechanically Tenderized Beef semimembranosus Muscle,” Journal of Food Science, Vol. 43, No. 3, 1978, pp. 670-676. doi:10.1111/j.1365-2621.1978.tb02389.x
- K. A. Davis, D. L. Huffman and J. C. Cordray, “Effect of Mechanical Tenderization, Aging and Pressing on Beef Quality,” Journal of Food Science, Vol. 40, No. 6, 1975, pp. 1222-1224. doi:10.1111/j.1365-2621.1975.tb01056.x
- E. E. Glover, J. C. Forrest, H. R. Johnson, V. D. Bramblett and M. D. Judge, “Palatability and Cooking Characteristics of Mechanically Tenderized Beef,” Journal of Food Science, Vol. 42, No. 4, 1977, pp. 871-874. doi:10.1111/j.1365-2621.1977.tb12626.x
- S. E. Wicklund, C. Homco-Ryan, K. J. Ryan, F. K. McKeith, B. J. McFarlane and M. S. Brewer, “Aging and Enhancement Effects on Quality Characteristics of Beef Strip Steaks,” Journal of Food Science, Vol. 70, No. 3, 2005, pp. S242-S247. doi:10.1111/j.1365-2621.2005.tb07164.x
- J. B. Luchansky, R. K. Phebus, H. Thippareddi and J. E. Call, “Translocation of Surface-Inoculated Escherichia coli O157:H7 into Beef Subprimals Following Blade Tenderization,” Journal of Food Protection, Vol. 71, No. 11, 2008, pp. 2190-2197.
- S. B. Sporing, “Escherichia coli O157:H7 Risk Assessment for Production and Cooking of Blade Tenderized Beef Steaks,” Master’s Thesis, Vol. Kansas State University, Manhattan, KS, 1999.
- USDA Food Safety Inspection Service, “Recall Notification Report: 028-2003,” United Stated Department of Agriculture, Washington DC, Accessed on 14 October 2009. http://www.fsis.usda.gov/Frame/FrameRedirect.asp?main=http://www.fsis.usda.gov/OA/recalls/rnrfiles/rnr028-2003.htm
- USDA Food Safety Inspection Service, “Recall Notification Report: 033-2004,” United Stated Department of Agriculture, Washington DC, Accessed on 14 October 2009. http://www.fsis.usda.gov/fsis_recalls/rnr_033_2004/index.asp
- USDA Food Safety Inspection Service, “HACCP Plan Reassessment for Mechanically Tenderized Beef Products,” Federal Register, Vol. 70, No. 101, 2005, pp. 30331- 30334.
- E. S. Laine, J. M. Scheftel, D. J. Boxrud, K. J. Vought, R. N. Danila, K. M. Elfering and K. E. Smith, “Outbreak of Escherichia coli O157:H7 Infections Associated with Nonintact Blade-Tenderized Frozen Steaks Sold by Doorto-Door Vendors,” Journal of Food Protection, Vol. 68, No. 6, 2005, pp. 1198-1202.
- A. Echeverry, J. C. Brooks, M. F. Miller, J. A. Collins, G. H. Loneragan and M. M. Brashears, “Validation of Intervention Strategies to Control Escherichia coli O157:H7 and Salmonella Typhimurium DT 104 in Mechanically Tenderized and Brine-Enhanced Beef,” Journal of Food Protection, Vol. 72, No. 8, 2009, pp. 1616-1623.
- C. E. Heller, J. A. Scanga, J. N. Sofos, K. E. Belk, W. Warren-Serna, G. R. Bellinger, R. T. Bacon, M. L. Rossman and G. C. Smith, “Decontamination of Beef Subprimal Cuts Intended for Blade Tenderization or Moisture Enhancement,” Journal of Food Protection, Vol. 70, No. 5, 2007, pp. 1174-1180.
- D. D. Paulson, R. A. Wicklund, M. C. Rojas and M. S. Brewer, “Effects of Shelf Life Enhancers and Microbial Load on Escherichia coli K12 Survival in Injected Beef Strip Steaks,” Journal of Muscle Foods, Vol. 18, No. 2, 2007, pp. 194-206. doi:10.1111/j.1745-4573.2007.00077.x
- R. A. Wicklund, D. D. Paulson, M. C. Rojas and M. S. Brewer, “Effects of Shelf-Life Enhancers on E. coli K12 Survival in Solutions Used to Enhance Beef Strip Steaks,” Journal of Food Science, Vol. 71, No. 6, 2006, pp. M190-M195. doi:10.1111/j.1750-3841.2006.00092.x
- R. A. Wicklund, D. D. Paulson, M. C. Rojas, and M. S. Brewer, “The Effects of Shelf-Life Enhancers on E. coli K12 Survival in Needle-Injected, Surface Contaminated Beef Strip Steaks Enhanced Using Recycled Solutions,” Meat Science, Vol. 75, No. 3, 2007, pp. 371-380. doi:10.1016/j.meatsci.2006.06.029
- A. Ponrajan, M. A. Harrison, J. R. Segers, B. K. Lowe, R. O. McKeith, T. D. Pringle, K. G. Martino, J. H. Mulligan and A. M. Stelzleni, “Effects of Sodium Citrate plus Sodium Diacetate and Buffered Vinegar on Escherichia coli O157:H7 and Psychrotrophic Bacteria in Brine-Injected Beef,” Journal of Food Protection, Vol. 74, No. 3, 2011, pp. 359-364. doi:10.4315/0362-028X.JFP-10-294
- K. L. Voges, C. L. Mason, J. C. Brooks, R. J. Delmore, D. B. Griffin, D. S. Hale, W. R. Henning, D. D. Johnson, C. L. Lorenzen, R. J. Maddock, R. K. Miller, J. B. Morgan, B. E. Baird, B. L. Gwartney and J. W. Savell, “National Beef Tenderness Survey 2006: Assessment of WarnerBratzler Shear and Sensory Panel Ratings for Beef from US Retail and Foodservice Establishments,” Meat Science, Vol. 77, No. 3, 2007, pp. 357-364. doi:10.1016/j.meatsci.2007.03.024
- AMSA, “Research Guidelines for Cookery, Sensory Evaluation and Instrumental Tenderness Measurements of Fresh Meat,” American Meat Science Association in cooperation with National Live Stock and Meat Board, now the National Cattleman’s Beef Association, Centennial, CO, American Meat Science Association in cooperation with National Live Stock and Meat Board, now the National Cattleman’s Beef Association, 1995.
- M. C. Hunt, J. C. Acton, R. C. Benedict, C. R. Calkins, D. P. Conforth, L. E. Jeremiah, D. G. Olson, C. P. Salm, J. W. Savell and S. D. Shivas, “Guidelines for Meat Color Evaluation,” Reciprocal Meat Conference, Manhattan, 9-12 July 1991, pp. 1-17.
- R. K. Gill, D. L. Van Overbeke, B. Depenbusch, J. S. Drouillard and A. Di Costanzo, “Impact of Beef Cattle Diets Containing Corn or Sorghum Distillers Grains on Beef Color, Fatty Acid Profiles, and Sensory Attributes,” Journal of Animal Science, Vol. 86, 2008, pp. 923-935. doi:10.2527/jas.2007-0244
- D. U. Ahn, D. G. Olson, J. I. Lee, C. Jo, C. Wu and X. Chen, “Packaging and Irradiation Effects on Lipid Oxidation and Volatiles in Pork Patties,” Journal of Food Science, Vol. 63, No. 1, 1998, pp. 15-19. doi:10.1111/j.1365-2621.1998.tb15665.x
- R. B. Pegg, “Spectrophotometric Measurement of Secondary Lipid Oxidation Products,” In: R. E. Wrolstad, E. A. Decker, M. H. Penner, D. S. Reid, S. J. Schwartz, C. F. Shoemaker, D. M. Smith and P. Sporns, Eds., Handbook of Food Analytical Chemistry, John Wiley & Sons, New York, 2005, pp. 547-564.
- S. A. Quilo, F. W. Pohlman, A. H. Brown, P. G. Crandall, P. N. Dias-Morse, R. T. Baublits and J. L. Aparicio, “Effects of Potassium Lactate, Sodium Metasilicate, Peroxyacetic Acid, and Acidified Sodium Chlorite on Physical, Chemical, and Sensory Properties of Ground Beef Patties,” Meat Science, Vol. 82, No. 1, 2009, pp. 44-52. doi:10.1016/j.meatsci.2008.12.002
- J. M. Jensen, C. Prestat, K. J. Ryan, K. L. Robbins, C. L. Homco-Ryan, F. McKeith and M. S. Brewer, “Enhancement Solution Effects on Shelf-Life, Color and Sensory Characteristics of Pork Chops During Retail Display,” Journal of Food Quality, Vol. 26, No. 4, 2003, pp. 271- 283. doi:10.1111/j.1745-4557.2003.tb00245.x
- S. L. Gruber, J. D. Tatum, J. A. Scanga, P. L. Chapman, G. C. Smith and K. E. Belk, “Effects of Postmortem Aging and USDA Quality Grade on Warner-Bratzler Shear Force Values of Seventeen Individual Beef Muscles,” Journal of Animal Science, Vol. 84, No. 12, 2006, pp. 3387-3396. doi:10.2527/jas.2006-194
- M. S. Rhee, T. L. Wheeler, S. D. Shackelford and M. Koohmaraie, “Variation in Palatability and Biochemical Traits within and among Eleven Beef Muscles,” Journal of Animal Science, Vol. 82, No. 2, 2004, pp. 534-550.
- C. L. Lorenzen, R. K. Miller, J. F. Taylor, T. R. Neely, J. D. Tatum, J. W. Wise, M. J. Buyck, J. O. Reagan and J. W. Savell, “Beef Customer Satisfaction: Trained Sensory Panel Ratings and Warner-Bratzler Shear Force Values,” Journal of Animal Science, Vol. 81, No. 1, 2003, pp. 143- 149.
- S. F. Holmer, L. W. Kutzler, F. K. McKeith and J. Killefer, “Sodium Citrate as a Replacement for Sodium Chloride in a Brine Solution When Evaluated in Cows of Different Backfat Thickness,” Meat Science, Vol. 81, No. 2, 2009, pp. 349-356. doi:10.1016/j.meatsci.2008.08.012
- S. M. Ke, Y. Huang, E. A. Decker and H. O. Hultin, “Impact of Citric Acid on the Tenderness, Microstructure and Oxidative Stability of Beef Muscle,” Meat Science, Vol. 82, No. 1, 2009, pp. 113-118. doi:10.1016/j.meatsci.2008.12.010
- K. I. Sallam, “Antimicrobial and Antioxidant Effects of Sodium Acetate, Sodium Lactate, and Sodium Citrate in Refrigerated Sliced Salmon,” Food Control, Vol. 18, No. 5, 2007, pp. 566-575. doi:10.1016/j.foodcont.2006.02.002
- M. M. Campo, G. R. Nute, S. I. Hughes, M. Enser, J. D. Wood and R. I. Richardson, “Flavour Perception of Oxidation in Beef,” Meat Science, Vol. 72, No. 2, 2006, pp. 303-311. doi:10.1016/j.meatsci.2005.07.015
- Y. H. Chu, D. L. Huffman, G. R. Trout and W. R. Egbert, “Color and Color Stability of Frozen Restructured Beef Steaks: Effect of Sodium Chloride, Tripolyphosphate, Nitrogen Atmosphere, and Processing Procedures,” Journal of Food Science, Vol. 52, 1987, pp. 869-875. doi:10.1111/j.1365-2621.1987.tb14230.x
NOTES
*Corresponding author.