American Journal of Plant Sciences
Vol.5 No.13(2014), Article
ID:46931,11
pages
DOI:10.4236/ajps.2014.513204
The Effect of Photosynthetic Active Radiation and Temperature on Growth and Flowering of Ten Flowering Pot Plant Species
Leiv M. Mortensen
Department of Plant Science, The University of Life Sciences, Ås, Norway
Email: lei-mo@online.no
Copyright © 2014 by author and Scientific Research Publishing Inc.
This work is licensed under the Creative Commons Attribution International License (CC BY).
http://creativecommons.org/licenses/by/4.0/


Received 17 April 2014; revised 18 May 2014; accepted 9 June 2014
ABSTRACT
Hibiscus rosa-sinensis, Rosa sp. (miniature roses), Sinningia speciosa, Gerbera hybrida, Kalanchoe blossfeldiana, Hydrangea, Begonia x hiemalis, Calceolaria, Cyclamen persicum and Pelargonium domesticum were grown at six photon flux densities (85, 130, 170, 215, 255 and 300 µmol∙m−2∙s−1, PFD) during lighting periods of 20 h∙day−1 at three air temperatures (18˚C, 21˚C and 24˚C) in midwinter at latitude 59˚ north. This corresponded to photosynthetic active radiations (PAR) ranging from 6.1 to 21.6 mol∙m−2∙day−1. Time until flowering decreased in all species except Cyclamen when the temperature increased from 18˚C to 21˚C, particularly at lower PFD levels. A further increase in temperature, from 21˚C to 24˚C, clearly decreased time until flowering in six of the ten tested species. Generally, this represented a reduction in the time until flowering between 20% and 40%. The dry weight of the plants at time of flowering increased up to 170 µmol∙m−2∙s−1 PFD (12.2 mol∙m−2∙day−1 PAR) in Hibiscus, miniature rose, Kalanchoe and Pelargonium, while the dry weight reached a maximum at 85 to 130 µmol∙m−2∙s−1 PFD mol∙m−2∙day−1 (6.1 to 9.4 mol∙m−2∙day−1) in the other species. Based on the present results a PAR level of 6 to 8 mol m−2∙day−1 is recommended for Calceolaria and Cyclamen, of 8 to 10 mol∙m−2∙day−1 for Sinningia, Gerbera, Kalanchoe, Hydrangea and Begonia, of 10 to 12 mol∙m−2∙day−1 for Pelargonium and of 12 to 15 mol∙m−2 day−1 for Hibiscus and miniature roses.
Keywords:Air Temperature, Flowering, Growth, Photon Flux Density (PFD), Photosynthetic Active Radiation (PAR), Pot Plants

1. Introduction
During recent decades several studies involving the effects of climate on flowering pot plants have been carried out, including studies of the effect of photosynthetic active radiation (PAR) and of temperature [1] -[6] . The natural light conditions in a greenhouse vary depending on the time of year and the latitude, as well as unpredictable weather conditions, as shown in Figure 1 [7] [8] . For higher latitudes supplementary lighting is necessary for effective winter production in greenhouses. The energy consumption must be kept as low as possible due to direct costs and for the plant production to be recognized as an environmental friendly production related to the CO2 emission [9] . However, there is no alternative to use enough light when one desires to produce high-quality plants as quickly as possible. Therefore it is important to know how much light is the minimum required for different crops. The photon flux density (PFD) on sunny summer days may reach about 2000 µmol∙m−2∙s−1, but the light transmission in a modern greenhouse will be about 60% of this, which means that the maximum PFD at plant level will be about 1200 µmol∙m−2∙s−1 (Figure 2). Although voluminous crops, such as cut roses, tomato and cucumber, may utilize such light levels [10] -[12] , this is not the case for flowering pot plants, which typically reach their photosynthetic light saturation point at 400 to 500 µmol∙m−2∙s−1 [13] . The maximum PAR on a sunny day in June at latitude 59˚ north is about 65∙mol∙m−2∙day−1 including PFD levels of up to 1900 µmol∙m−2∙s−1 (Figure 2). Inside a greenhouse with 60% light transmission, the PAR will then be about 39 mol∙m−2∙day−1. Presuming that the maximum useable PFD is 400 µmol∙m−2∙s−1, the efficient PAR will be about 20 mol∙m−2∙day−1 (all PFD values > 400 are given a value of 400 µmol∙m−2∙s−1). Therefore, care should be taken when the effect of a daylight integral (DLI) including PFD of up to 1200 µmol∙m−2∙s−1 is compared with the same PAR produced by artificial lighting with PFD of up to 200 - 300 µmol∙m−2∙s−1 which is below the saturating point of photosynthesis. Experiments have shown that a lighting period of about 20 h∙day−1 is the most effective if a defined daily PAR should be given for plant growth [14] [15] . Although a defined PFD is known to saturate photosynthesis, this does not necessarily mean that the plants can benefit from such a high PFD given over many hours [13] . The motivation for the present study was a desire to give a comprehensive overview of how differently important flowering greenhouse pot plants respond to a range of PFD and PAR levels given by supplementary lighting at very low natural light conditions in midwinter. The present study included ten different flowering pot plants, and the experiments were performed with 18 different combinations of PFD and air temperature. Some of the cultivars used may not be popular today. However, they are assumed to represent the typical response of the species. The experiments were conducted in a greenhouse at latitude 59˚ north during midwinter. Therefore there was very little natural light.
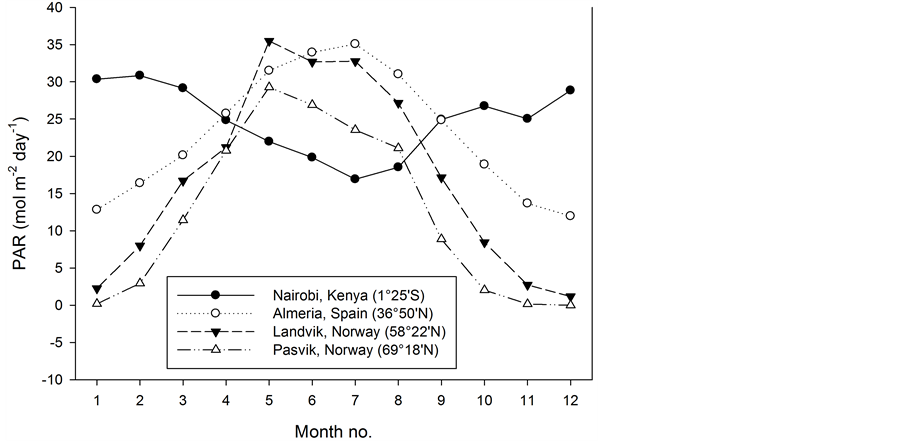
Figure 1. Photosynthetic active radiation (PAR) at different latitudes inside a greenhouse (60% transmission) throughout one year, given as daily means per month [1] [2] . A conversion factor of 7.9 mol per 1.0 kWh was used.
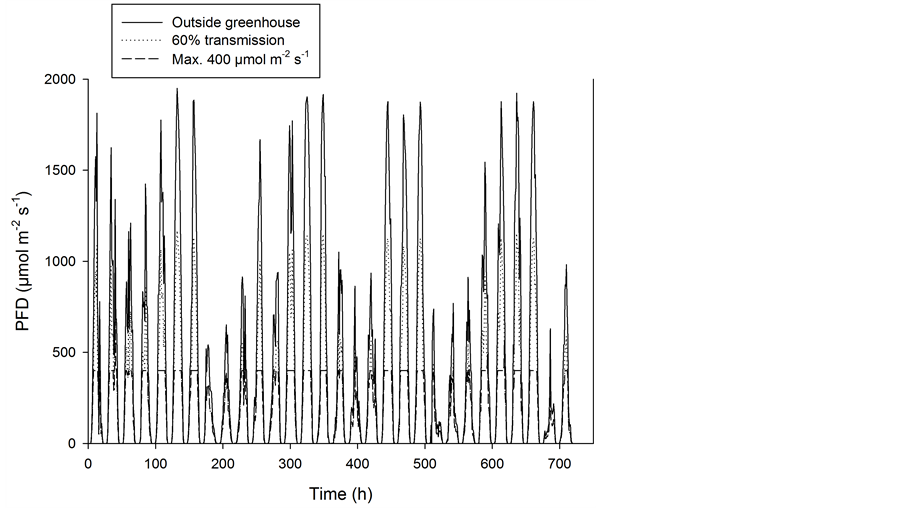
Figure 2. The photon flux density (PFD) measured on an hourly basis throughout June 2012 at Bioforsk Landvik (latitude 58˚22' north) [1] . Outside PFD as well as levels inside a greenhouse with 60% transmission is given. All PFD levels > 400 are given a value of 400.
2. Material and Methods
This study included small plants of ten different flowering pot plant species, and the experiments started on different dates: Hibiscus rosa-sinensis “Holiday Red” (14 November, 3.9 g dry weight at start of experiment), Rosa sp. “Milana” (12 December), Sinningia speciosa “Avanti F1” (9 November, 0.9 g dry weight), Gerbera hybrida (4 November, 0.17 g dry weight), Kalanchoe blossfeldiana “Rarakoe” (3 November), Hydrangea “Low Blue” (11 January), Begonia x hiemalis “Ilona”(11 November, 1.8 g dry weight), Calceolaria “Portia F1” (9 November, 0.18 g dry weight), Cyclamen persicum (7 November, 0.9 g dry weight) and Pelargonium domesticum “Mozart” (7 November, 0.3 g dry weight) were used in the study. The Hibiscus plants were cut above three leaves, the miniature roses were cut 3 cm above the pot edge (five cuttings per pot) and the experiment started after the second pinching. Pre-cooled plants of Hydrangea were used. The Kalanchoe plants had been pre-treated with short days (10 h) for five weeks for flower initiation before the start of the experiment. The Begonia plants were pre-treated for three weeks with a lighting period of 10 h∙day−1 at 75 µmol∙m−2∙s−1 PFD before the start of the experiment. The experiments were carried out between 3 November and 10 March.
The plants were grown in standard fertilized peat (Floralux, Nittedal Industrier) in 12 cm pots, and they were watered regularly with a complete nutrient solution. Salinity was maintained at about 2.0 mS∙cm−1 (electrical conductivity) and the pH at 5.0 to 5.5. Six PFD (85, 130, 170, 210, 255 and 300 µmol∙m−2∙s−1) were established by means of high pressure sodium lamps (Philips SON/T) in three different greenhouse compartments at 18.0˚C ± 0.5˚C, 21.0˚C ± 0.5˚C and 24˚C ± 0.5˚C. The lighting period was 20 h∙day−1. The mean contribution by daylight between 3 November and 31 January was 0.8 ± 0.7 mol∙m−2∙day−1; between 1 February and 10 March, it was 3.5 ± 2.7 mol∙m−2∙day−1. The total PAR levels throughout, including the six different supplementary PFD levels, are given in Figure 3. The CO2 concentration was kept at 600 ± 100 µmol∙mol−1, and the relative humidity was about 70% in the 18˚C and 21˚C compartments and about 60% in the 24˚C compartment. Although the air temperatures in the three greenhouse compartments were kept quite constant, the different irradiance levels caused different air temperatures in the microclimates above the plants due to the heating effect of the lamps. This resulted in a temperature increase of about 2˚C at the highest PFD level in the three temperature treatments (Figure 4). In addition to this, the plant temperature increased above the surrounding air temperature due to heat radiation from the lamps. The mean increase in the temperatures of five species’ leaves when exposed directly to
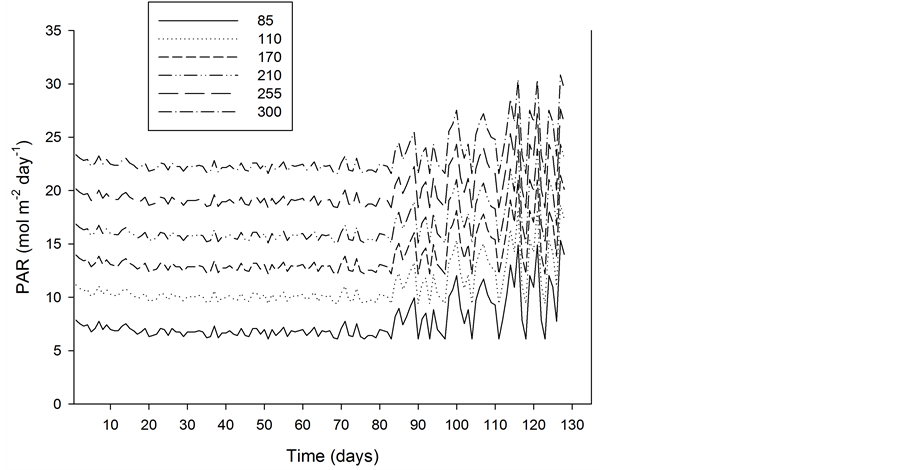
Figure 3. The PFD (µmol m-2∙s-1) during the total period of the study (from 3 November until 10 March) at the six different levels of supplementary lighting.
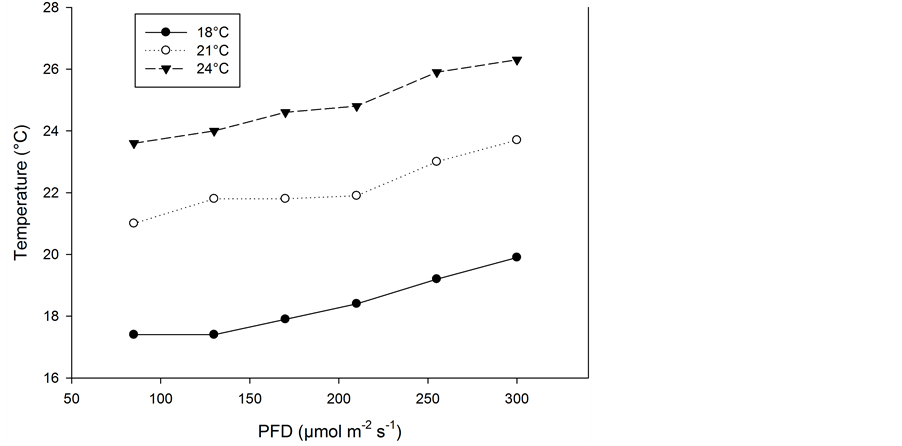
Figure 4. Air temperature close to the plants when grown at six PFD levels with greenhouse temperatures of 18˚C, 21˚C and 24˚C.
light (not in shade) ranged from 1.5˚C to 5˚C higher than the air temperature from the lowest PFD to the highest (Figure 5). Due to the lack of ventilation in the greenhouse at this time of the year, there was little air movement in the compartments. The result of this temperature rise was that at maximum PFD, the plant temperature could reach about 30˚C in the 24˚C air temperature treatment.
At the time of saleable stage (defined as 1 to 5 open flowers, depending on species, except in Kalanchoe, where 10 open flowers were needed), 6 to 12 plants were harvested per treatment and species. Days until saleable stage, plant fresh and dry weight, and number of flowers and flower buds were recorded. In addition a decortive value index (DI) was visually determined on a scale from 1 to 9, with 0 to 2 equalling no decorative value, 3 to 4 equalling low decorative value, 5 to 6 equalling medium decorative value and 7 to 9 equalling high decorative value. An index of at least 5 was assumed to be the minimum required for a saleable plant. The decorative
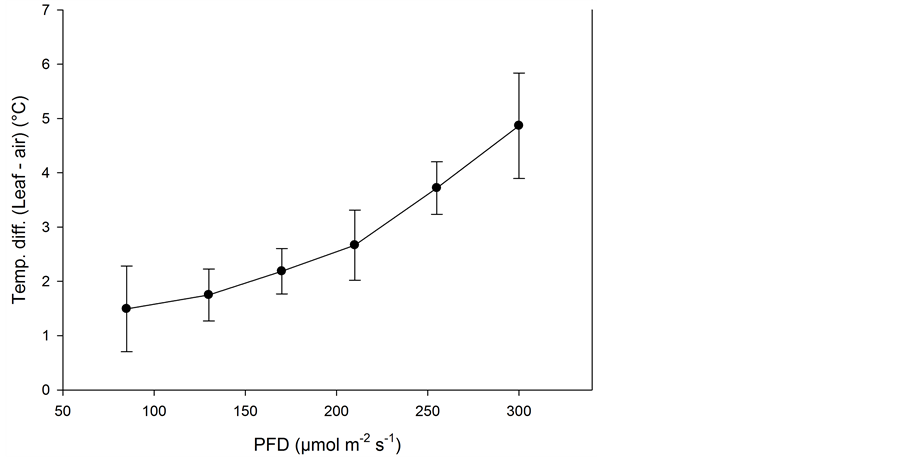
Figure 5. Temperature differences between the leaf and the air (close to the leaves) measured at six PFD levels as means of five species (n = 5, ±SE).
value was determined by taking into account the number of flowers, leaf colour/injuries and plant morphology (compactness). It should be mentioned that chemical growth retardants were not used in the experiment.
3. Results
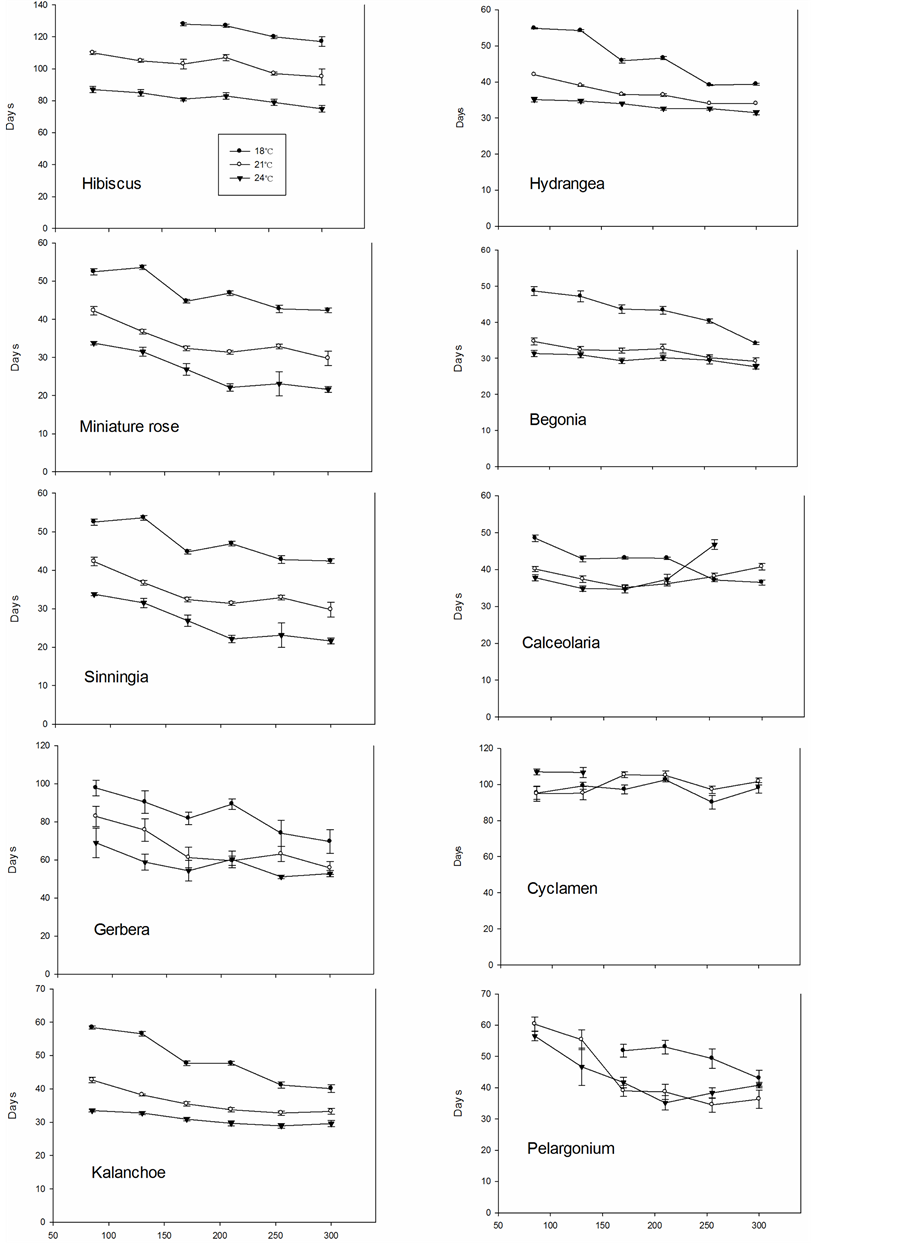
Time until flowering decreased in all species except Cyclamen when the temperature increased from 18˚C to 21˚C, particularly at the lower PFD levels (Figure 5). A further increase from 21˚C to 24˚C clearly decreased the time until flowering in six of ten species. At 18˚C and low PFD, flowering was significantly delayed in Hibiscus: it was still not flowering at the end of the experiment after 130 days. Cyclamen did not flower at 24˚C above 130 µmol∙m−2∙s−1 PFD, while Pelargonium did not flower below 170 µmol∙m−2∙s−1 at 18˚C within the experimental period (Figure 6). Increasing the temperature from 18˚C to 24˚C decreased time until flowering by about 50 days in Hibiscus, 20 days in both miniature roses and Sinningia, 30 days in Gerbera, 15 days in Kalanchoe, 10 to 15 days in Hydrangea, 15 days in Begonia, 5 to 10 days in Calceolaria and 10 days in Pelargonium at intermediate PFD levels. This represented a reduction of between 20% and 40% in the time until flowering. Generally, the time until flowering gradually decreased with increasing PFD except in Calceolaria and Cyclamen. The Calceolaria plants died at the highest PFD at 24˚C.
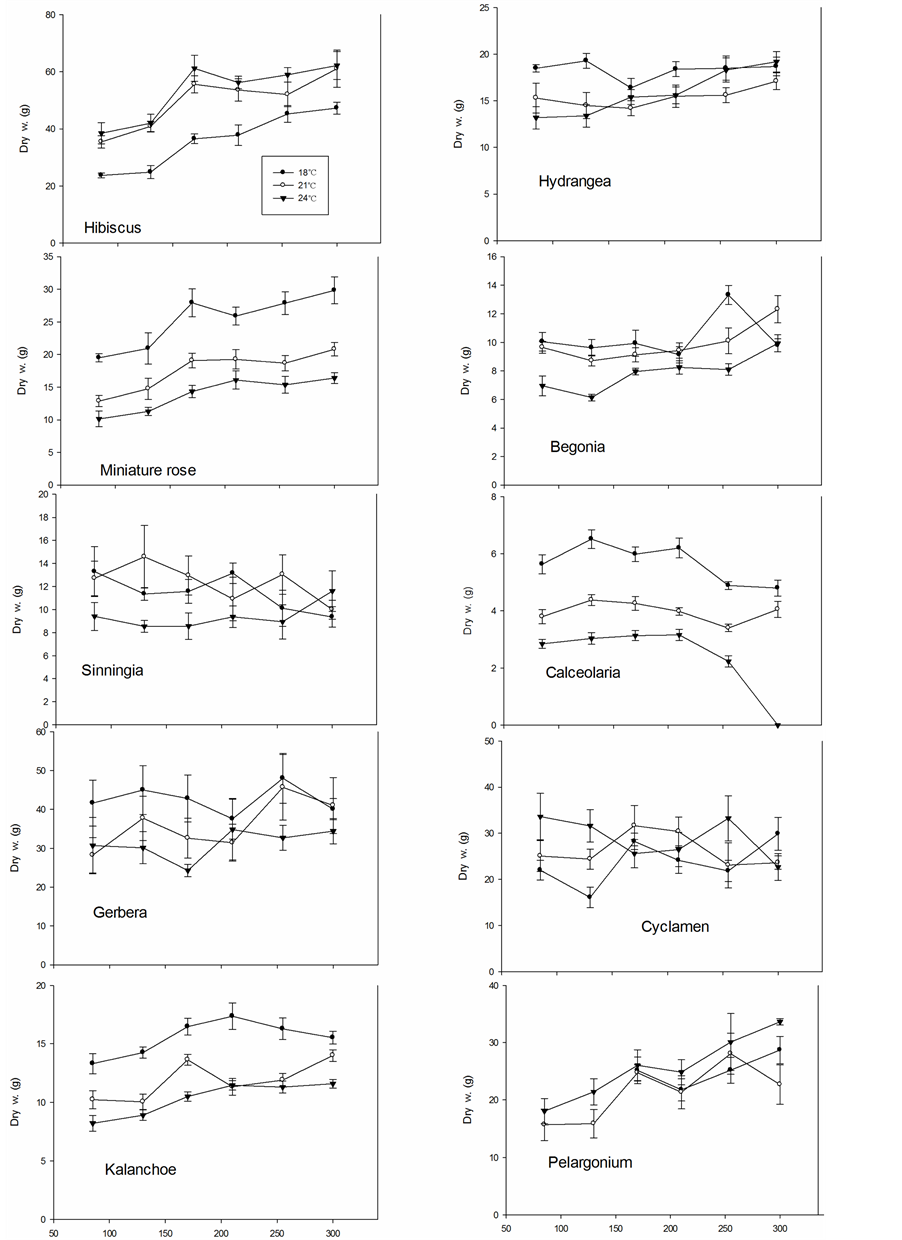
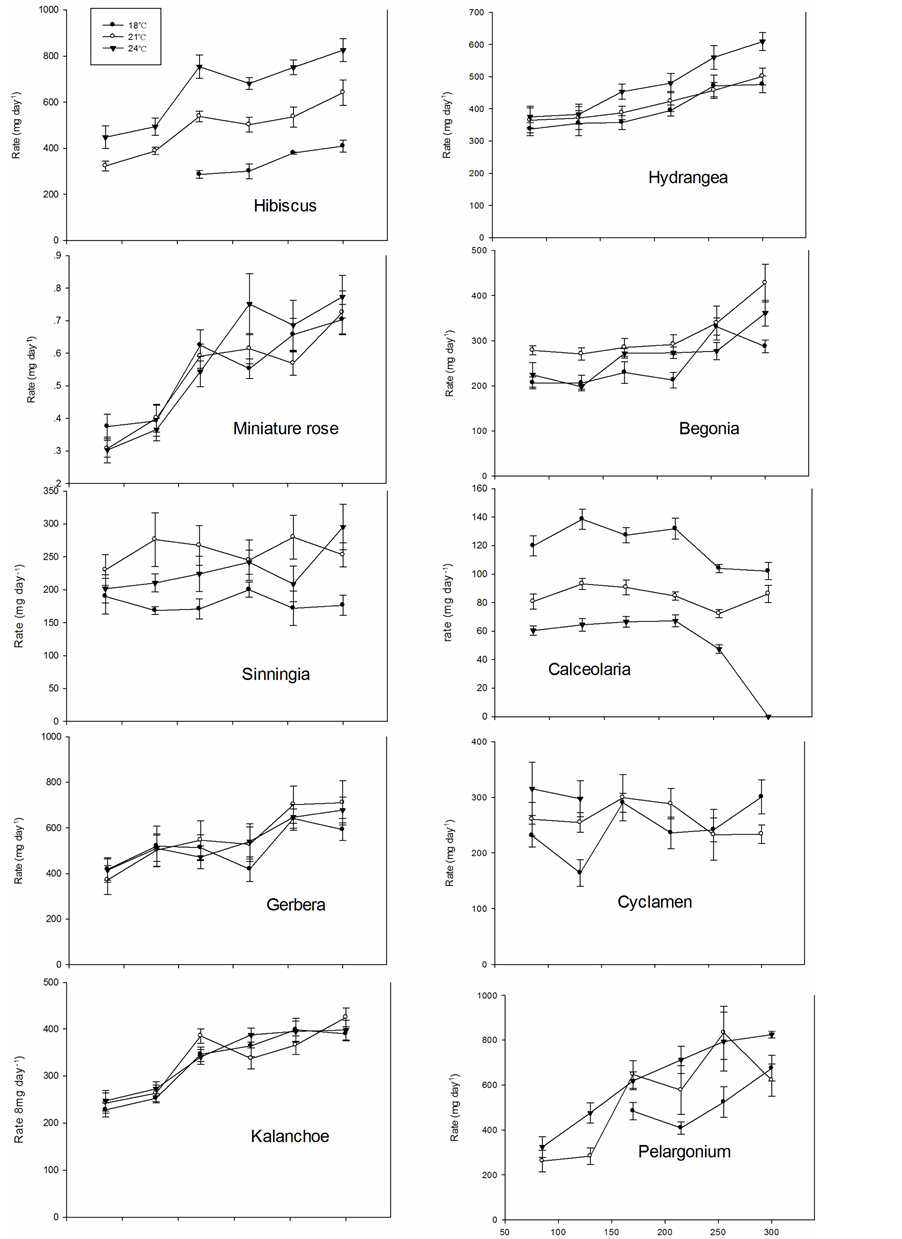
The dry weight of the plants at time of flowering (saleable stage) increased up to 170 µmol∙m−2∙s−1 PFD in Hibiscus, miniature rose, Kalanchoe and Pelargonium, while the dry weight had reached its maximum at 85 to 130 µmol∙m−2∙s−1 PFD in the other species (Figure 7). The highest dry weight was generally obtained at 18˚C in miniature roses, Gerbera, Kalanchoe, Hydrangea and Calceolaria; at 18˚C to 21˚C in Sinningia and Begonia; and at 21˚C to 24˚C in Hibiscus, Cyclamen and Pelargonium. The growth rates (mean dry weight increase per day in mg until flowering) for miniature roses, Gerbera and Kalanchoe were little affected by temperature, while 18˚C gave the highest rate in Calceolaria, 21˚C in Sinningia and Begonia, and 24˚C in Hibiscus and Hydrangea (Figure 8). In Cyclamen the rate was the highest at 24˚C at the lower PFD, however, failed to flower at higher PFD.
The number of branches in Hibiscus followed the same pattern as the dry weight and increased from 4 to 6 at 18˚C to 10 to 15 at 24˚C. The number of flowers and flower buds with visible colour at saleable stage in miniature roses increased from 85 to 170 µmol∙m−2∙s−1 PFD (from about 25 to 40 flowers per pot); it was the same at 18˚C and 21˚C but was slightly lower at 24˚C (maximum 30 flowers).
The decorative value index (DI) can be summarized as follows (data not presented): in miniature roses (DI 6 to 7), Sinningia (DI 6 to 7), Begonia (DI 7 to 9), Hydrangea (DI 7 to 9) and Gerbera (DI 6) irrespective of the treatment. In Kalanchoe the DI was 6 to 7 except at the highest PFD levels at 24˚C, when it was 5 to 6. In Cyc-
PDF (μmol∙m-2∙s-1) PDF (μmol∙m-2∙s-1)
Figure 6. Time until flowering in ten different plant species grown at three air temperatures and six PFD levels.
PDF (μmol∙m-2∙s-1) PDF (μmol∙m-2∙s-1)
Figure 7. The dry weight at the stage of flowering in ten different plant species grown at three air temperatures and six PFD levels.
PDF (μmol∙m-2∙s-1) PDF (μmol∙m-2∙s-1)
Figure 8. The mean growth rate (dry weight increase per day in mg) in ten different plant species as affected by three air temperatures and six PFD levels.
lamen at 18˚C and 21˚C, the DI was 6 to 7 at 85 to 210 µmol∙m−2∙s−1 PFD, it was and 4 to 6 at the highest PFD levels. At 24˚C the DI was 5 to 7 at the lowest and 3 to 4 at the highest PFD levels. In Pelargonium at the lowest light levels, DI was 3, and it increased to 7to 9 at 170 to 300 µmol∙m−2∙s−1 PFD. In Calceolaria DI was 6 to 7 at the lowest PFD levels, irrespective of temperature, while it decreased to 4 to 6 at the highest PFD levels. The plants died at the highest temperature and PFD. In Hibiscus DI was 2 to 3 irrespective of PFD at 18˚C, 2 to 4 at low PFD and 5 to −7 at high PFD at 21˚C and 5 to 7 at 24˚C irrespective of PFD. Table 1 summarizes the PAR and air temperatures that can be recommended for the different species based on the present results. It also mentions the visible injuries that appeared.
4. Discussion
Care should be taken when interpreting the results from experiments in which the effects of light and temperature on plant growth are studied. The light level will influence the temperature of the microclimate around the plant as well as the plant temperature, which may be significantly higher than the temperature measured in the greenhouse compartment (Figure 4). This temperature gradient will depend on the air circulation around the plants. This was very low in the present investigation because of closed vents in the greenhouse compartments. In growth chambers with constant ventilation, such gradients will be much less important. A problem also arises when defining an optimal DLI or PAR for plants since this integral usually includes light levels above the saturation level for photosynthesis [13] , exemplified by a drop of about 50% in efficient PAR (PFD above 400 µmol∙m−2∙day−1 had no effect)) on sunny days in summer at latitude 59˚ north (Figure 2). At lower latitudes this reduction will be even higher due to a higher solar elevation and higher maximum PFD. There may be no direct effect of PFD > 400 µmol∙m−2∙s−1 on photosynthesis; however, the light will cause an increase in the temperature around the plant as well as in the temperature of the plant itself. Therefore, an effect of high PFD can be a rise in temperature, as was clear the case in the present study. The different conditions arising during cultivation in midwinter with supplementary lighting as compared to cultivation with daylight during other parts of the year most likely result in a lower optimal PAR for efficient plant production. Higher CO2 concentrations in the greenhouse air during the winter, when there is little ventilation of the greenhouse, will also often increase both plant growth (20% to 30%) and the optimum temperature for plant growth [16] . It is also likely that the plants tolerate higher maximum temperatures at elevated CO2 concentrations [17] .
Increasing the temperature promoted flowering but decreased the plant dry weight and number of flowers during flowering for most of the species in the present study. This is in accordance with previous results in studies with ornamental annual plants [5] [18] . Time until flowering progressively decreased in Salvia when the temperature increased from 14˚C to 27˚C and the DLI increased from 5 to 25 mol∙m−2∙day−1, and shoot dry weight at the flowering stage reached its maximum at 12 to 16 mol∙m−2∙day−1, while marigolds’ highest dry weight was achieved when the highest DLI was applied [5] .

Table 1. Recommended photosynthetic active radiation (PAR) using artificial lighting and recommended greenhouse air temperatures for the different plant species based on the present study. Observed visible injuries are described.
In a study of the growth of 18 annual bedding plants with a temperature range from 5˚C to 30˚C and at a constant PAR of about 10 mol∙m−2∙day−1, the earliest flowering occurred at 20˚C in one species, at 25˚C in 11 species and at >30˚C in the remaining species [6] . In Hibiscus the rate of leaf unfolding was found to increase up to 32˚C in study including temperatures from 5˚C to 35˚C [19] . The flower development rate in Petunia increased up to about 14 mol∙m−2∙day−1 [20] . In accordance with the present results an optimal temperature of about 20˚C for a rapid leaf development has previously been recommended for Cyclamen [21] .
For most light-demanding species, such as miniature roses and Hibiscus in the present study, supplementary lighting of about 200 µmol m−2∙s−1 PFD given for 20 h∙day−1 (about 15 mol∙m−2∙day−1 PAR) is optimal in CO2- enriched air. In less light-demanding species close to half of this PAR is sufficient. The chosen temperature, which is often closely related to time until flowering, depends on desired plant size and number of flowers and flower buds at the saleable stage. It will probably often be of benefit to increase the PFD to some extent when the temperature is increased.
Acknowledgements
This work was funded by the Norwegian Research Council and the Norwegian Growers Association.
References
- Hidén, C. and Larsen, R.U. (1994) Predicting Flower Development in Greenhouse Grown Chrysanthemum. Scientia Horticulturae, 58, 123-138. http://dx.doi.org/10.1016/0304-4238(94)90133-3
- Adams, S.R., Pearson, S., Hadley, P. and Patefield, W.M. (1999) The Effect of Temperature and Light Integral on the Phases of Photoperiod Sensitivity in Petunia x hybrid. Annals of Botany, 83, 263-269.http://dx.doi.org/10.1006/anbo.1998.0817
- White, J.W. and Warrington, I.J. (1998) Temperature and Light Integral Effectson Growth and Flowering of Hybrid Geraniums. Journal of American Society for Horticultural Science, 113, 354-359.
- Steininger, J., Pasian, C.C. and Lieth, J.H. (2002) Extension of Thermal Unit Model to Represent Nonlinearity in Temperature Response of Miniature Rose Development. Journal of American Society for Horticultural Science, 127, 349-354.
- Moccaldi, L.A. and Runkle, E.S. (2007) Modeling the Effects of Temperature and Photosynthetic Daily Light Integral on Growth and Flowering of Salvia splendens and Tagetespatula. Journal of American Society of Horticultural Science, 132, 283-288.
- Blanchard, M.G. and Runkle, E.S. (2011) Quantifying the Thermal Flowering Rates of Eighteen Species of Annual Bedding Plants. Scientia Horticulturae, 128, 30-37. http://dx.doi.org/10.1016/j.scienta.2010.12.010
- Agricultural Meteorological Service (LMT) Bioforsk, Norway. www.bioforsk.no
- PVCDROM, 2.5 Solar Radiation Data, Average Daily Solar Radiation. www.pveducation.org
- IPCC (2013) Climate Change 2013: The Physical Science Basis. Contribution of Working Group I to the Fifth Assessment Report of the Intergovernmental Panel on Climate Change. In: Stocker, T.F., Qin, D., Plattner, G.-K., Tignor, M., Allen, S.K., Boschung, J., Nauels, A., Xia, Y., Bex, V. and Midgley, P.M., Eds., Climate Change 2013: The Physical Science basis, Cambridge University Press, Cambridge.
- Jiao, J., Tsujita, M.J. and Grodzinski, B. (1991) Influence of Radiation and CO2 Enrichment on Whole Plant Net CO2 Exchange in Roses. Canadian Journal of Plant Science, 71, 245-252. http://dx.doi.org/10.4141/cjps91-034
- Mortensen, L.M., Ringsevjen, F. and Gislerød, H.R. (1012) The Effect of CO2 Concentration on the CO2 Exchange Rate in a Small Plant Stand of Cucumber during Different Periods of the Day. European Journal of Plant Science, 77, 24-30.
- Hückstädt, A., Suthaparan, A., Mortensen, L.M. and Gislerød, H.R. (2013) The Effect of Low Night and High Day Temperatures on Photosynthesis in Tomato. American Journal of Plant Sciences, 4, 2323-2331.http://dx.doi.org/10.4236/ajps.2013.412288
- Mortensen, L.M. (2014) The Effect of Wide-Range Photosynthetic Active Radiations on Photosynthesis, Growth and Flowering of Rosa sp. and Kalanchoe blossfeldiana. American Journal of Plant Sciences, 5, 1489-1498.
- Gislerød, H.R., Eidsten, I.M. and Mortensen, L.M. (1989) The Interaction of Daily Lighting Period and Light Intensity on Growth of Some Greenhouse Plants. Scientia Horticulturae, 38, 295-304.http://dx.doi.org/10.1016/0304-4238(89)90077-0
- Mortensen, L.M. (2014) The Effect of Photon Flux Density and Lighting Period on Growth, Flowering, Powdery Mildew and Water Relations of Miniature Roses. American Journal of Plant Sciences.
- Mortensen, L.M. (1987) CO2 Enrichment in Greenhouses. Crop Responses. Scientia Horticulturae, 33, 1-25.http://dx.doi.org/10.1016/0304-4238(87)90028-8
- Taub, D.R., Seemann, J.R. and Coleman, J.S. (2000) Growth in Elevated CO2 Protects Photosynthesis against High-Temperature Damage. Plant, Cell and Environment, 23, 649-656. http://dx.doi.org/10.1046/j.1365-3040.2000.00574.x
- Warner, R.M. and Erwin, J.E. (2005) Prolonged High Temperature Exposure and Daily Light Integral Impact Growth and Flowering of Five Herbaceous Ornamental Species. Journal of the American Society for Horticultural Science, 130, 283-288.
- Karlsson, M.G., Heins, R.D. and Gerberick, J.O. (1991) Temperature Driven Leaf Unfolding Rate in Hibiscus rosa-sinensis. Scientia Horticulturae, 45, 323-331. http://dx.doi.org/10.1016/0304-4238(91)90078-D
- Blanchard, M.G., Runkle, E.S. and Fisher, P.R. (2011) Modeling Plant Morphology and Development of Petunia in Response to Temperature and Photosynthetic Light Integral. Scientia Horticulturae, 129, 313-320.http://dx.doi.org/10.1016/j.scienta.2011.03.044
- Karlsson, M. and Werner, J. (2001) Temperature Affects Leaf Unfolding Rate and Flowering of Cyclamen. HortScience, 36, 292-294.