Advances in Microbiology
Vol.2 No.4(2012), Article ID:25849,9 pages DOI:10.4236/aim.2012.24062
Optimization of Production and Preliminary Characterization of New Exopolysaccharides from Gluconacetobacter hansenii LMG1524
1Unit of Biological and Industrial Biochemistry, Ulg—Gembloux Agro-Bio Tech, Gembloux, Belgium
2Materia-Nova, Ghislenghien, Belgium
Email: *evalepyn@ulg.ac.be
Received September 16, 2012; revised October 22, 2012; accepted November 4, 2012
Keywords: Gluconacetobacter hansenii; Extracellular Polysaccharides; Culture Conditions; Medium Composition; Orthogonal Design
ABSTRACT
The influence of different carbon and nitrogen sources, of ethanol concentration, the optimal pH, temperature and medium composition were evaluated on extracellular polysaccharides (EPS) synthesis and bacterial growth of Gluconacetobacter hansenii LMG1524, and preliminary characterization of EPS was investigated. The highest EPS yields were obtained using glycerol and ammonium sulphate as carbon and nitrogen sources, respectively. The increase of ethanol concentration in the medium did not influence the EPS synthesis but reduced the bacterial growth. The optimum temperature and pH for polysaccharides production were respectively 25˚C and 5; whereas for cell growth were respectively 30˚C and 4. The optimal culture medium composition was determined as follows: 10 g/L sucrose, 0.892 g/L (NH4)2SO4, 0.34 g/L NaNO3, 3 mL acetic acid, 1.5 g/L KH2PO4, 1.5 g/L K2HPO4 and 0.6 g/L MgSO4. The polysaccharides produced were of 14 and 10 polymerization degrees (DP) and constituted mainly of glucose, galactose and mannose, in relative percent of 36.36, 33.94 and 22.42, respectively.
1. Introduction
Polysaccharides are well known as gelling agents, viscosifiers and stabilizers. These properties make them very interesting for many industrial fields. But the cheapest and most abundant polysaccharides are those from plant sources, as for examples: cellulose, Arabic gum, pectin and starch. The microbial EPS are generally expensive, with the exception of xanthan, because yields are low even when produced under optimal conditions. Another barrier to their commercialization in the food or pharmaceutical industry is the cost of obtaining regulatory approval [1].
However, microbial polysaccharides can be comercialized when they are used in specific market niche and they are very high-value products, because low production yields are less important. Two examples are: hyaluronic acid from group C streptococci which is used in medical fields as surgery and cutaneous wound healing [2] and bacterial cellulose which is used for acoustic membranes and wound dressing [3].
Gluconacetobacter hansenii PJK is known to produce glucuronic acid oligomers [4,5] which, due to the structures similarities with alginate oligomers, are expected to have at least eliciting activities [6,7]. Moreover G. hansenii was formerly named Acetobacter hansenii by Gosselé [8] and the genus Acetobacter contains species which produce other water-soluble heteropolysaccharides. For example A. xylinum secretes “acetan”, a polysaccharide containing glucose, mannose, glucuronic acid and rhamnose [9], whereas Acetobacter IFR101 produces a polysaccharide constituted of mannose, galactose and glucose [10] and other species producing similar EPS [11-13]. The acetan has a similar structure to xanthan [9] which is commercialized by several firms for food or non food applications, its controlled degradation might lead to oligosaccharides with bioactive properties [14]. Thus, in both cases the genus Gluconacetobacter and Acetobacter produce extracellular polysaccharides of interest and are non pathogenic.
Here, we have decided to explore a strain of this family, named: G. hansenii LMG1524 which former name was A. aceti subsp. xylinus and which is also present in other collections as G. hansenii ATCC 23769 known to produce polysaccharides composed of the constitution sugars of acetan [15] and particularly, mannose. Mannose which is known as the principal constituent of carbohydrates present on host cells surface and to which bind the bacterial surface lectins, means of adhesion expressed by bacteria prior to infection. Starting from this mechanism, anti-adhesion drugs for infectious diseases has been developed based on mannose, its derivatives and oligosaccharides [16-18]. Thus the EPS from G. hansenii LMG1524 are potentially of high-added value.
The EPS production yield of a bacterium is influenced by culture conditions and medium composition [19,20]. Furthermore, the design of these parameters is important for improving the efficiency of synthesis in liquid medium. Orthogonal design is one of the statistical experimental design method most used to find the best medium for EPS production. It permits to optimize several factors in the same time and much quantitative information can be obtained by only few experimental trials [21]. The aim of this work was to study the effects of medium components and environmental parameters on EPS synthesis, to find the optimal medium composition for the EPS production using orthogonal design of experiments and confirm the presence of active components of the attained EPS.
2. Materials and Methods
2.1. Bacterial Strain, Culture Media and Conditions
G. hansenii LMG1524 was purchased from BCCM/LMG Bacteria Collection, Gent, Belgium. It was maintained and subcultured monthly on agar slants containing (g/L): mannitol, 25; yeast extract, 5; peptone, 3 and agar, 15.
A basal liquid medium was used for the study of pH, temperature and ethanol concentration effects on EPS production and bacterial growth in shake flasks which contained (g/L): glucose, 10; yeast extract, 10; peptone, 7; acetic acid, 1.5mL and succinate, 0.2.
2.2. Optimisation of Culture Medium for EPS Production
The salt base of the medium for the study of C and N source effects on EPS production and bacterial growth in shake flasks had the following composition (g/L): K2HPO4, 0.5; KH2PO4, 0.5; MgSO4·7H2O, 0.2; NaCl, 0.2; CaCl2·2H2O, 0.04; FeCl3·6H2O, 0.0025; MnCl2·4H2O, 0.001; NaMoO4·2H2O, 1 × 10⁻⁵; ZnSO4·7H2O, 1 × 10⁻⁵; CuSO4·7H2O, 1 × 10⁻⁵; H3BO3, 1 × 10⁻⁵; CoCl2·6H2O, 1 × 10⁻⁵. The pH was set to 5 before sterilisation of the medium. Unless otherwise stated, all cultivations were carried out in 250 mL Erlenmeyer flasks containing 50 mL of the medium at 30˚C for 120 h on a rotary shaker set at 150 rpm. Flasks were inoculated with 4% (v/v) preculture grown overnight.
A seven factor-three level orthogonal design was applied to optimise the medium composition for EPS synthesis with the optimal nitrogen source and one of the most optimal carbon source. The orthogonal design of the culture medium with variable sources and levels is presented in Table 1. G. hansenii LMG1524 was cultured in a 250 mL flask containing 50 mL culture medium in a rotary shaker (80 rpm) at 30˚C, pH 4.5 for 5 days in all aforementioned experiments. NaOH and HCl have been used to regulate the pH.
2.3. Fermentor Experiment
Cultivations were performed in a 3 litres fermentor (Biostat A, Sartorius) with 2 litres working volume. Sterile air was supplied at a constant rate (0.5 vvm), agitation was maintained at 250 rpm and temperature was 30˚C. The medium was inoculated with 3% (v/v) preculture grown overnight in shake flask.
Growth was monitored by absorbance measurement at 600 nm, using a Genesys 10 UV scanning spectrophotometer (Thermo Spectronic).
2.4. Measurement of EPS Content and Dry Cell Weight (DCW)
Cells were harvested by centrifugation (11,000 rpm, 30 min) of the fermented culture broth. The cell pellet was dried in an oven at 105˚C to a constant weight. The polysaccharides present in the cell-free supernatant were then precipitated by adding three volumes of cold isopropanol and cooled to 4˚C overnight. The crude precipitate was collected by centrifugation (10,000 rpm, 30 min, 4˚C), resuspended in distilled water, reprecipitated twice with isopropanol and lyophilized. EPS content was measured by the phenol-sulphuric acid method using glucose as the standard [22].
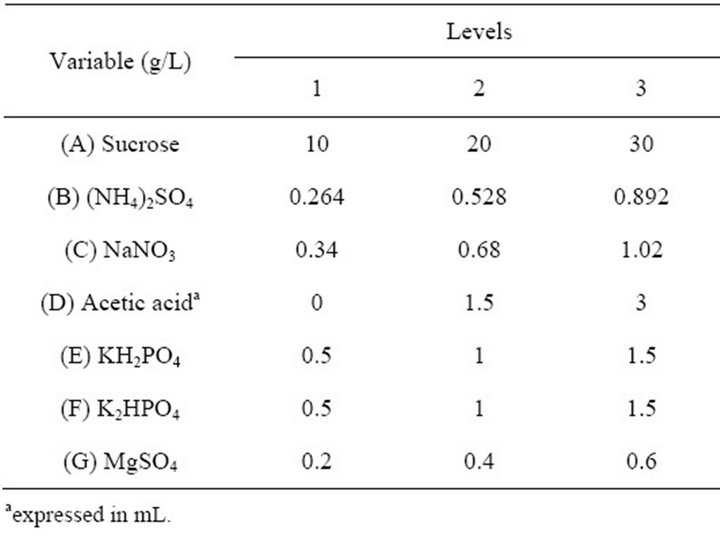
Table 1. Orthogonal design of culture medium optimisation.
2.5. Analysis
2.5.1. Determination of Carbohydrate, Protein and Uronic Acid Contents
Carbohydrate was quantified by the phenol-sulfuric acid method [22]. Protein content was measured by Coomassie blue colorimetric method using bovine serum albumin as the standard [23]. Glucuronic acid content was determined according to the method of m-hydroxydiphenyl using glucuronic acid as the standard [24].
2.5.2. Analysis of Monosaccharide Composition
Neutral sugars were identified and estimated quantitatively by acid hydrolysis of the polysaccharide [25], followed by conversion of the products to alditol acetates and their separation and identification by gas chromatographic (GC) analysis [26]. About 50 mg of lyophilized material was weighed into a glass tube, 3 mL of 1.25 mol/L chlorhydric acid in methanol was added, the tube was sealed and the mixture was heated at 100˚C during 3 h, ice cooled and evaporated at reduced pressure (35˚C). A second hydrolysis was done with 1 mL of 2 mol/L trifluoroacetic acid and the mixture was heated at 121˚C during 1 h. The tube was ice cooled and treated with 1 mL concentrated ammonia.
2-deoxyglucose (1 mL of solution at 1 mg/mL) was added as an internal standard. 400 µL of this solution was drawn and put in a special tube followed by addition of 2 mL of NaBH4 in DMSO (2 g in 100 mL), and the mixture kept at 40˚C for about 90 minutes. The sample was then acidified with glacial acetic acid, 0.4 mL of 1-methylimidazole and 4 mL acetic anhydride were added to the mixture. This sample was kept at room temperature during 15 minutes and partitioned between water (10 mL) and CH2Cl2 (3 mL). The organic phase was taken and analysed by GC. GC analysis was carried out in duplicate on a Shimadzu GC-2010 gas chromatograph, with an Agilent Technologies DB225 column (0.25 mm × 30 m). The carrier gas was helium and the temperature program was: 40˚C, +20˚C min–1 (9 min), 220˚C (30 min).
2.5.3. Molecular Weight Distribution Assay
The molecular weight profile of the polysaccharide was determined by gel permeation chromatography (GPC) on a 2695 Waters HPLC equipped with coupled TSKgel G4000PW × l and TSKgel G-oligo-PW columns (300 mm L × 7.8 mm ID) combined with a guard column at 40˚C and a Waters 2410 differential refractometer (RI). Polysaccharides solutions were filtered through 0.45 µm membrane filters and 100 µL were loaded onto the column. Elution was carried out with 50 mM sodium nitrate solution containing 0.05% sodium azide as preservative with a flow rate of 0.7 mL/min. Approximate molecular weight values were estimated by calibrating the column using aqueous solutions of dextran standards of known molecular weight.
3. Results and Discussion
3.1. Effects of pH and Temperature on EPS Synthesis and Bacterial Growth
Effect of initial pH on bacterial growth and EPS production was investigated in the range 4.0 - 7.0. Medium was adjusted to the required pH level by addition of HCl or NaOH before sterilization. As illustrated in Figure 1, the highest bacterial biomass was achieved when initial pH was 4 and the highest EPS production was obtained when initial pH was 5.
The effect of temperature on bacterial growth and EPS production was also studied at different temperatures (25˚C - 35˚C). The optimal temperature for bacterial growth was 30˚C while for EPS synthesis it was 25˚C as shown in Figure 2. The observation that lower temperatures markedly induce EPS production was also made with other Gram-negative bacteria [27-29]. This effect has been explained by the fact that carrier lipids are involved in synthesis of cell wall components as well as EPS biosynthesis. Due to a competition for these lipids, culture conditions resulting in slower growth such as low
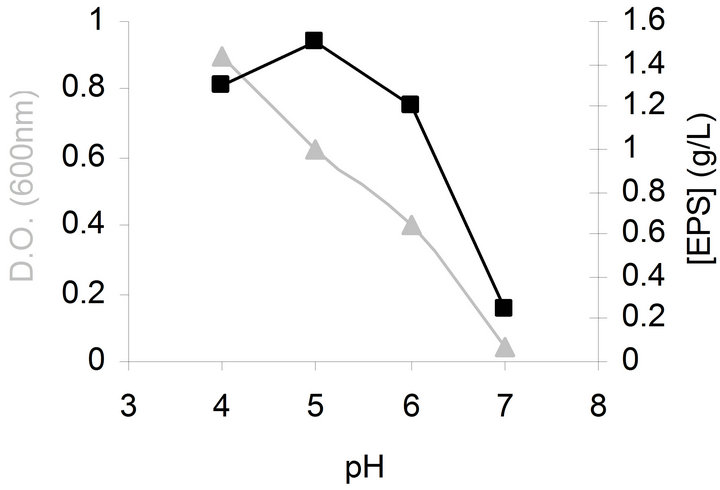
Figure 1. Effects of initial pH on bacterial growth (▲) and EPS production (■) by G. hansenii LMG1524.
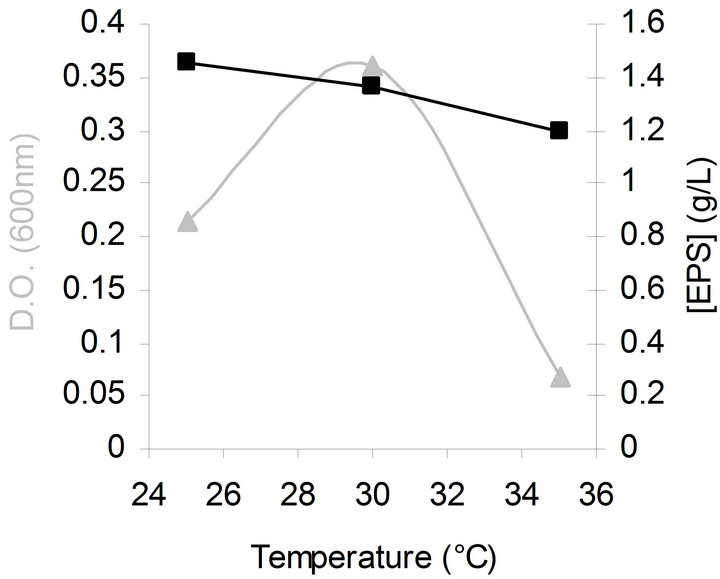
Figure 2. Effects of temperature on bacterial growth (▲) and EPS production (■) by G. hansenii LMG1524.
temperatures make more carrier lipids available for EPS production [20]. Following this theory and our results, it seems thus interesting to test the influence of a temperature shift on growth and EPS synthesis like done by Gamar-Nourani et al. [30]. We have tried to improve the bacterial growth and EPS synthesis by applying a temperature shift (30˚C to 19˚C) at the beginning of the exponential growth phase but the results have shown no enhancement (data not shown).
3.2. Effects of Carbon and Nitrogen Sources on Bacterial Growth and EPS Production
The type of carbon and nitrogen supplied as nutrients to bacteria are known to influence the EPS yields depending on their composition and relative amounts [19,31,32]. The influence of the carbon substrate on growth and EPS production by G. hansenii LMG1524 was studied in a medium containing a salt base (see Materials and Methods), 10 g/L of the carbon substrate and 1.5 g/L of sodium glutamate as the nitrogen source.
Among the various sources tested, alditols were the most suitable for EPS production with glycerol which gave rise to the highest value (0.3 g EPS/L), but the reproducibility of this value was the worst (standard deviation of 0.17 g EPS/L). Sorbitol and sucrose gave also interesting values (approximately 0.2 g EPS/L) (Table 2). The glucose was the best substrate for bacterial growth but the worst for specific EPS production. We could also notice that the EPS production yield was the highest at a final pH between 5 and 6, which was in concordance with the previous chapter results.
As a comparison, the highest productivity of cellulose by A. xylinum was reported using mannitol as carbon source followed by glucose and saccharose, but sorbitol was a poor substrate [33].
The effect of N substrate on growth and EPS production by G. hansenii LMG1524 was studied in a medium containing 10 g/L of sucrose and the salt base. N substrates were added at a concentration corresponding to
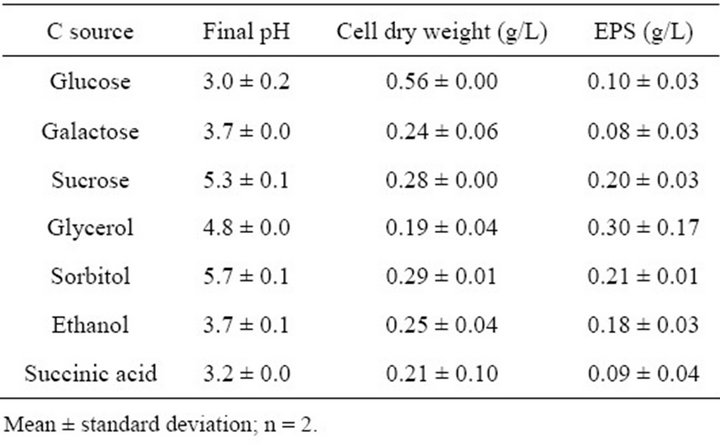
Table 2. Effects of the carbon source on bacterial growth and EPS production by G. hansenii LMG1524.
0.112 g/L of nitrogen, based on the publication of Stredansky et al. [32], the results of Khan et al. [5] showing that G. hansenii PJK produces water soluble oligosaccharides efficiently even in the absence of a nitrogen source and the general observation that when the C/N ratio is high, the bacteria modify the cellular growth pathway towards EPS production, since there is insufficient nitrogen for protein synthesis [31].
Various nitrogen sources were tested and those supplied with CaCO3 to buffer the medium acidification gave the best results in term of bacterial growth and EPS synthesis (Table 3). They were more particularly, the amino acids supplied with CaCO3 which gave the highest biomass production and cysteine was the best one (0.77 g biomass/L), noteworthy the final pH was also the highest in this case. In terms of EPS production, ammonium sulphate was the best source with 1.22 g EPS/L.
3.3. Influence of the Ethanol Concentration on Bacterial Growth and EPS Production
Starting from the results of Jung et al. [34] on G. hansenii PJK, which show that supplementation of ethanol to the medium, increased the amount of water soluble polysaccharide produced during cultivation; we tested the influence of ethanol concentration on EPS production by G. hansenii LMG1524.
An increase in ethanol concentration decreased the bacterial growth especially between 0.1% and 0.5% of ethanol, after that a supplemental increases of ethanol concentration had no effect on biomass (Figure 3). However, the ethanol concentration of the culture medium seemed to have no effect on EPS production.
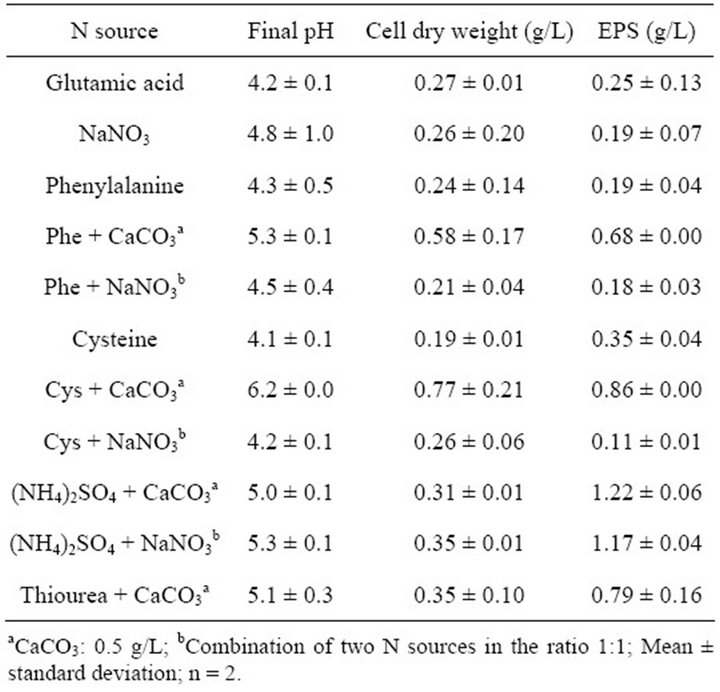
Table 3. Effects of the nitrogen source on bacterial growth and EPS production by G. hansenii LMG1524.
Interestingly, these results are in accordance with a study made on another species of Gluconacetobacter: G. xylinus I2281, showing that in the presence of ethanol the bacterial growth was strongly reduced and gluconacetan yields were not affected [35].
3.4. Medium Optimisation for EPS Production by Orthogonal Design
As sucrose is one of the best carbon source after glycerol,
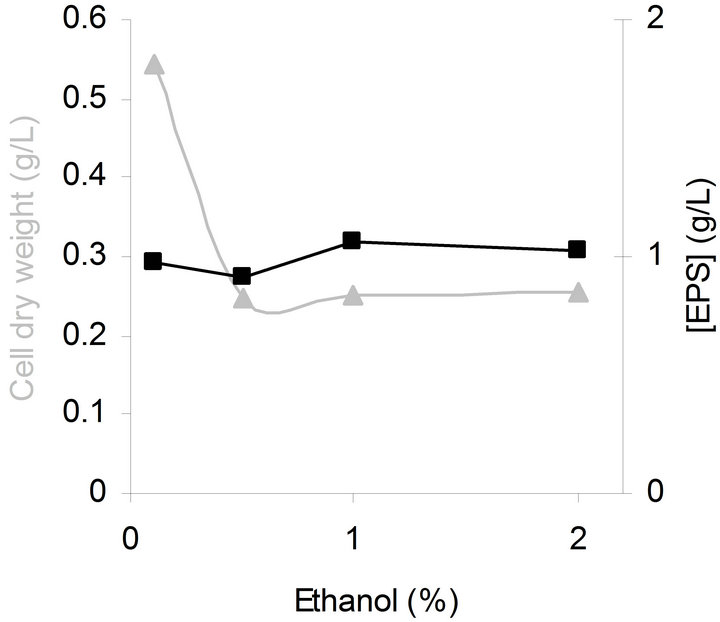
Figure 3. Influence of ethanol concentration on bacterial growth (▲) and EPS production (■) by G. hansenii LMG1524 grown at 30˚C, 150 rpm, pH 5 during 2 days.
that last giving problems of reproducibility, and as ammonium sulphate is the best nitrogen source, they were chosen to optimise the medium composition. Considering that growth of G. hansenii occurs in the presence of 0.35% acetic acid [8], that ions like phosphate could increase the EPS production [32] and that magnesium activate enzymes implicated in EPS biosynthesis [36]. An orthogonal design carrying out these components was used for the optimisation of culture medium composition (Table 1).
The results are presented in Table 4. At first sight, we can notice from this table that one medium composition distance oneself from the others for EPS production; it is the medium n˚3, with 3.119 g EPS/L.
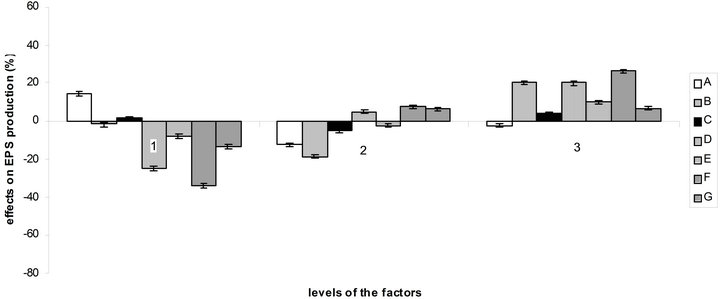
According to the orthogonal design, the effect of those media on bacterial growth and EPS production was analysed. The effect of variables (medium ingredients) and their level on EPS production was determined by comparing the K-values to the mean EPS production (Figure 4(a)), optimal level of each medium component for EPS production was determined as A1B3C1D3E3F3G3 which is near the medium No 3. The optimal culture medium composition with the ingredients chosen according to Table 1 is: 10 g/L of sucrose, 0.892 g/L of (NH4)2SO4, 0.34 g/L of NaNO3, 3 mL of acetic acid, 1.5 g/L of KH2PO4, 1.5 g/L of K2HPO4 and 0.6 g/L of MgSO4. The same comparison was made for bacterial growth (Figure 4(b)) and
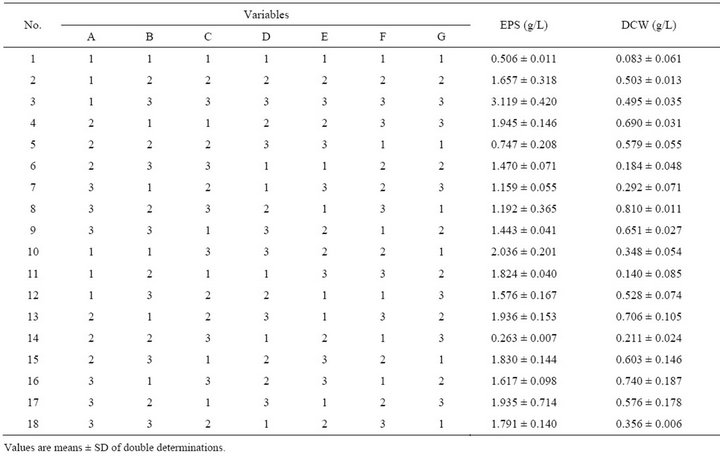
Table 4. Results of orthogonal experiments for culture medium optimisation.
 (a)
(a)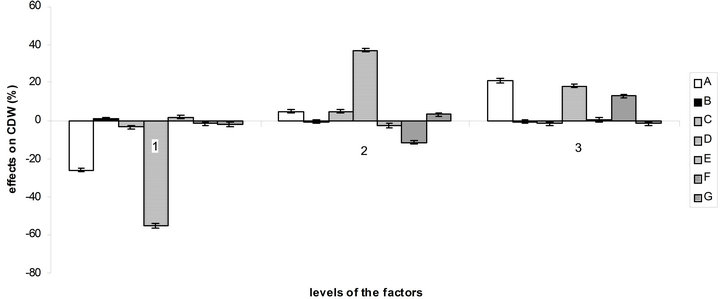 (b)
(b)
Figure 4. Effect of the variables and their level on EPS production (a) and bacterial growth (b) by comparison of K-values to the mean.
the optimal medium determined is: 30 g/L of sucrose, 0.264 g/L of (NH4)2SO4, 0.68 g/L of NaNO3, 1.5 mL of acetic acid, 0.5 g/L of KH2PO4, 1.5 g/L of K2HPO4 and 0.4 g/L of MgSO4.
So there is a great difference between the optimal medium found for bacterial growth and EPS production. But as can be seen at the observation of Figure 4, factors B, C, E, F and G and their levels have more influence on EPS production than on bacterial growth, which facilitate the choice of optimal concentration for these components. The acetic acid, which here influence the buffering as NaOH was used to regulate the pH to 4.5, is best at level 2 (1.5 mL) for bacterial growth and at level 3 (3 mL) for EPS production. For sucrose, it is more complicated, the optimal quantity for EPS production being the worst for bacterial growth.
So, to check the results found by this orthogonal design taking into account the remarks made, a fermentor was processed with the optimal medium determined for EPS production starting the bacterial culture at pH 4, more favourable to bacterial growth, to change it after one day to pH 5, more favourable to EPS production. After 5 days of fermentation we obtained 4.04 g/L of EPS. We have thus increased the EPS productivity by 29.5% compared to the best medium found with the orthogonal design (3.119 g/L).
3.5. Preliminary Characterization of the EPS
The contents of carbohydrate, glucuronic acid and protein in the EPS were determined to be 71.05%, 0.25% and 0.41% respectively by chemical analysis. The origin of the other material (more than 28%) has not been identified.
GPC curves of EPS yielded four fractions of which two main peaks with the retention times of 11.200 and 11.434 min. The area proportions of these two main peaks were 44.65% and 50.86% respectively. These fractions presented a molecular weight of 2.5 and 1.8 kDa, respectively, calculated in accordance with the retention time of standard dextrans. It corresponds to polysaccharides of DP 14 and 10 respectively. The two minor fractions had retention times of 12.942 and 13.22 min, with area proportion of respectively 2.2% and 2.3%. Their molecular weights were 200 and 130 Da, respectively.
Analysis of monosaccharide composition of EPS by GC revealed glucose, galactose, mannose, xylose, arabinose and rhamnose in relative percent of 36.36, 33.94, 22.42, 3.12, 2.54 and 0.60. Thus these EPS produced by G. hansenii LMG1524 contains glucose, mannose, rhamnose and glucuronic acid like the acetan [9], but also galactose, which makes them closer to the polysaccharide produced by Acetobacter pasteurians subsp. Estunensis IFO 13751 and “Gluconobacter capsulatus” IAM 1813 [11].
But above all, the mannose is one of the most important constituent of these EPS with 22.42% which confirms the potential of the medical applications of these EPS.
4. Conclusions
Like for other gram negative bacteria, an incubation temperature below the optimum growth temperature (30˚C) resulted in a greater production of EPS by G. hansenii LMG1524. But a temperature shift at the beginning of the exponential growth phase did not improve the polysaccharide secretion. Analysis of the influence of pH indicated that the optimum pH for growth was 4 while EPS production was better at pH 5. Our results showed that the yield of the produced EPS and bacterial growth depend on the carbon and nitrogen sources used. The highest EPS productivity was obtained with alditols but glucose was the most efficient carbon source for bacterial growth with 0.56 g/L. Nitrogen supplied in the form of ammonium ion was the best source for polymer synthesis (1.22 g/L) but cysteine with CaCO3 was the most efficient for bacterial growth (0.77 g/L). The presence of ethanol in the medium reduced the growth and did not enhance the EPS secretion like for G. xylinus I2281 [35]. Under the optimal medium composition found by statistical methodology, the maximum EPS production reached 4.04 g/L, which is 29.5% higher than the best medium used during the orthogonal design experiments and about three times better than that with the basal medium.
Chemical analysis showed the secreted polysaccharides were composed of glucose, galactose, mannose, xylose, arabinose and rhamnose in relative percent of 36.36, 33.94, 22.42, 3.12, 2.54 and 0.60, respectively. GPC indicated that the EPS are composed of two major fractions of DP 14 and DP 10. However, the structure of the EPS needs to be studied to better exploit its potential.
5. Acknowledgements
This research was supported by the European Union and the Walloon Region with the European Funds for Regional Development 2007-2013 in the framework of the SINOPLISS project. The authors are grateful to the Walloon Region and the European Union for the financial support. Mr. Joël Nys is acknowledged for excellent assistance.
REFERENCES
- I. W. Sutherland, “Polysaccharides from Microorganisms, Plants and Animals,” In: E. J. Vandamme, S. De Baets and A. Steinbüchel, Eds., Polysaccharides I Polysaccharides from Prokaryotes, Vol. 5, Wiley-VCH Verlag, Weinheim, 2002, pp. 1-19.
- B. F. Chong, L. M. Blank, R. McLaughlin and L. K. Nielsen, “Microbial Hyaluronic Acid Production,” Applied Microbiology and Biotechnology, Vol. 66, No. 4, 2005, pp. 341-351. doi:10.1007/s00253-004-1774-4
- D. Klemm, D. Schumann, U. Udhardt and S. Marsch, “Bacterial Synthesized Cellulose—Artificial Blood Vessels for Microsurgery,” Progress in Polymer Science, Vol. 26, No. 9, 2001, pp. 1561-1603. doi:10.1016/S0079-6700(01)00021-1
- T. Khan, H. Khan and J. K. Park, “Physical Properties of a Single-Linked Glucuronic Acid-Based Oligosaccharide Produced by a Gluconacetobacter hansenii Strain,” Process Biochemistry, Vol. 42, No. 2, 2007, pp. 252-257. doi:10.1016/j.procbio.2006.08.006
- T. Khan, S. Khan and J. K. Park, “Simple Fed-Batch Cultivation Strategy for the Enhanced Production of a Single-Sugar Glucuronic Acid-Based Oligosaccharides by a Cellulose-Producing Gluconacetobacter hansenii Strain,” Biotechnology and Bioprocess Engineering, Vol. 13, No. 2, 2008, pp. 240-247. doi:10.1007/s12257-007-0212-8
- Q. D. An, G. L. Zhang, H. T. Wu, Z. C. Zhang, G. S. Zheng, L. Luan, Y. Murata and X. Li, “Alginate-Deriving Oligosaccharide Production by Alginase from Newly Isolated Flavobacterium sp. LXA and Its Potential Application in Protection against Pathogens,” Journal of Applied Microbiology, Vol. 106, No. 1, 2009, pp. 161-170. doi:10.1111/j.1365-2672.2008.03988.x
- T. Murphy, R. Parra, R. Radman, I. Roy, A. Harrop, K. Dixon and T. Keshavarz, “Novel Application of Oligosaccharides as Elicitors for the Enhancement of Bacitracin a Production in Cultures of Bacillus licheniformis,” Enzyme and Microbial Technology, Vol. 40, No. 6, 2007, pp. 1518-1523. doi:10.1016/j.enzmictec.2006.10.030
- P. Lisdiyanti, R. R. Navarro, T. Uchimura and K. Komagata, “Reclassification of Gluconacetobacter hansenii Strains and Proposals of Gluconacetobacter saccharivorans sp. nov. and Gluconacetobacter nataicola sp. nov.,” International Journal of Systematic and Evolutionary Microbiology, Vol. 56, No. 9, 2006, pp. 2101- 2111. doi:10.1099/ijs.0.63252-0
- R. O. Couso, L. Ielpi and M. A. Dankert, “A XanthanGum-Like Polysaccharide from Acetobacter xylinum,” Journal of General Microbiology, Vol. 133, No. 8, 1987, pp. 2123-2135. doi:10.1099/00221287-133-8-2123
- C. A. MacCormick, J. E. Harris, A. J. Jay, M. J. Ridout, I. J. Colquhoun and V. J. Morris, “Isolation and Characterization of a New Extracellular Polysaccharide from an Acetobacter Species,” Journal of Applied Bacteriology, Vol. 81, No. 4, 1996, pp. 419-424. doi:10.1111/j.1365-2672.1996.tb03528.x
- H. Minakami, E. Entani, K. Tayama, S. Fujiyama and H. Masai, “Isolation and Characterization of a New Polysaccharide-Producing Acetobacter sp.,” Agricultural and Biological Chemistry, Vol. 48, No. 10, 1984, pp. 2405- 2414. doi:10.1271/bbb1961.48.2405
- S. Moonmangmee, K. Kawabata, S. Tanaka, H. Toyama, O. Adachi and K. Matsushita, “A Novel Polysaccharide Involved in the Pellicle Formation of Acetobacter aceti,” Journal of Bioscience and Bioengineering, Vol. 93, No. 2, 2002, pp. 192-200. doi:10.1263/jbb.93.192
- K. Tayama, H. Minakami, E. Entani, S. Fujiyama and H. Masai, “Structure of an Acidic Polysaccharide from Acetobacter sp. NBI 1022,” Agricultural and Biological Chemistry, Vol. 49, No. 4, 1985, pp. 959-966. doi:10.1271/bbb1961.49.959
- K. Born, V. Langendorff and P. Boulenguer, “Xanthan,” In: E. J. Vandamme, S. De Baets and A. Steinbüchel, Eds., Polysaccharides I Polysaccharides from Prokaryotes, Vol. 5, Wiley-VCH Verlag, Weinheim, 2002, pp. 259- 297.
- F. Ito, Y. Amano, K. Nozaki, I. M. Saxena, M. R. Brown Jr. and T. Kanda, “The Relationship between Cellulose Activity and Oligosaccharides and Cellulose Productions by Acetobacter xylinum ATCC23769,” Journal of Biological Macromolecules, Vol. 4, No. 3, 2004, pp. 83-90.
- W. Hayes, H. M. I. Osborn, S. D. Osborne, R. A. Rastall and B. Romagnoli, “One-Pot Synthesis of Multivalent Arrays of Mannose Monoand Disaccharides,” Tetrahedron, Vol. 59, No. 40, 2003, pp. 7983-7996. doi:10.1016/j.tet.2003.08.011
- N. Sharon, “Carbohydrates as Future Anti-Adhesion Drugs for Infectious Diseases,” Biochimica et Biophysica Acta, Vol. 1760, No. 4, 2006, pp. 527-537. doi:10.1016/j.bbagen.2005.12.008
- D. Zopf and S. Roth, “Oligosaccharide Anti-Infective Agents,” Lancet, Vol. 347, No. 9007, 1996, pp. 1017- 1021. doi:10.1016/S0140-6736(96)90150-6
- A. S. Kumar, K. Mody and B. Jha, “Bacterial Exopolysaccharides—A Perception,” Journal of Basic Microbiology, Vol. 47, No. 2, 2007, pp. 103-117. doi:10.1002/jobm.200610203
- I. W. Sutherland, “Microbial Polysaccharides from GramNegative Bacteria,” International Dairy Journal, Vol. 11, No. 9, 2001, pp. 663-674. doi:10.1016/S0958-6946(01)00112-1
- C. Gao, Z. Wang, T. Su, J. Zhang and X. Yang, “Optimisation of Exopolysaccharide Production by Gomphidius rutilus and Its Antioxidant Activities in Vitro,” Carbohydrate Polymers, Vol. 87, No. 3, 2012, pp. 2299-2305. doi:10.1016/j.carbpol.2011.10.064
- M. Dubois, K. A. Gilles, J. K. Hamilton, P. A. Rebers and F. Smith, “Colorimetric Method for Determination of Sugars and Related Substances,” Analytical Chemistry, Vol. 28, No. 3, 1956, pp. 350-356. doi:10.1021/ac60111a017
- M. M. Bradford, “A Rapid and Sensitive Method for the Quantization of Microgram Quantities of Protein Utilizing the Principle of Protein-Dye Binding,” Analytical Biochemistry, Vol. 72, No. 7, 1976, pp. 248-254. doi:10.1016/0003-2697(76)90527-3
- T. M. C. C. Filisetti-Cozzi and N. C. Carpita, “Measurement of Uronic Acids without Interference from Neutral Sugars,” Analytical Biochemistry, Vol. 197, No. 1, 1991, pp. 157-162. doi:10.1016/0003-2697(91)90372-Z
- G. A. De Ruiter, H. A. Schols, A. G. J. Voragen and F. M. Rombouts, “Carbohydrate Analysis of Water-Soluble Uronic Acid-Containing Polysaccharides with High-Performance Anion-Exchange Chromatography Using Methanolysis Combined with TFA Hydrolysis Is Superior to Four Other Methods,” Analytical Biochemistry, Vol. 207, No. 1, 1992, pp. 176-185. doi:10.1016/0003-2697(92)90520-H
- A. B. Blakeney, P. J. Harris, R. J. Henry and B. S. Stone, “A Simple and Rapid Preparation of Alditol Acetates for Monosaccharide Analysis,” Carbohydrate Research, Vol. 113, No. 2, 1993, pp. 291-299. doi:10.1016/0008-6215(83)88244-5
- M. Dueñas, A. Munduate, A. Perea and A. Irastorza, “Exopolysaccharide Production by Pediococcus damnosus 2.6 in a Semidefined Medium under Different Growth Conditions,” International Journal of Food Microbiology, Vol. 87, No. 1, 2003, pp. 113-120. doi:10.1016/S0168-1605(03)00060-6
- F. Gancel and G. Novel, “Exopolysaccharide Production by Streptococcus salivarius ssp. thermophilus Cultures. 1. Conditions of Production,” Journal of Dairy Science, Vol. 77, No. 3, 1994, pp. 685-688. doi:10.3168/jds.S0022-0302(94)77000-4
- M. Kojic, M. Vujcic, A. Banina, P. Cocconcelli, J. Cerning and L. Topisirovic, “Analysis of Exopolysaccharide Production by Lactobacillus casei CG11, Isolated from Cheese,” Applied and Environmental Microbiology, Vol. 58, No. 12, 1992, pp. 4086-4088.
- L. Gamar-Nourani, K. Blondeau and J. M. Simonet, “Influence of Culture Conditions on Exopolysaccharide Production by Lactobacillus rhamnosus Strain C83,” Journal of Applied Microbiology, Vol. 85, No. 4, 1998, pp. 664- 672. doi:10.1111/j.1365-2672.1998.00574.x
- A. Margaritis and G. W. Pace, “Microbial Polysaccharides”, In: M. Moo-Young, Ed., Comprehensive Biotechnology, Vol. 3, Pergamon Press, Oxford, 1985, pp. 1005- 1044.
- M. Stredansky, E. Conti, C. Bertocchi, M. Matulova and F. Zanetti, “Succinoglycan Production by Agrobacterium tumefaciens,” Journal of Fermentation and Bioengineering, Vol. 85, No. 4, 1998, pp. 398-403. doi:10.1016/S0922-338X(98)80083-4
- K. V. Ramana, A. Tomar and L. Singh, “Effect of Various Carbon and Nitrogen Sources on Cellulose Synthesis by Acetobacter xylinum,” World Journal of Microbiology & Biotechnology, Vol. 16, No. 3, 2000, pp. 245-248. doi:10.1023/A:1008958014270
- J. Y. Jung, J. K. Park and H. N. Chang, “Bacterial Cellulose Production by Gluconacetobacter hansenii in an Agitated Culture without Living Non-Cellulose Producing Cells,” Enzyme and Microbial Technology, Vol. 37, No. 3, 2005, pp. 347-354. doi:10.1016/j.enzmictec.2005.02.019
- H. Kornmann, P. Duboc, P. Niederberger, I. Marison and U. von Stockar, “Influence of Residual Ethanol Concentration on the Growth of Gluconacetobacter xylinus I 2281,” Applied Microbiology and Biotechnology, Vol. 62, No. 2-3, 2003, pp. 168-173. doi:10.1007/s00253-003-1299-2
- M. C. Vargas-Garcia, M. J. Lopez, M. A. Elorrieta, F. Suarez and J. Moreno, “Influence of Nutritional and Environmental Factors on Polysaccharide Production by Azotobacter vinelandii Cultured on 4-Hydroxybenzoic Acid,” Journal of Industrial Microbiology & Biotechnology, Vol. 27, No. 1, 2001, pp. 5-10. doi:10.1038/sj.jim.7000152
NOTES
*Corresponding author.