Open Journal of Medical Psychology
Vol.3 No.1(2014), Article ID:41905,7 pages DOI:10.4236/ojmp.2014.31011
An Internet-Based Symptom Checklist for Research and Clinical Practice in Neurology and Psychiatry
Department of Neuropsychiatry, North Carolina Neuropsychiatry Clinics, Chapel Hill, Charlotte & Raleigh, USA
Email: tg@ncneuropsych.com
Copyright © 2014 Camillo Thomas Gualtieri. This is an open access article distributed under the Creative Commons Attribution License, which permits unrestricted use, distribution, and reproduction in any medium, provided the original work is properly cited. In accordance of the Creative Commons Attribution License all Copyrights © 2014 are reserved for SCIRP and the owner of the intellectual property Camillo Thomas Gualtieri. All Copyright © 2014 are guarded by law and by SCIRP as a guardian.
Received November 1, 2013; revised December 1, 2013; accepted December 8, 2013
Keywords: Symptom Self-Report; Checklist; Computerized Testing
ABSTRACT
For many years, computer technology has been used for patient evaluation in psychiatry, although, for the most part, the applications have been in clinical trials or other research projects. Computer-administered evaluations are thought to be more comprehensive and reliable and less biased than evaluations routinely conducted in clinical practice. Also, the use of continuous monitoring systems, which increasingly entails computer administration, has been related to improved treatment outcome. This report describes the development of a broad spectrum neuropsychiatric symptom questionnaire (NP3) that is freely available over the internet and prints a report as soon as the patient and/or concurrent informants have completed the test. The results of the questionnaire can be saved to a central database in order to generate serial reports.
1. Introduction
The treatment of patients with depression entails the serial assessment of the patient’s symptoms, by self-report, and the patient’s mental state, by examination. In clinical trials, this is done with rating scales (RS) and semi-structured interviews; in clinical practice, assessment is less formal. Systematic measures, like RS, are rarely employed, although capturing systematic and quantitative data about patients’ symptoms can have positive ramifications on patient outcome [1], consumer satisfaction [2] and quality assurance review [3-5].
For many years, computer technology has been used for patient evaluation in psychiatry, although, for the most part, the applications have been in clinical trials or other research projects. Computer-administered evaluations are thought to be more comprehensive and reliable and less biased than evaluations routinely conducted in clinical practice. Also, the use of continuous monitoring systems, which increasingly entails computer administration, has been related to improved treatment outcome. [6,7].
Equivalence has been demonstrated between “gold standard” assessments (such as the Hamilton depression and Hamilton anxiety rating scales) delivered either by computer or by clinicians. In clinical trials, computerbased ratings eliminate inter-rater variance and prevent inclusion bias when inclusion criteria are based upon baseline ratings. Some studies have demonstrated that computer-administered ratings can be more sensitive to the detection of treatment-related changes than clinician ratings [8].
Computer-administered versions of clinician-administered scales are now available for the assessment of depression, anxiety, obsessive-compulsive disorder and social phobia. Patient reaction is said to be positive. Patients appear to be more forthright and less embarrassed in conveying sensitive information about suicide, alcohol or drug abuse, sexual behavior, or HIV related symptoms [9-11]. Computer-administered technologies have been successfully used to assess psychopathology in primary care patients [12].
This report describes the development of a broad spectrum neuropsychiatric symptom questionnaire that is freely available over the internet and prints a report as soon as the patient and/or concurrent informants have completed the test. The results of the questionnaire can be saved to a central database in order to generate serial reports.
2. Method
2.1. NP3: The Neuropsych Questionnaire
The first description of the Neuropsych Questionnaire (NP3) was published in 2007 in an open-source internet journal (http://www.medscape.com/viewarticle/562806). The NP3 is an internet-based symptom checklist that captures data that would ordinarily require the administration of several RS and symptom checklists. It is a procedure that generates quantitative data about the patient’s status at the first evaluation visit, and, in a shorter form, at every follow-up visit. The program prints out a report, as soon as the patient (or another informant) has completed the questionnaire. The data is stored to a secure database. The data a patient generated on all previous visits can be downloaded into a serial report, which includes not only data from the current visit, but also data from every previous questionnaire. The patient’s present state, therefore, can be evaluated relative to his or her state during the course of treatment at the clinic.
RS and questionnaires have been computerized and web-based for a long time [9], but the NP3 has some useful properties that set it apart. It was designed to inquire after the presence and intensity of the symptoms of a wide range of neuropsychiatric disorders, not only symptoms of anxiety, depression and inattention, but also of pain and other somatic symptoms, disordered sleep, poor memory and learning problems; there are, in all, 20 symptom scales (Table 1). The NP3 also has the potential to identify symptom exaggerators.
The NP3 is administered over the internet but it generates a report as soon as the patient is done. It has the capacity to save the results to a central database and to generate serial reports of a patient’s progress. Because the NP3 is administered on a PC, it is a quick test to administer. Two hundred or so questions can be asked and answered in about 15 minutes. A 5 minute short form is highly correlated with the long form and is more practical for follow-up assessment. Because the NP3 is available online, the patient can complete the test at home, prior to his or her visit. Interested parties, spouses, parents, children, teachers, caregivers can respond to the questionnaire as well, without having to accompany the patient to the office. This generates concurrent data about the patient’s condition from the perspective of relevant observers.
Item selection for the NP3 was based on chart review
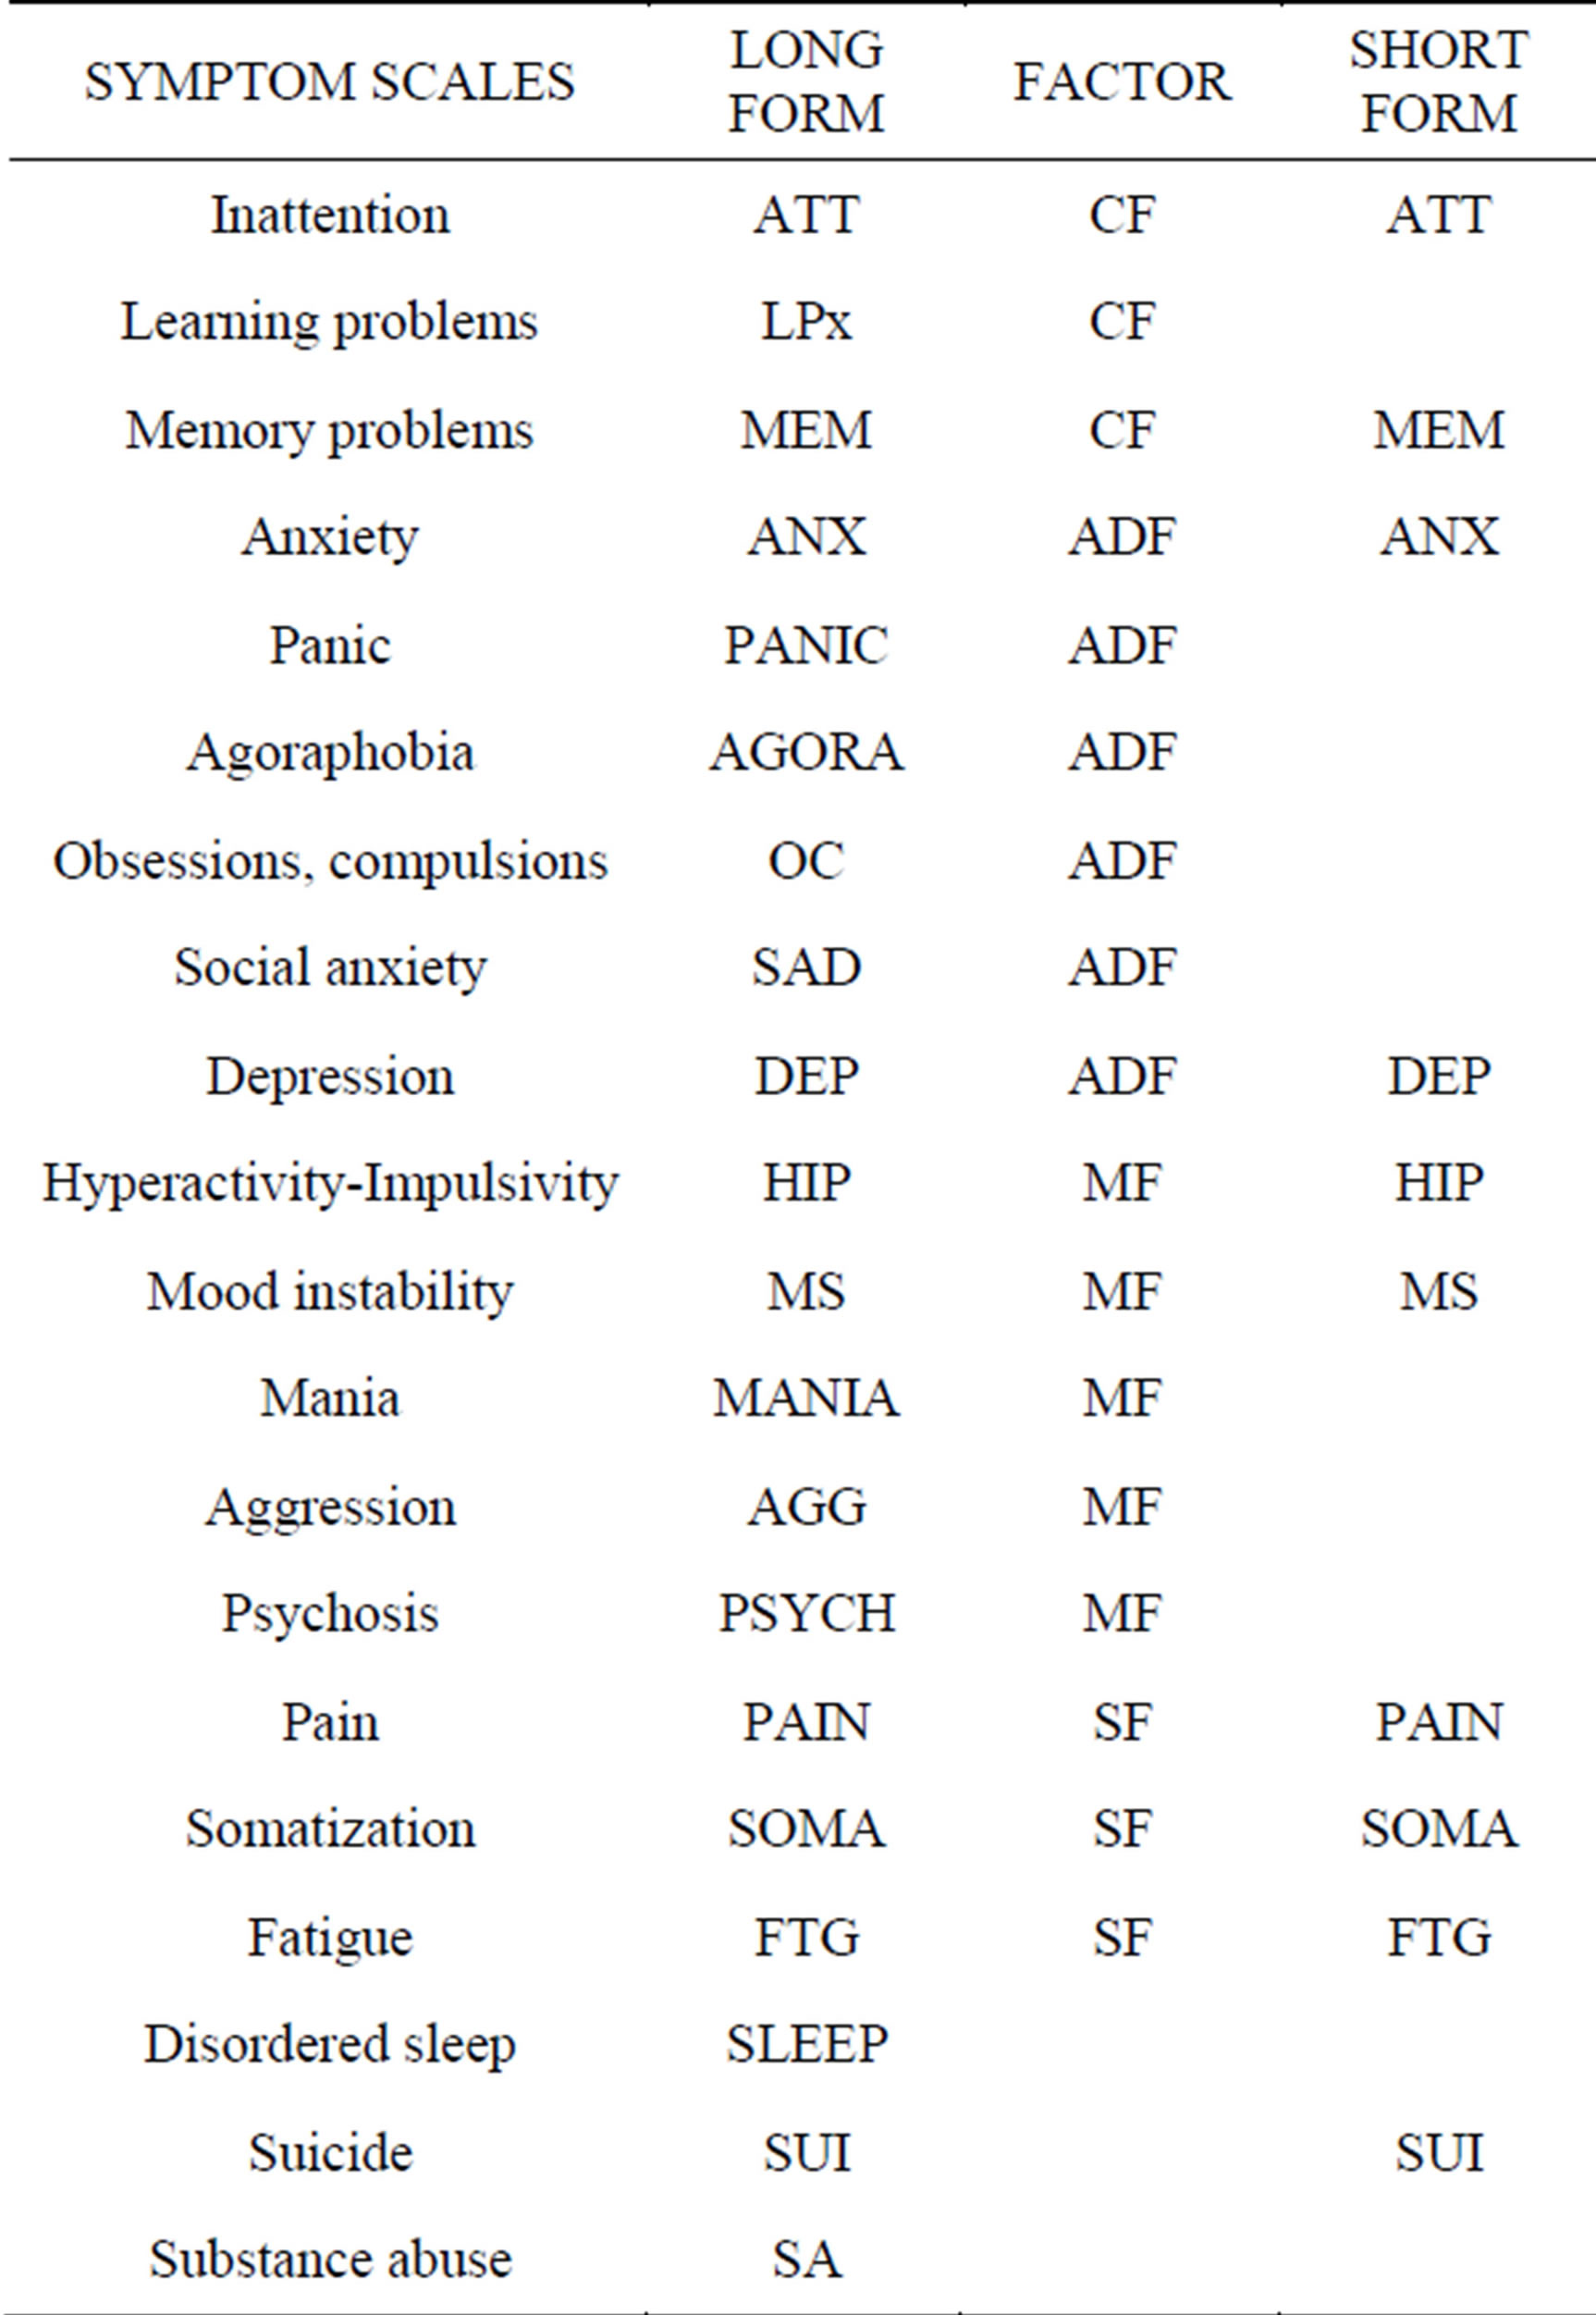
Table 1. Twenty scales in the adult NP3.
of presenting symptoms reported by, and in their own words (439 items). The list was augmented by a review of a number of rating scales and psychological instruments used in the clinics, with special attention to the RS used in clinical trials (263 items). Duplicate items, items that were infrequently cited by patients, items that failed to generate sufficient weight in the factor analysis and items that correlated poorly with the relevant scale score were discarded. This process yielded 207 symptom questions in the adult version of the scale and 201 in the pediatric version.
The respondent can specify, at the beginning of the test, the time span that is covered by the questionnaire: today, the past few days, the past week, the past couple of weeks, the last month, the past six months, the past year, ever in your life (The default is “the past couple of weeks”). The identity of the respondent is also entered at the beginning of the test (patient, husband, wife, son, daughter, mother, father, other relative, friend, caregiver, teacher) and listed on the report. The questions are posed in a person and gender specific way (e.g., “Fidgety, I can’t sit still,” “Fidgety, he can’t…” or “Fidgety, she can’t…”). If the patient is less than eighteen years old, the pediatric questionnaire is administered; eighteen and older take the adult version.
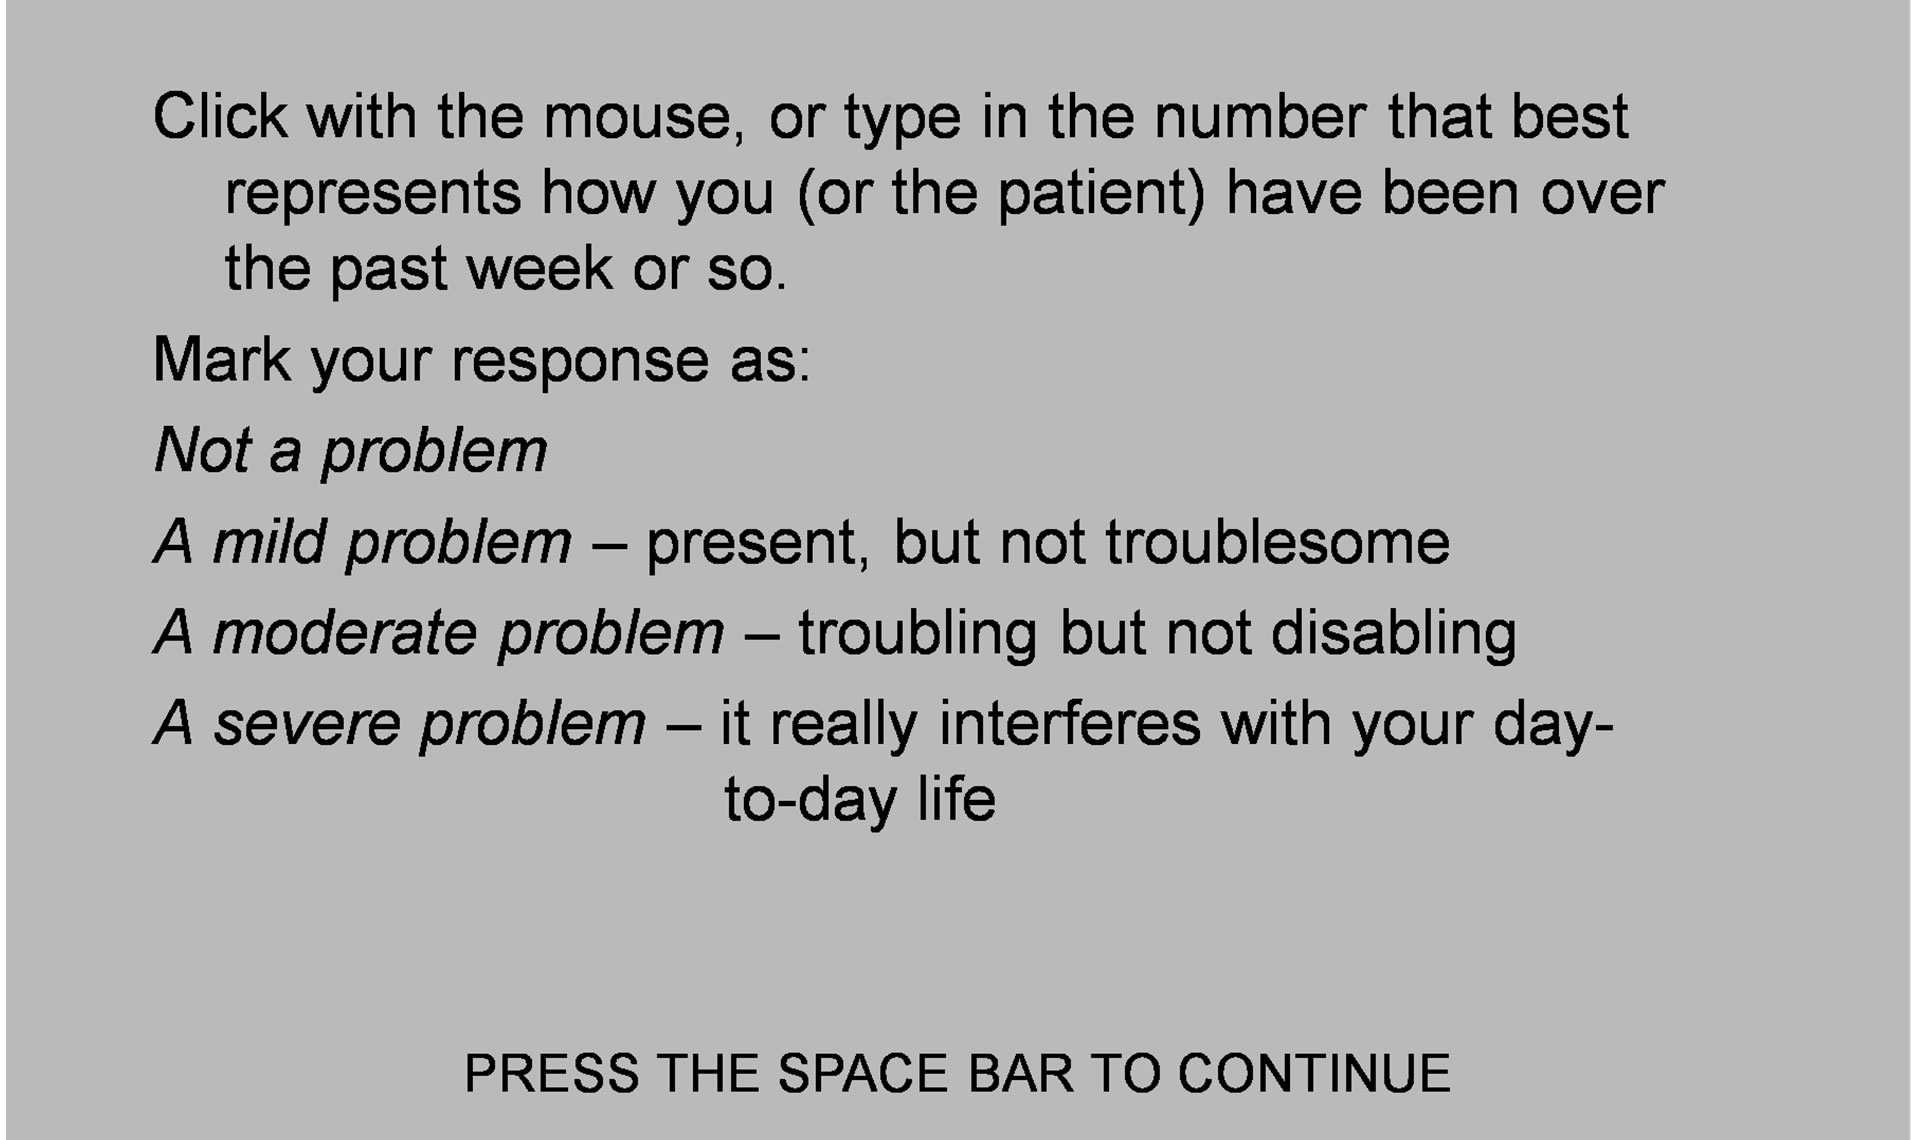
The optimal number of points on a RS has been the subject of earnest debate; the idea that seven-point scales are optimal dates from 1924 [13] but others have suggested better results with finer-grained scales (10 - 20 points) [14]. Preston et al. [15], demonstrated that scales with 7, 8 or 9 points were more reliable than scales with 2, 3 or 4 points [15]. But it has also been represented that “the number of response categories does not materially affect the cognitive structure derived from the results” [16]. Simplicity and ease of administration, led us to select a four-point scale (Figure 1). Before the questions appear, the subject is instructed on how to answer (Figures 2(a) and (b)).
Each item is scored as 0-1-2-3. Items are then clustered into symptom scales; for example, all the items that address the specific problem of depression, anxiety, memory, etc. For example, 22 items speak to the problem of memory impairment. The patient’s scores on these 22 items are averaged. They are not weighted. If the average score is 1.23, it is multiplied by 100 to eliminate the decimal point. So, the patient’s memory score would be reported as 123. The highest score someone might receive on a scale is 300; that would indicate that he or she had marked every item in the relevant scale as “a severe problem”. The lowest score one might get is zero; every item in the relevant scale was scored as “not a problem”.
2.2. Symptom Scales
The selection of scales was based on the frequency of disorders and symptom clusters that present at the Neuropsychiatry Clinics, and factor analysis led to adjustments in the scale structure. The resultant analysis generated seventeen scales.
The scales refer to symptom clusters and not to DSM or ICDM diagnoses. That was a considered decision. The NP3 is a measurement instrument, not a diagnostic in-

Figure 1. Item presentation.
 (a)
(a) 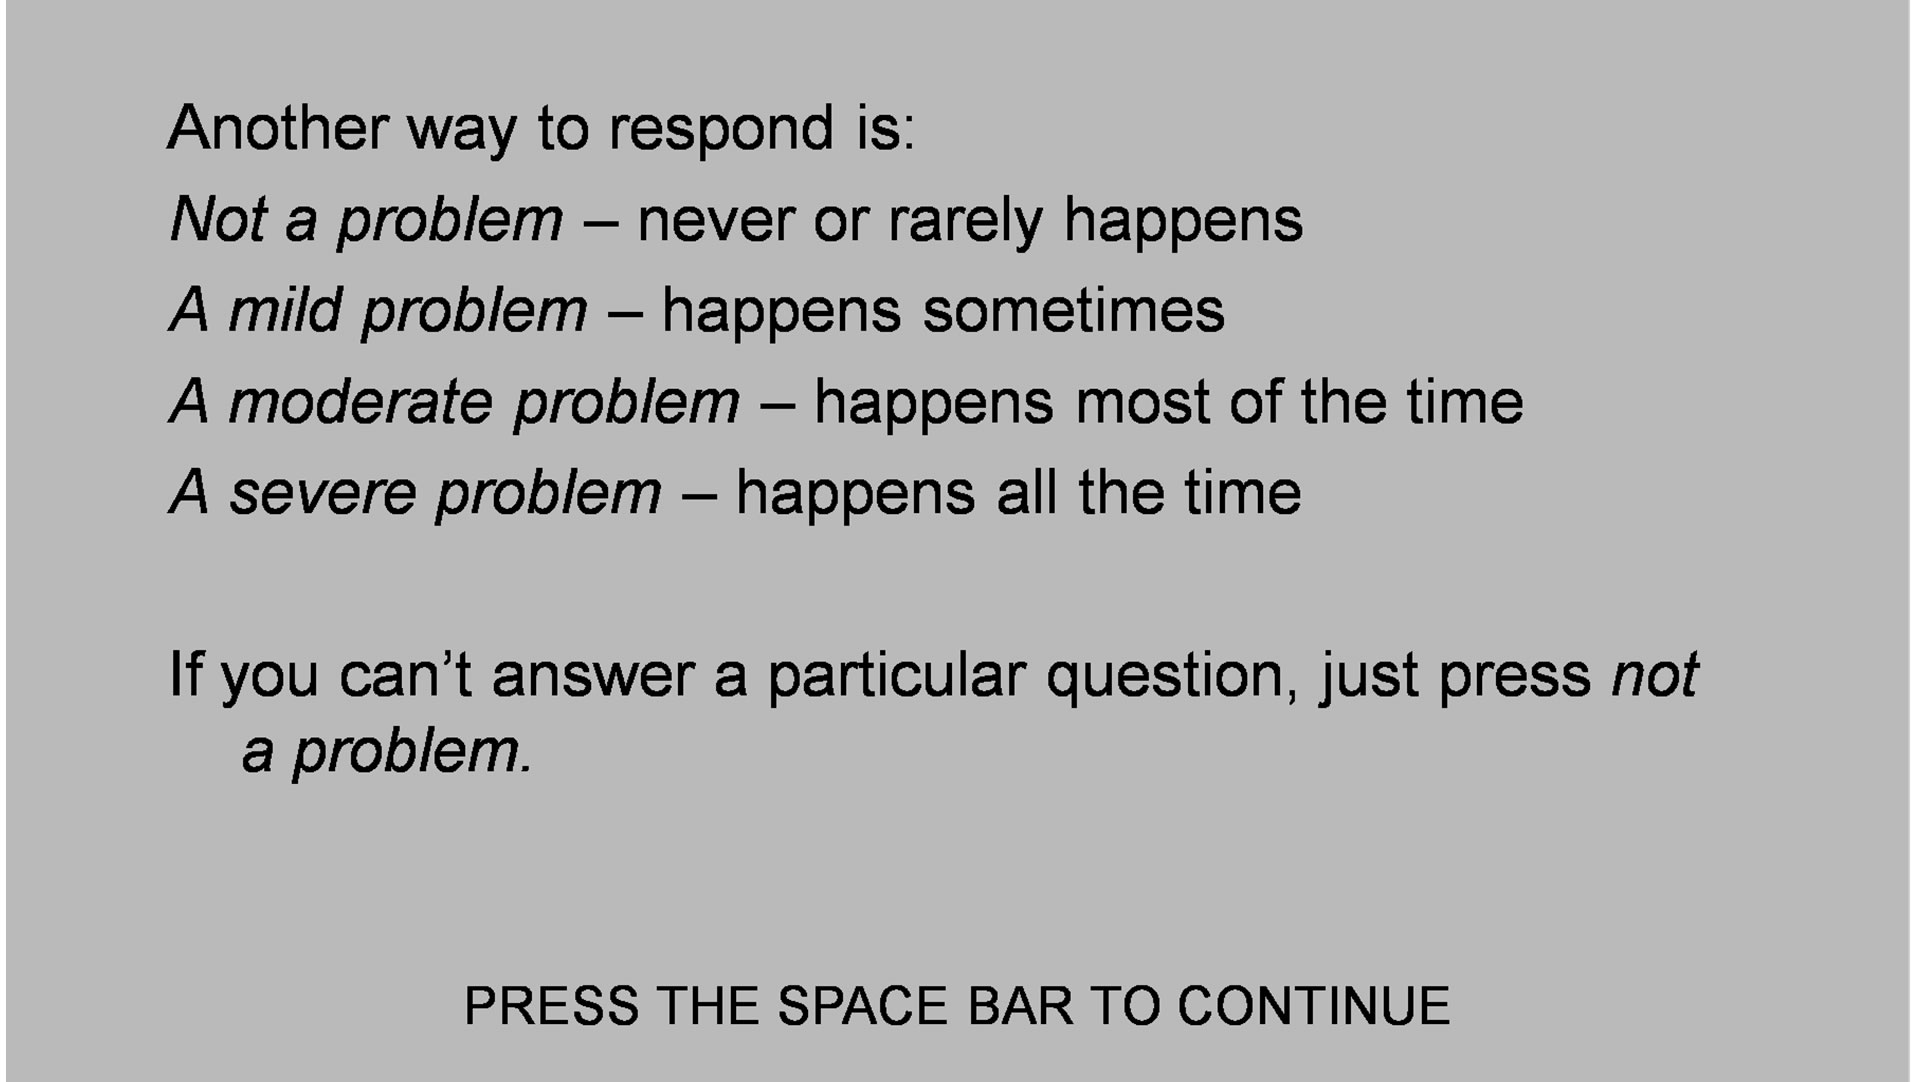 (b)
(b)
Figures 2. Instructions for responding.
strument. Patients’ complaints and the opinions of observers are valuable data, but diagnosis is a clinical exercise that integrates data from multiple sources. By the same token, the symptom clusters are more or less “pure”. For example, the depression scale asks only after questions about depressed mood, not anxiety, fatigue or sleep difficulties, which are addressed separately in the relevant scales. In this wise, the NP3 is different from conventional rating scales, like the Hamilton Depression Rating Scale, which contains a number of anxiety-related items, or the Conners Parent-Teacher Questionnaire, which includes items related to inattention as well as hyperactivity-impulsivity.
Seventeen of the scales load with four factors (see below): a cognitive factor (CF), an anxiety-depression factor (ADF), a mania factor (MF) and a somatic factor (SF). Three of the scales, suicide, sleep and substance abuse, do not load with any of the four factors and are considered independent scales.
The NP3 has been successful in its intended purpose, because it facilitates patient evaluation in the Neuropsychiatry Clinics where the authors and his colleagues use it routinely; a long form for initial evaluations and a short form for follow-up visits. It has also been adopted by other practitioners in North America, in a version that only generates reports from a single visit. The production of serial reports requires a server to collect data from every test station, and a program (written in Silverlight™) to organize the data. The serial report program is operational in North Carolina Neuropsychiatry clinics in Chapel Hill, Charlotte and Raleigh, with a central database that serves all four clinics.
2.3. Subjects
In the NCNC database, there were 2089 adults, 18 years and older who had taken the NP3—72 normal subjects, and 2017 patients with various neuropsychiatric diagnoses. Diagnoses were based on a comprehensive examination, of which the NP3 battery was only a part; diagnoses were not made simply on the basis of the NP3 scores. Diagnoses were made on the basis of DSM-IV TR criteria, where applicable and affirmed by review by a research psychiatrist (CTG).
Patients give written informed consent to the use of their de-identified clinical data, including the NP3, for the purposes of research and program evaluation. There is a spot on our website (www.ncneuropsych.com) where patients can rescind that permission at any time.
When a patient is evaluated at one of the Neuropsychiatry Clinics, he or she is routinely administered the NP3, along with rating scales, cognitive tests and validity measures, as appropriate. The NP3 data are automatically uploaded into a central database, which is maintained under secure conditions and available for systematic review only to two research clinicians in the practice.
3. Results
3.1. Correlation with Conventional Rating Scales
479 of the patients in the database had data from the NP3 and also from five commonly used clinical rating scales: the Hamilton Depression and Anxiety Rating Scales, the Beck Anxiety and Depression Inventories and the Brown ADHD Scales. The correlations (Pearson product-moment) are presented in Table 2. The highlighted cells are where one might expect to see strong correlations; e.g., between the DEP scale on the NP3 and the Hamilton Depression Rating Scale or the Beck Depression Inventory. Cells in a red font are correlations >0.6.
All of the correlations, save those for the SA scale, are highly significant. The relevant NP3 scales correlate better with the Beck scales and the Brown, which are also self-report scales, than with the Hamilton’s, which are clinician-rated.
3.2. Serial Reports
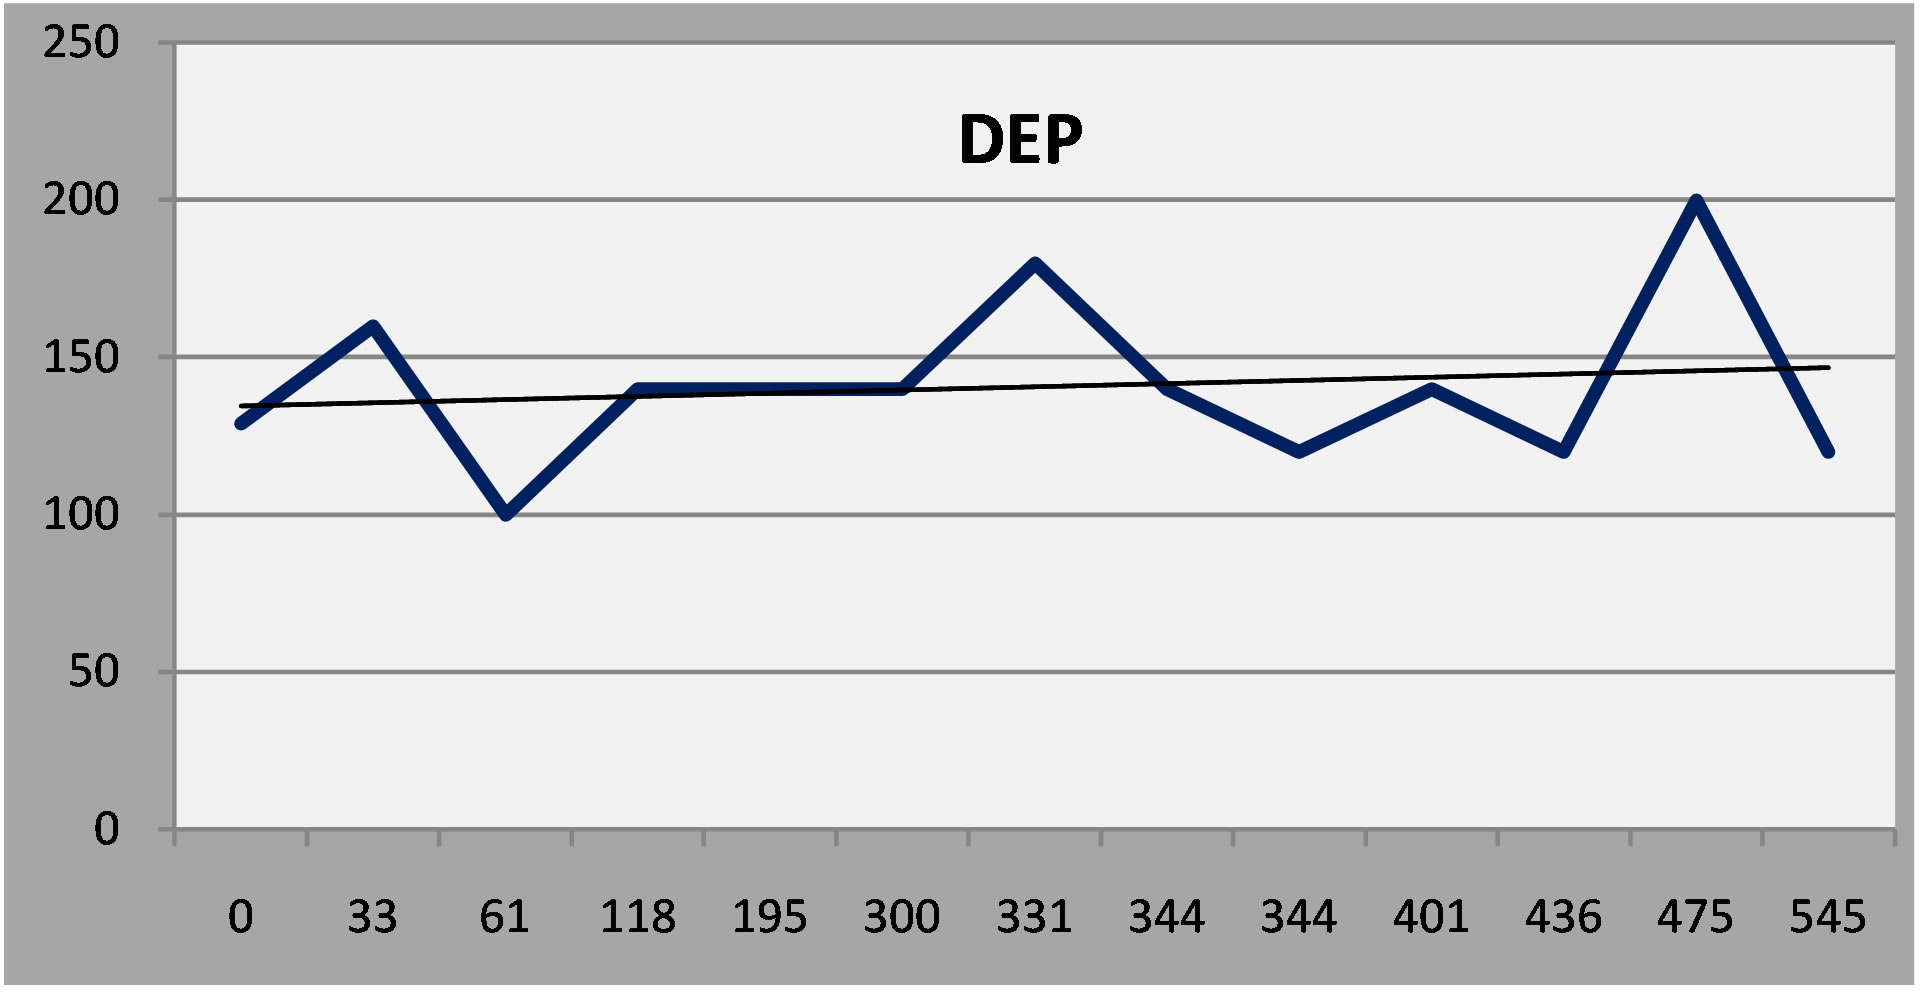
The following examples were chosen for purposes of illustration. (Figures 3-6) They are four adult patients with major depression who were treated at one of the Neuropsychiatry clinics over the course of 1 - 2 years.
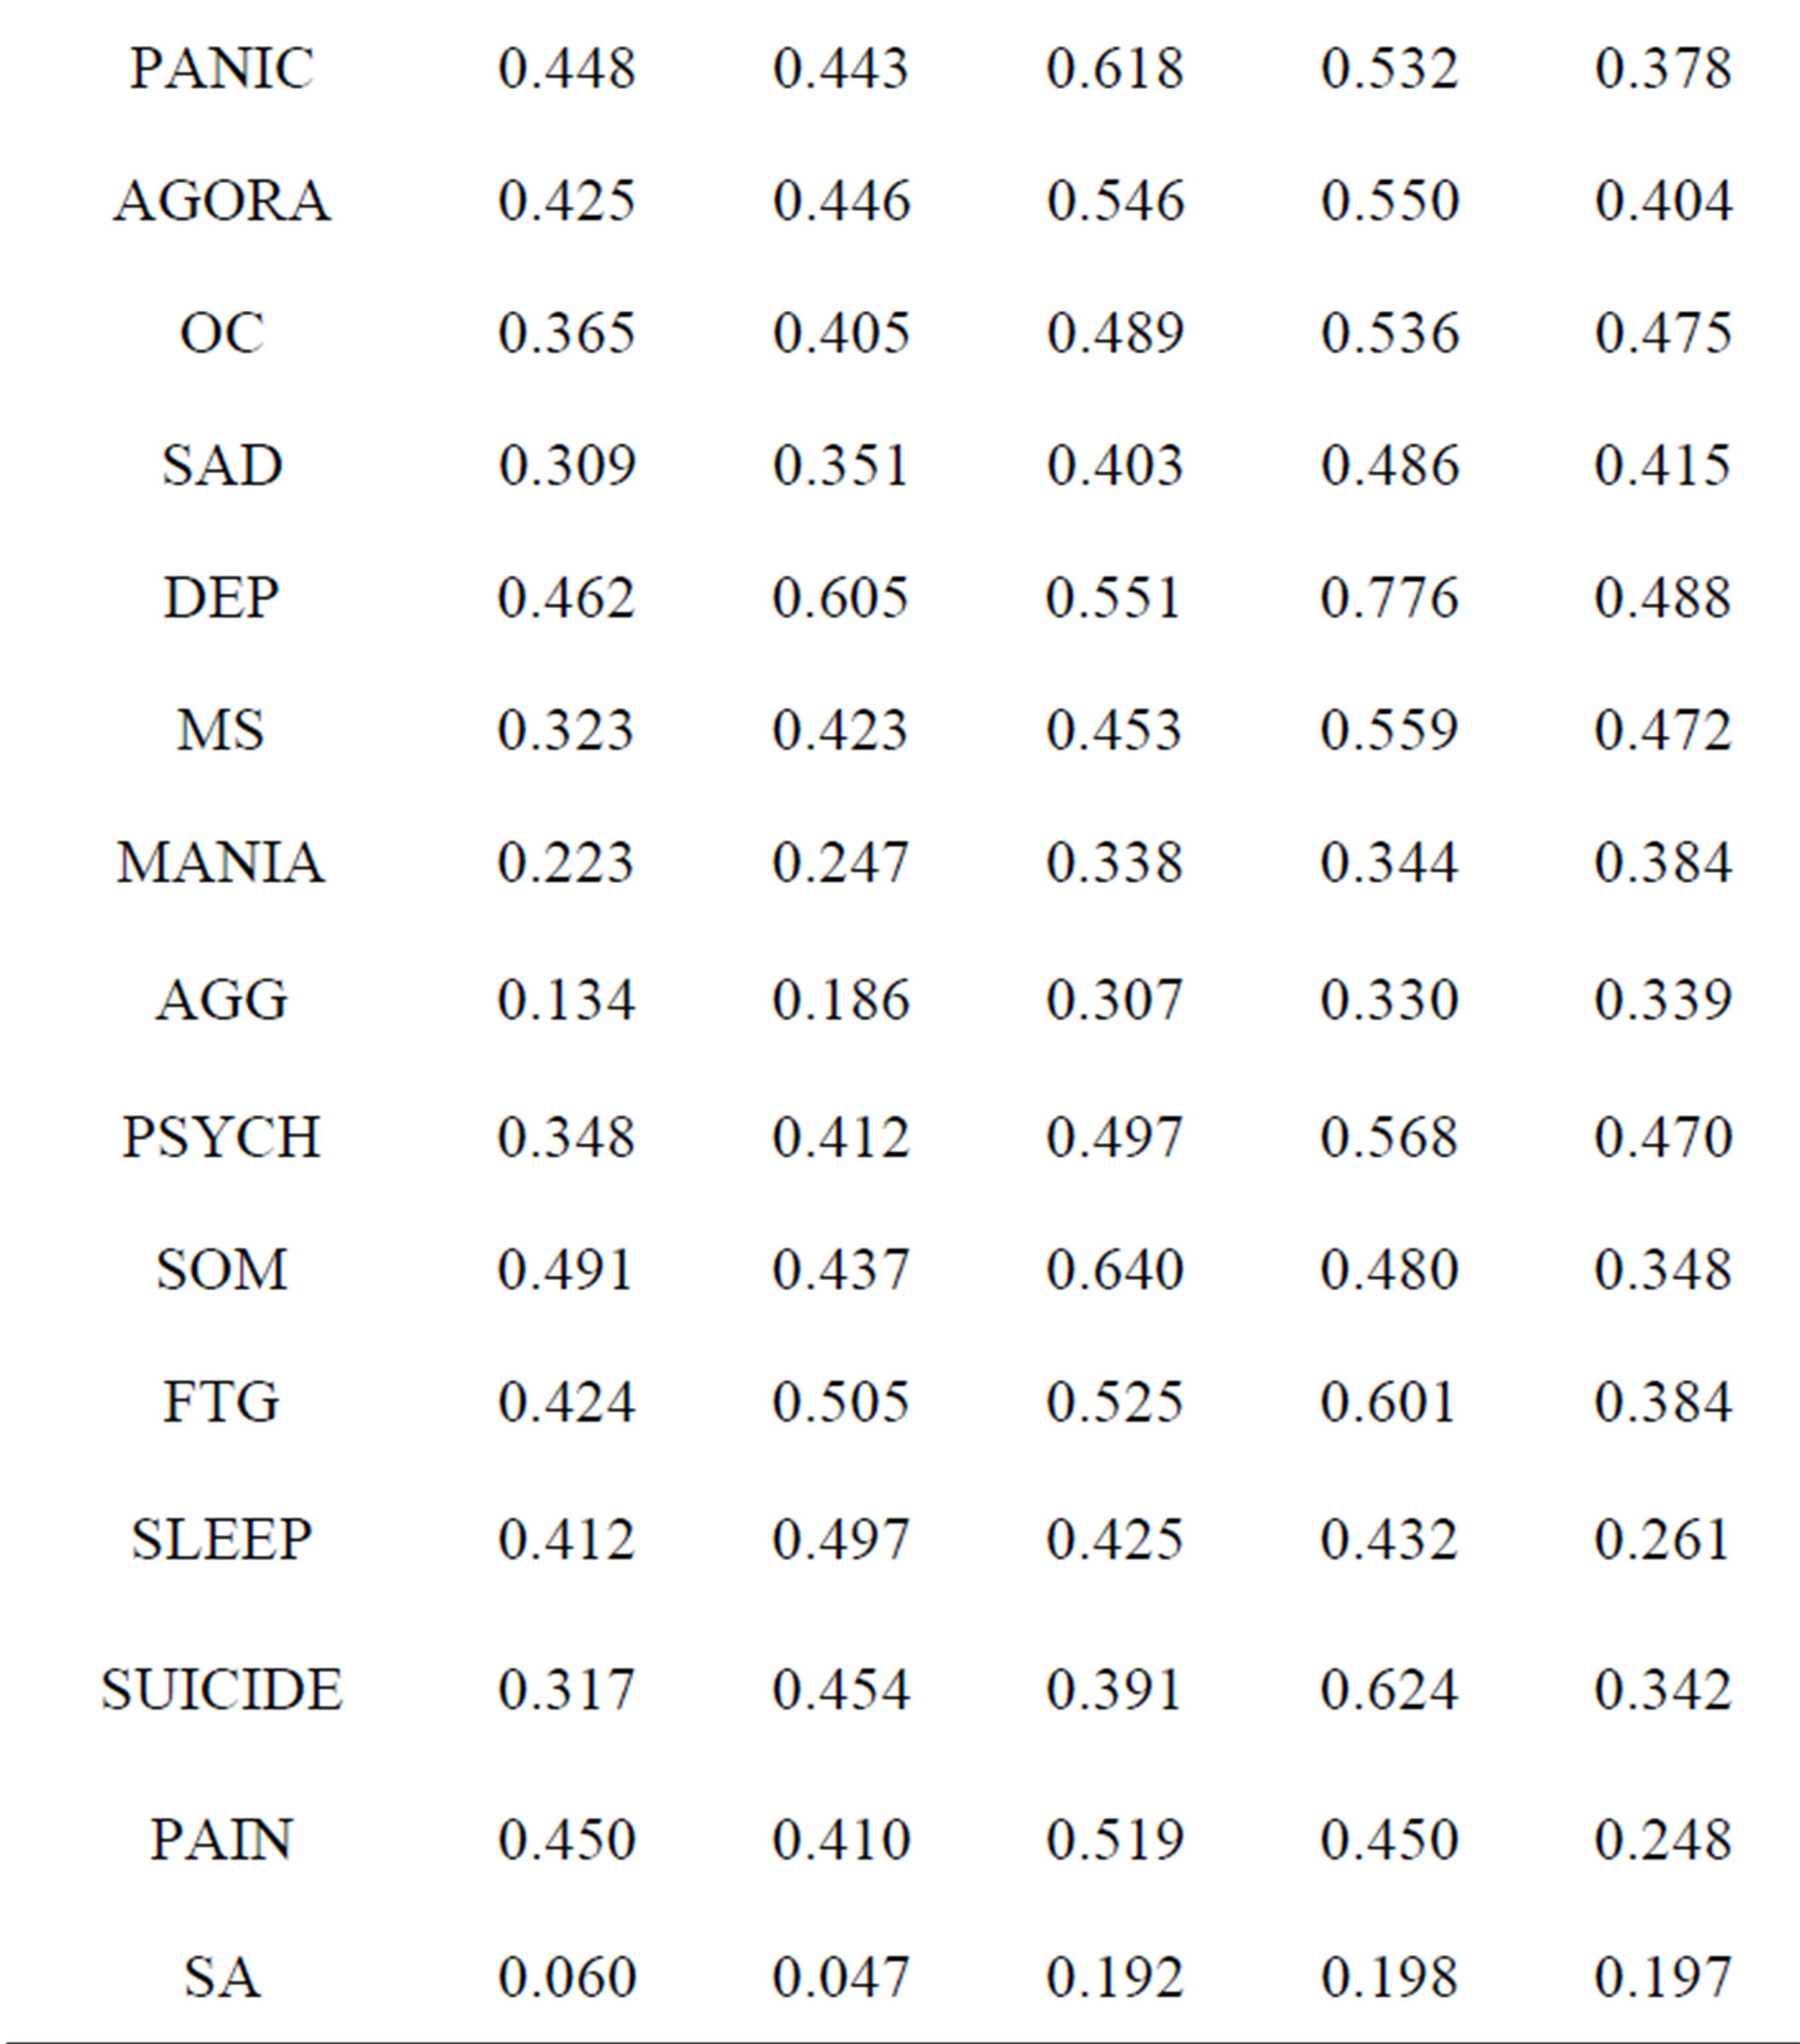
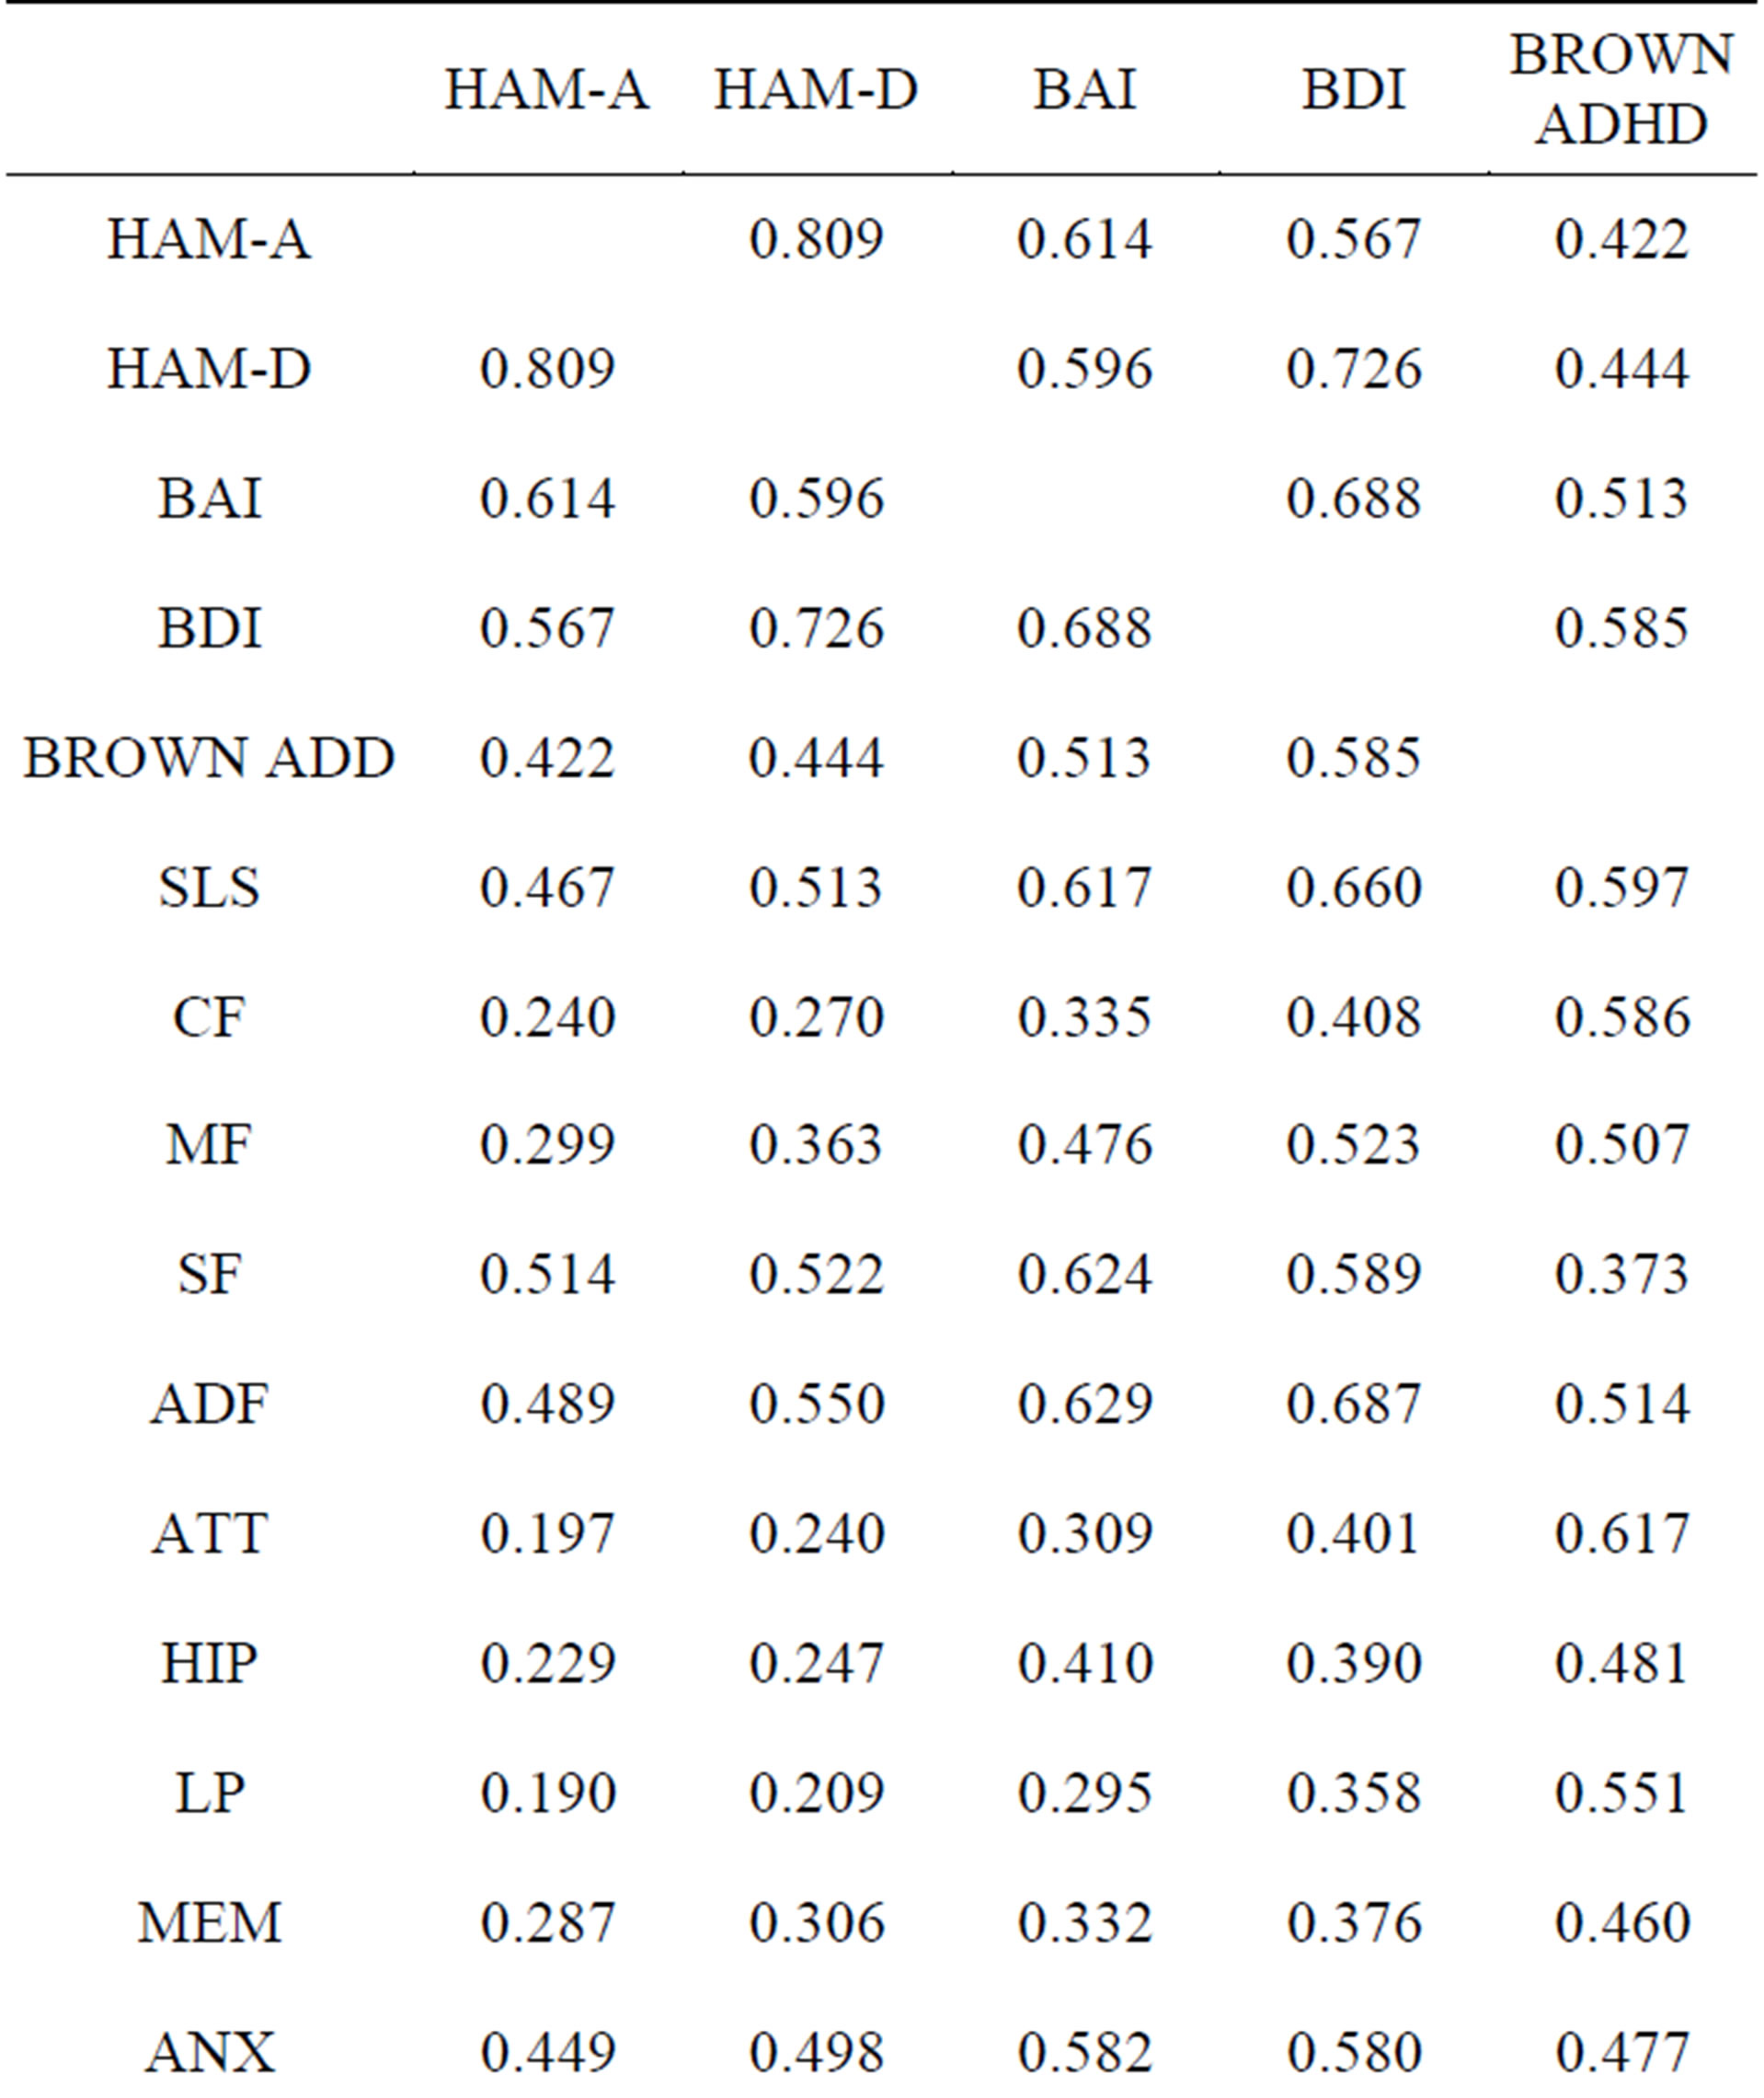
Table 2. Correlations between the NP3 and commonly used clinical rating scales.
The y axis is the patient’s score on the depression scale (DEP) of the NP3. The x axis is the time, in days, from the initial evaluation. The first patient enjoyed a favorable and sustained response to antidepressant treatment. As a rule, a score below 75 represents a favorable response, and a score below 50 is indicative of remission.
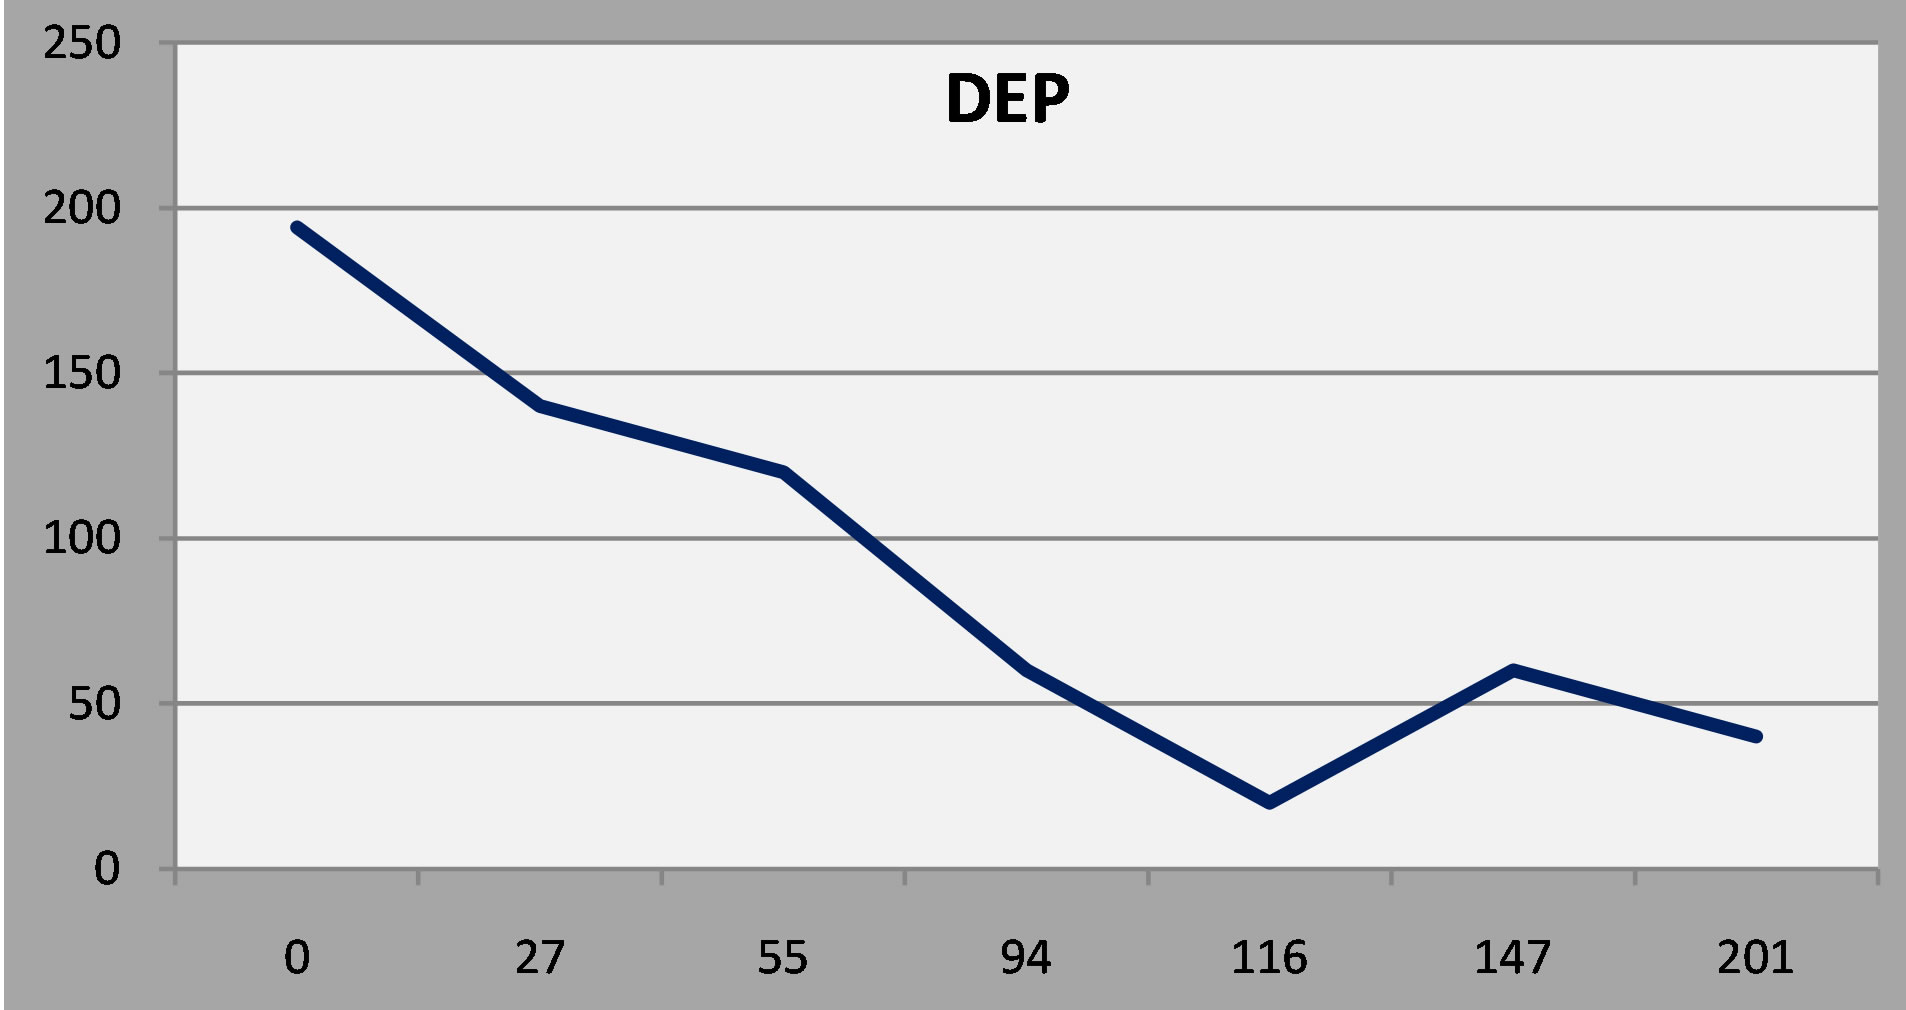
Figure 3. Patient 1: A favorable and sustained response to antidepressant treatment.
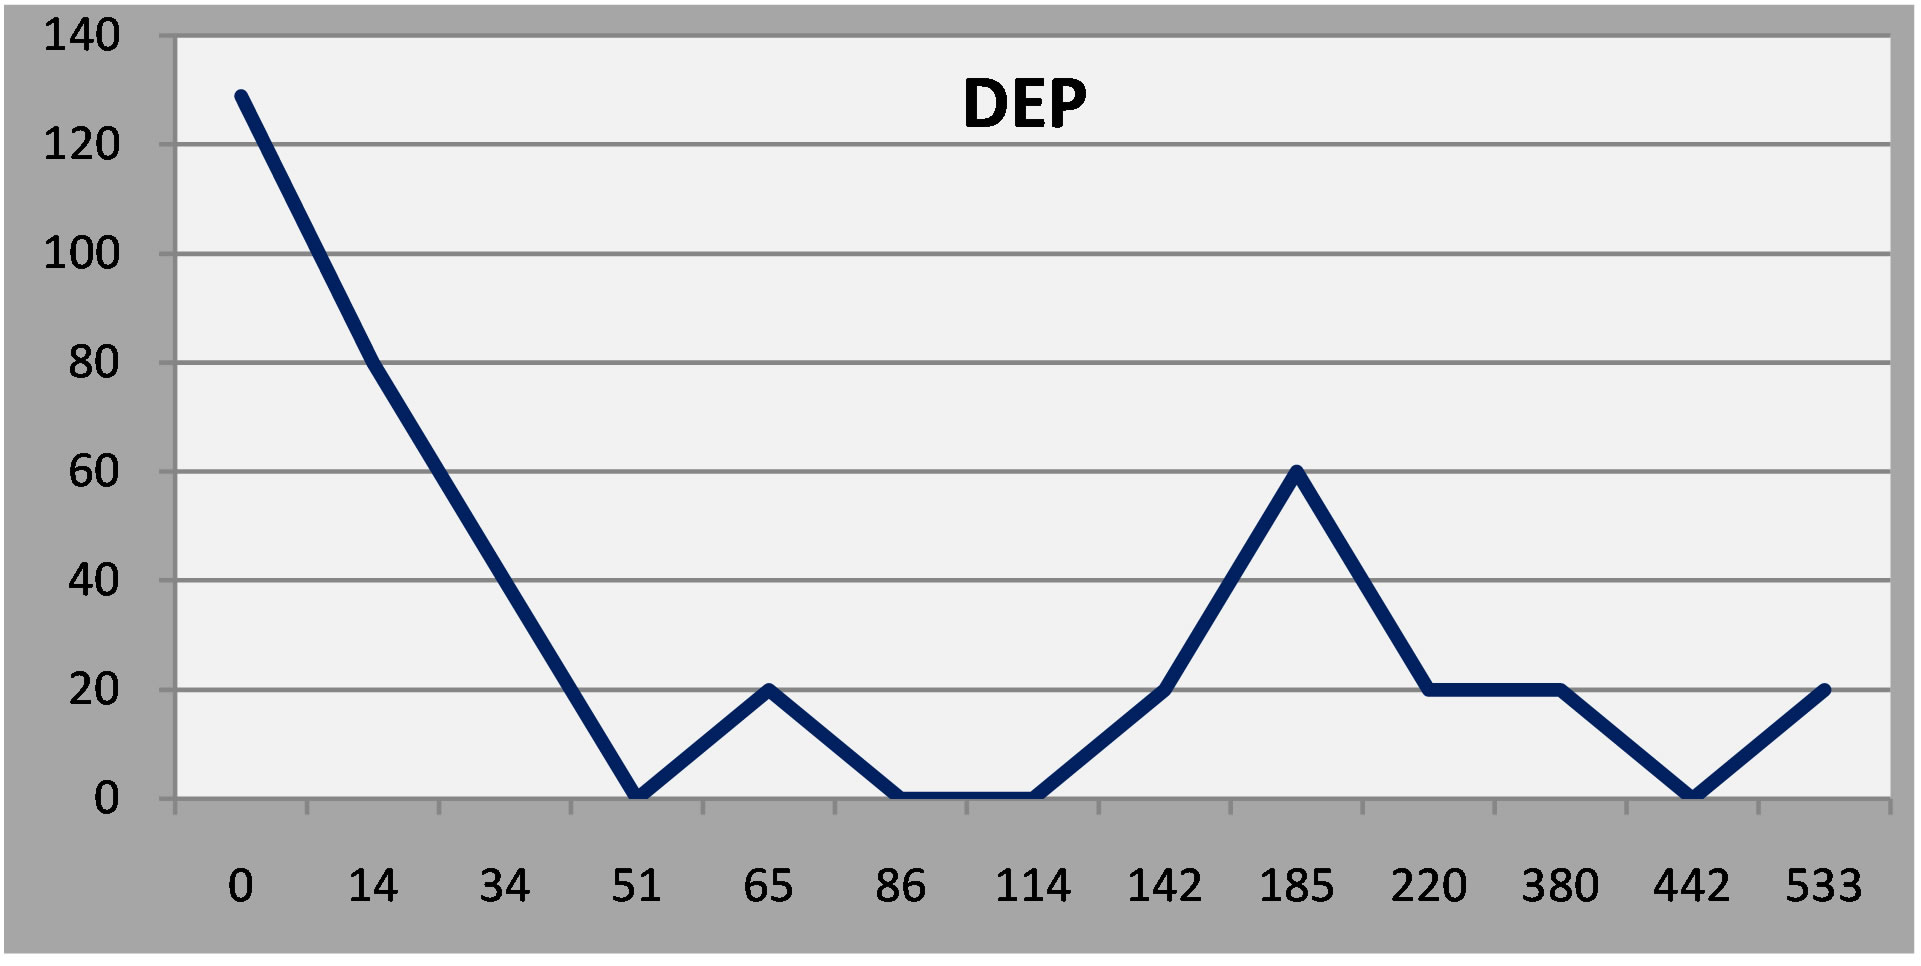
Figure 4. Patient 2: A robust early response and then a minor remission at six months.
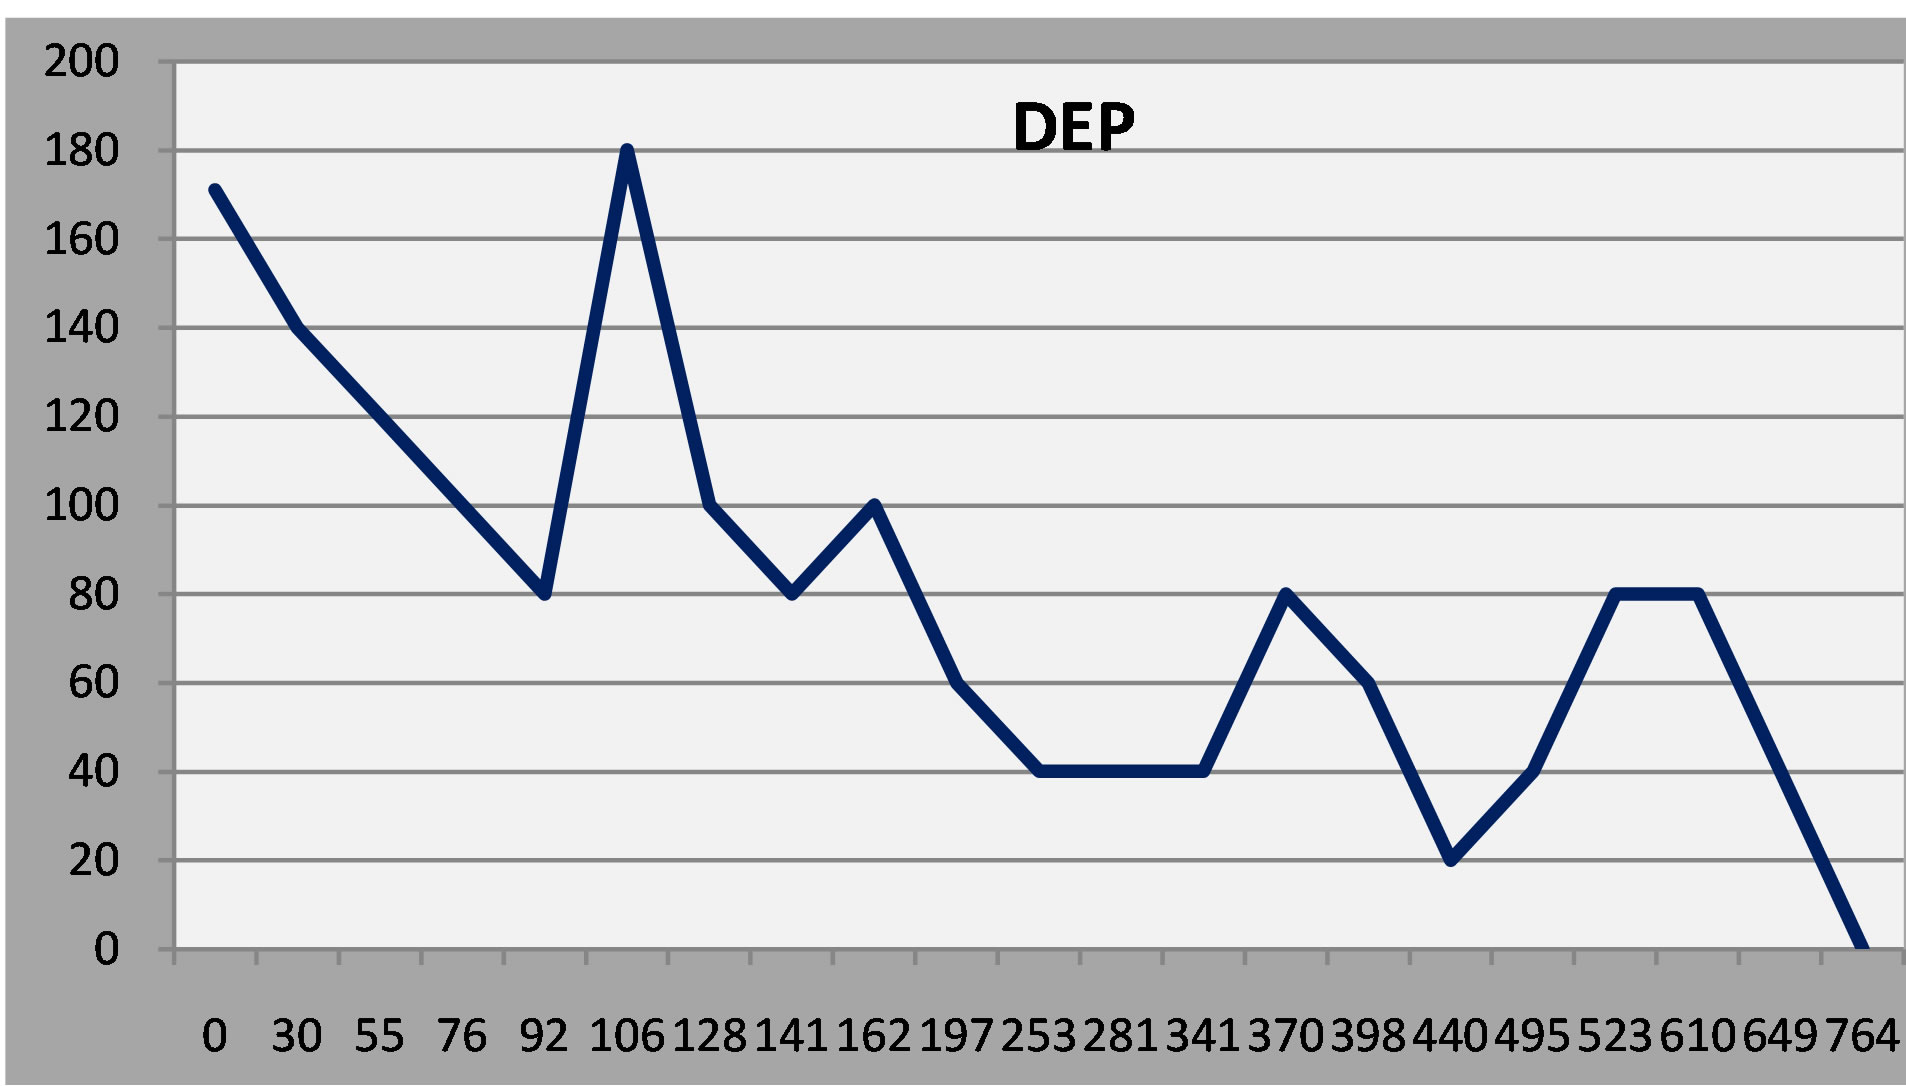
Figure 5. Patient 3: Initial response to treatment, relapse and then gradual improvement.
(Normal Ss rarely, if ever, score above 50 on any of the scales.)
The second patient had a robust early response to antidepressant treatment but had a minor relapse after 6 months and required dose adjustment. The third patient responded at first, relapsed, and then improved gradually over time after a mood stabilizer was added.
The fourth patient, with epilepsy and mild cognitive impairment, had a persistent, moderate depression in spite of vigorous treatment. Examining other factor scales on the NP3, however, indicates that depressive symptoms were more or less stable, in the face of worsening in cognitive and somatic symptoms (Linear regression lines added to the serial report).
 (a)
(a)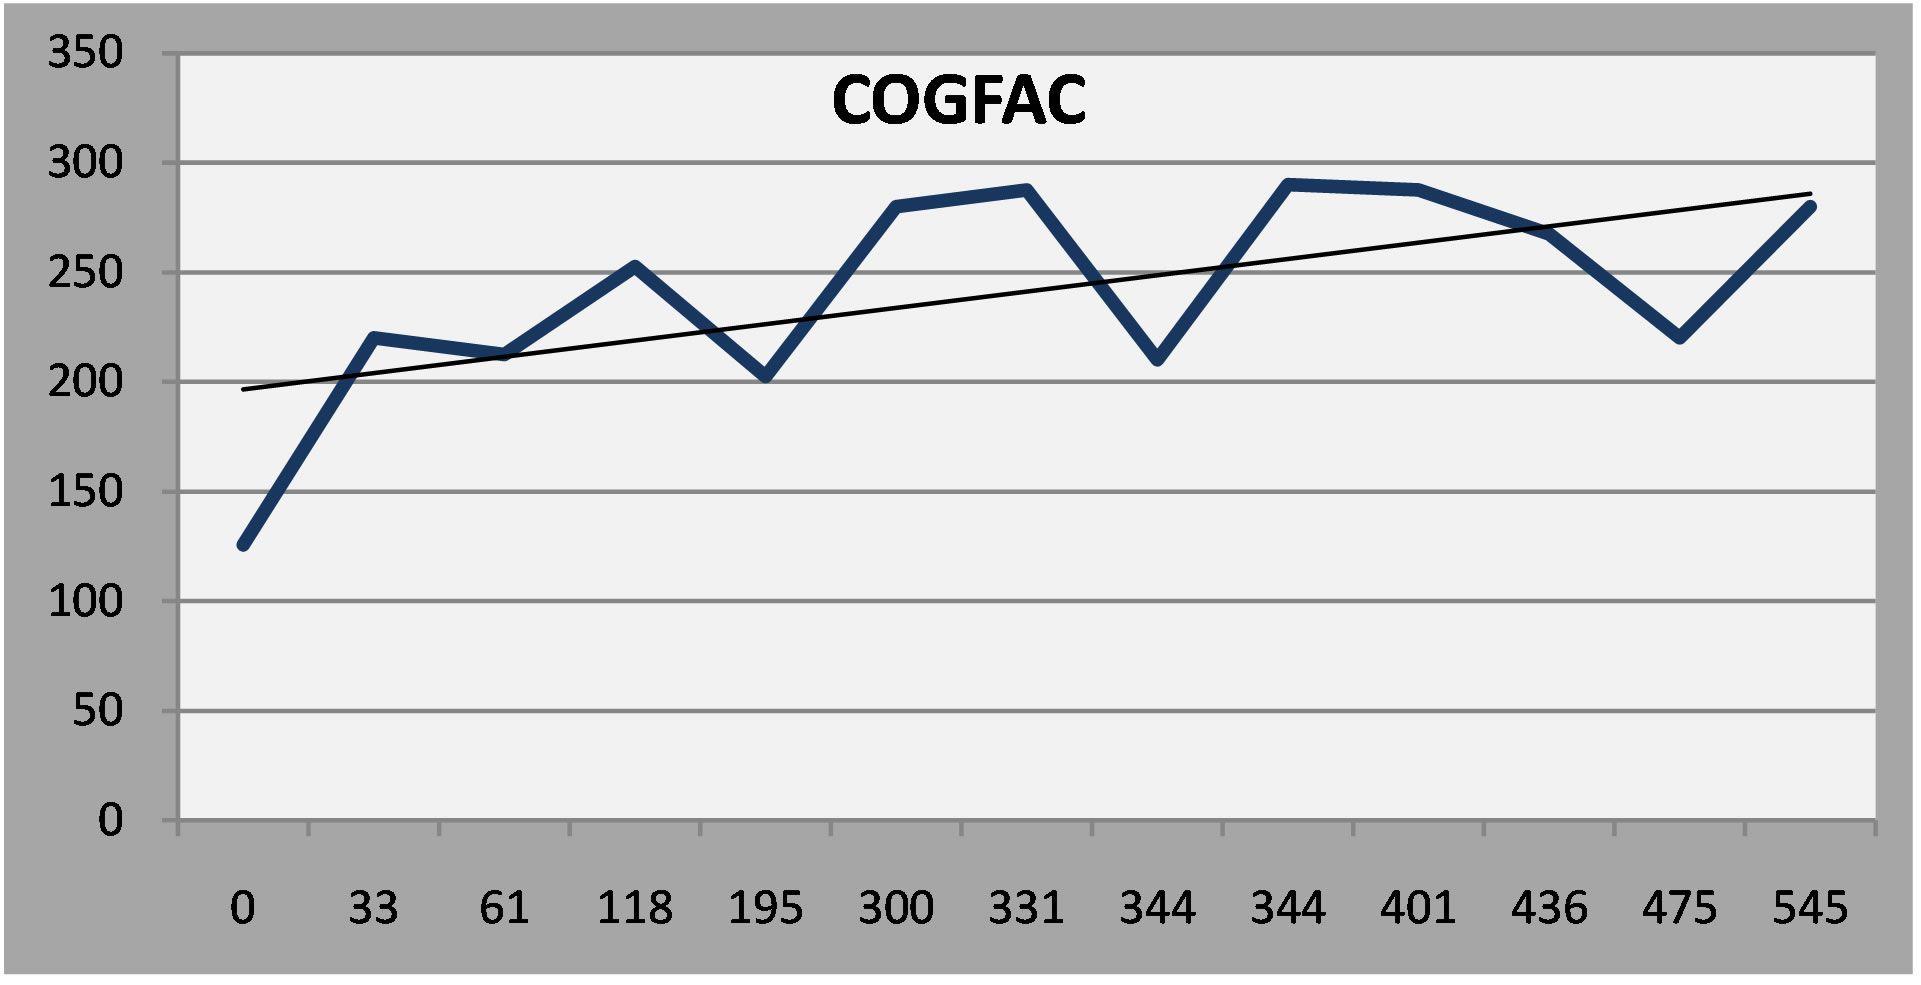 (b)
(b)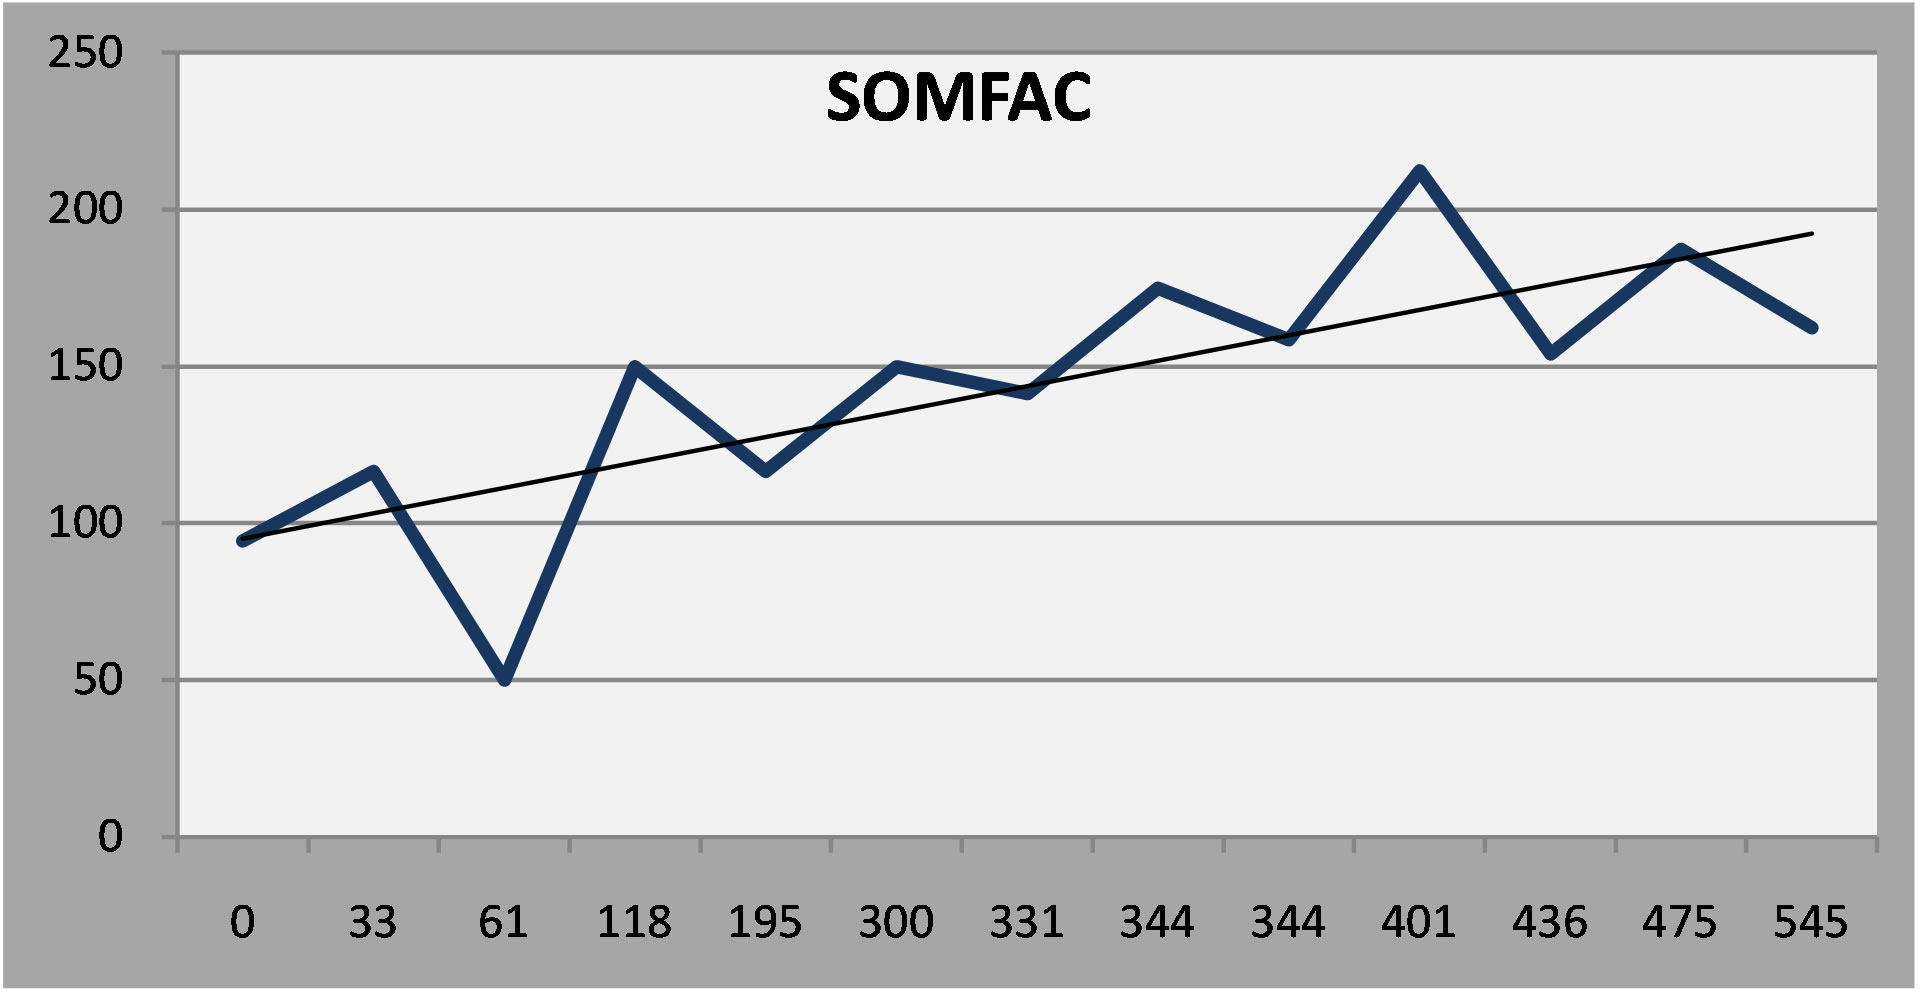 (c)
(c)
Figure 6. (a) Patient 4: Moderate depression that persisted in spite of treatment; (b) Patient 4: Cognitive symptoms increased over time; (c) Somatic symptoms increased over time.
4. Discussion
The NP3 is a unique instrument, a broad-spectrum neuropsychiatric symptom questionnaire that is freely available on the internet and capable of generating serial reports as patients are followed over time. Data can be collected from patients and from other informants in the doctor’s office or from remote sites. A patient who comes alone to the clinic, for example, can call his wife at work, and ask her to do the NP3 right then; her results are immediately available. This makes the collection of data quite efficient and eliminates the time and errors implicit to paper-based rating scales.
The NP3 was designed for a neuropsychiatric clinic, where the majority of patients present with mood or cognitive problems. The template for NP3 is flexible, however: the items, scales and factors can be changed, with a minimum of programming knowledge, to accommodate the demands of clinics that see different kinds of patients.
The results generated by the NP3 correlate as well to established clinical rating scales as they do to each other. In a previous publication, we reported the test-retest reliability in 75 neuropsychiatric patients who had been administered the NP3 on two occasions within three months. The average reliability coefficient (Pearson’s Product-Moment Correlation) was 0.74 with a range of 0.88 (OC) to 0.54 (SLEEP). We also reported correlations between NP3 scales and the relevant scales on the Personality Assessment Inventory in 144 adult patients who had taken both tests: DEP (depression) and CDEP, r = 0.67; ANX (anxiety) and CANX, r = 0.0.55; MANIA (mania) and CMAN, r = 0.43; PSYCH (psychosis) and CPAR r = 0.62; AGG (aggression) and SAGG, r = 0.65.
In this report we examined the correlations between NP3 and other rating scales. NP3 is more similar to other patient rating scales than to clinician-rated scales. The correlation between the DEP scale on NP3, for example, with the Beck Depression Inventory (patient report) is 0.78 but only 0.61 with Hamilton Depression Rating Scale and 0.56 with the Montgomery-Asberg Depression Rating Scale, which are completed by clinicians. The ANX scale correlates with the Beck Anxiety Inventory @ r = 0.58 but with the Hamilton Anxiety Rating Scale at 0.45.
The correlations are only moderate, but more respectable if one allows for the reliability of the respective instruments. So, if the reliability of NP3 is 0.74 and the reliability of the Hamilton Depression Rating Scale is 0.85, the maximum correlation between the two instruments is the square root of the product of their reliabilities, or (0.74*0.85)1/2, or 0.793. By this formula, the adjusted correlation between NP3 and the HamD is 0.77. In any event, it appears that moderate-to-poor correlations are the rule when clinician rating scales are compared to patient self-report rating scales. For example, in a review of seven studies comparing the HamD to the BDI, the correlations ranged from 0.21 to 0.82 [17] and in nine similar studies, correlations between the HamD and the Zung Self-rating scale Depression Scale ranged from 0.22 to 0.95 [18,19]. The reliability of the NP3 is moreor-less equivalent to published data for other scales.
Routine quantitative measurement has been described as “a costly exercise” with little “robust” evidence to suggest that it is of benefit in improving outcomes [20]. Absence of evidence, however, is not a compelling argument, as new technologies afford methods for a systematic approach to patient evaluation, at minimal cost, and with the potential to generate summary statistics about the course of treatment not only in individual patients, but also in aggregates of patients. The game has changed when the time required to generate a serial report of a patient’s symptom load over years of treatment takes a few seconds after he or she has completed an updated short form.
The NP3 is a simple instrument. It uses a PC to ask the patient or a knowledgeable informant about patients’ symptoms, perceived within a designated time frame. But it is no more than what it appears: a symptom checklist that is quick, cheap and easy to use. If it is not comprehensive, at least it covers a lot of ground. It is necessarily limited because it relies on an informant’s ability, or his inclination, to disclose accurate information. Thus, the report generated by the NP3 includes this caveat:
A high score means that the patient is reporting more symptoms of greater intensity. It doesn’t necessarily mean that the patient has a particular condition; just that he or she (or their spouse, parent or caregiver) are saying that he or she has a lot of symptoms in a particular area. Conversely, a low score simply means that the patient (or caregiver) is not reporting symptoms associated with a particular condition, at least during the period of time specified. It does not mean that the patient does not have a condition. Just as some people over-state their problems, others tend to under-state their problems. The NP3 is not a diagnostic instrument. The results it generates are meant to be interpreted by an experienced clinician in the course of a clinical examination.
Acknowledgements
Dr. Gualtieri is one of the developers of the CNS Vital Signs screening battery and a principal of CNS Vital Signs LLC. He has conducted clinical trials on behalf of Astra-Zeneca, Bristol-Myers Squibb, Celltech, Cephalon, Eli Lilly, Glaxo-Smith-Kline, Medeva, Organon, Shire, Wyeth-Ayerst, Orhto-McNeil and UCB. He has been a speaker for and/or consultant to Eli Lilly, GSK, Pfizer, Shire and Wyeth. This research was supported by North Carolina Neurocognition, LLC. The NPQ is not a commercial property and is freely available at www.atonc.com.
Disclosures
No external support was sought or received on behalf of this research.
REFERENCES
- M. Slade, P. McCrone, E. Kuipers, M. Leese, S. Cahill, A. Parabiaghi, S. Priebe and G. Thornicroft, “Use of Standardised Outcome Measures in Adult Mental Health Services: Randomised Controlled Trial,” The British Journal of Psychiatry: The Journal of Mental Science, Vol. 189, 2006, pp. 330-336. http://dx.doi.org/10.1192/bjp.bp.105.015412
- D. Guthrie, M. McIntosh, T. Callaly, T. Trauer and T. Coombs, “Consumer Attitudes towards the Use of Routine Outcome Measures in a Public Mental Health Service: A Consumer-Driven Study,” International Journal of Mental Health Nursing, Vol. 17, No. 2, 2008, pp. 92-97. http://dx.doi.org/10.1111/j.1447-0349.2008.00516.x
- K. Eagar, T. Trauer and G. Mellsop, “Performance of Routine Outcome Measures in Adult Mental Health Care,” The Australian and New Zealand Journal of Psychiatry, Vol. 39, No. 8, 2005, pp. 713-718. http://dx.doi.org/10.1111/j.1440-1614.2005.01655.x
- A. S. Kesselheim, T. G. Ferris and D. M. Studdert, “Will Physician-Level Measures of Clinical Performance Be Used in Medical Malpractice Litigation?” JAMA: The Journal of the American Medical Association, Vol. 295, No. 15, 2006, pp. 1831-1834. http://dx.doi.org/10.1001/jama.295.15.1831
- D. Srebnik, M. Hendryx, J. Stevenson, S. Caverly, D. G. Dyck and A. M. Cauce, “Development of Outcome Indicators for Monitoring the Quality of Public Mental Health Care,” Psychiatric Services (Washington, DC), Vol. 48, No. 7, 1997, pp. 903-909.
- J. N. Butcher, J. N. Perry and M. M. Atlis, “Validity and Utility of Computer-Based Test Interpretation,” Psychological Assessment, Vol. 12, No. 1, 2000, pp. 6-18. http://dx.doi.org/10.1037/1040-3590.12.1.6
- H. N. Garb, “Computer-Administered Interviews and Rating Scales,” Psychological Assessment, Vol. 19, No. 1, 2007, pp. 4-13. http://dx.doi.org/10.1037/1040-3590.19.1.4
- B. Byrom and J. C. Mundt, “The Value of ComputerAdministered Self-Report Data in Central Nervous System Clinical Trials,” Current Opinion in Drug Discovery & Development, Vol. 8, No. 3, 2005, pp. 374-383.
- K. A. Kobak, J. H. Greist, J. W. Jefferson and D. J. Katzelnick, “Computer-Administered Clinical Rating Scales. A Review,” Psychopharmacology, Vol. 127, No. 4, 1996, pp. 291-301. http://dx.doi.org/10.1007/s002130050089
- K. A. Kobak, W. M. Reynolds and J. H. Griest, “Computerized and Clinician Assessment of Depression and Anxiety: Respondent Evaluation and Satisfaction,” Journal of Personality Assessment, Vol. 63, No. 1, 1994, pp. 173- 180. http://dx.doi.org/10.1207/s15327752jpa6301_14
- K. A. Kobak, S. C. Schaettle, J. H. Greist, J. W. Jefferson, D. J. Katzelnick and S. L. Dottl, “Computer-Administered Rating Scales for Social Anxiety in a Clinical Drug Trial,” Depression and Anxiety, Vol. 7, No. 3, 1998, pp. 97-104. http://dx.doi.org/10.1002/(SICI)1520-6394(1998)7:3<97::AID-DA1>3.0.CO;2-2
- K. A. Kobak, L. H. Taylor, S. L. Dottl, J. H. Greist, J. W. Jefferson, D. Burroughs, J. M. Mantle, et al., “A Computer-Administered Telephone Interview to Identify Mental Disorders,” JAMA: The Journal of the American Medical Association, Vol. 278, No. 11, 1997, pp. 905-910.
- P. M. Symonds, “On the Loss of Reliability in Ratings Due to the Coarseness of the Scale,” Journal of Experimental Psychology, Vol. 7, No. 6, 1924, pp. 456-461. http://dx.doi.org/10.1037/h0074469
- W. R. Garner, “Rating Scales, Discriminability, and Information Transmission,” Psychological Review, Vol. 67, No. 6, 1960, pp. 343-352.
- C. C. Preston and A. M. Colman, “Optimal Number of Response Categories in Rating Scales: Reliability, Validity, Discriminating Power, and Respondent Preferences,” Acta Psychologica, Vol. 104, No. 1, 2000, pp. 1-15. http://dx.doi.org/10.1016/S0001-6918(99)00050-5
- H. G. Schutz and M. H. Rucker, “Variable Configurations across Scale Lengths: An Empirical Study,” Educational and Psychological Measurement, Vol. 35, No. 2, 1975, pp. 319-324. http://dx.doi.org/10.1177/001316447503500210
- R. Berzon, R. D. Hays and S. A. Shumaker, “International Use, Application and Performance of Health-Related Quality of Life Instruments,” Quality of Life Research: An International Journal of Quality of Life Aspects of Treatment, Care and Rehabilitation, Vol. 2, No. 6, 1993, pp. 367-368.
- J. L. Hedlund and B. W. Vieweg, “The Hamilton Rating Scale for Depression: A Comprehensive Review,” Journal of Operational Psychiatry, Vol. 10, 1979, pp. 149- 165.
- I. McDowell and C. Newell, “Measuring Health. A Guide to Rating Scales and Questionnaires,” 2nd Edition, Oxford University Press, New York, 1996.
- S. M. Gilbody, A. O. House and T. Sheldon, “Routine Administration of Health Related Quality of Life (HRQoL) and Needs Assessment Instruments to Improve Psychological Outcome—A Systematic Review,” Psychological Medicine, Vol. 32, No. 8, 2002, pp. 1345-1356. http://dx.doi.org/10.1017/S0033291702006001