American Journal of Analytical Chemistry
Vol.4 No.7A(2013), Article ID:34442,6 pages DOI:10.4236/ajac.2013.47A011
Molecular Adsorption and Desorption Behavior on Silicon Surface in a Complex Ambient Atmosphere Containing Vapors of Diethylphthalate, Acetic Acid and Water
Department of Chemical and Energy Engineering, Yokohama National University, Yokohama, Japan
Email: *habuka1@ynu.ac.jp
Copyright © 2013 Hitoshi Habuka et al. This is an open access article distributed under the Creative Commons Attribution License, which permits unrestricted use, distribution, and reproduction in any medium, provided the original work is properly cited.
Received May 11, 2013; revised June 12, 2013; accepted June 30, 2013
Keywords: Silicon Surface; Diethylphthalate; Acetic Acid; Physisorption; Desorption
ABSTRACT
Using a complex ambient atmosphere containing vapors of an organic compound, acid and water, the molecular adsorption and desorption behavior on a silicon surface was studied using the in-situ measurement of a quartz crystal microbalance linked to the rate theory. Because the behavior of diethylphthalate (DEP) could be reproduced assuming a single-component system, acetic acid (ACA) and DEP are concluded to separately exist in the water film and at the water film surface, respectively. This conclusion was obtained from both the adsorption and desorption behaviors. The process developed in this study is useful for determining the layer in which chemical compounds are present.
1. Introduction
For various manufacturing industries, a material’s surface condition is an important issue. Various kinds of chemical compounds existing in the ambient atmosphere, such as acids, bases, organic compounds, inorganic compounds, and metals, can adsorb at the material surface [1-8]. This potentially multiple-component contamination is a fundamental problem in many industrial processes that use or produce highly clean surfaces, such as wet cleaning, lithography, etc. Thus, the complex adsorption and desorption behavior in a multi-component ambient should be clarified.
For this purpose, the complicated adsorption and desorption behaviors of organic compounds on a silicon surface have been studied [9-14] using the in situ measurement method of the quartz crystal microbalance (QCM) and the rate theory of the multi-component organic species adsorption-induced contamination (MOSAIC) model [9]. As an extension, the authors studied the acetic acid (ACA) behavior [15] on a silicon surface.
For further understanding the actual surface condition, the adsorption and desorption behaviors provide valuable information in a complex ambient atmosphere containing acids and organic compounds. In those systems containing humidity, hydrophilic compounds, such as acids, tend to be contained in the water film produced by water vapor [6], while organic compounds can remain at the water film surface. Thus, a facile and simple process should be developed to identify the layer where the chemical compounds prevail.
In this study, the molecular adsorption and desorption behaviors were studied on a silicon surface (covered with a dynamic equilibrium water film) in a complex ambient gas consisting of ACA, DEP, water vapor and nitrogen using the QCM and the MOSAIC model. A process for determining the actual position of the DEP and ACA was developed using two assumptions, such as the singlecomponent system of DEP and the two-component system of DEP and ACA. In this study, DEP and ACA were used in this study as model substances for frequently used hydrophobic compounds and acids, for which the individual adsorption and desorption rate parameters on Si surfaces in humid ambient have already been obtained [13,15].
2. Experimental
Figure 1 shows the QCM system used to measure the adsorption and desorption of DEP and ACA on a silicon surface in an ambient atmosphere containing humidity. The QCM sensor (Halloran Electronics Co., Ltd., Tokyo)

Figure 1. Quartz crystal microbalance system used to measure the adsorption and desorption of molecules on a silicon surface in a complex ambient atmosphere containing vapors of DEP, ACA and water in nitrogen.
consisted of a circular-shaped quartz plate, AT-cut [16], with an 8-mm diameter. Its front and back sides were circular silicon electrodes formed by sputtering. The amounts of the adsorbed and desorbed chemical compounds on the silicon surface were evaluated using the decrease and increase in the frequency of the QCM sensor, respectively. The frequency of the QCM sensor was adjusted to 25 MHz. A decrease in the frequency of 1 Hz showed an increase in the surface concentration of 0.5 ng·cm−2 for the QCM sensor used in this study.
The gas supply tube and the chamber were made of stainless steel. The gas mixture was introduced at 298 K and atmospheric pressure into the stainless steel chamber, which had a cylindrical geometry with a 200 mm length and a 30-mm inner diameter. The gas mixture flowed in a direction parallel to the surface of the QCM sensor in the chamber. The average gas velocity in the chamber was adjusted to 0.3 m·s−1, which corresponded to the typical air velocity in a clean room.
The liquid reservoirs were made of a fluorocarbon resin (polytetrafluoroethylene), which was found to cause a negligibly small amount of outgas after long purging using nitrogen gas, based on our initial evaluation. The water, DEP and ACA were vaporized by nitrogen gas flowing through the liquid container. The vaporized amounts of water, DEP and ACA were obtained by measuring their weight decrease after the measurement. The gas phase concentration was adjusted by the nitrogen gas flow rate. The relative humidity (RH) was obtained by dividing the gas phase concentration of water by its saturated value [17] at the temperature of the QCM system under given nitrogen dynamic flow conditions. RH was adjusted to 30%, which was comparable to that in a clean room used for manufacturing various electronic devices. The water film thickness under this condition is around 100 ng/cm2 as reported previously [6,12]. Considering the water monolayer weight of about 30 ng/cm2, this suggests that the water film is comprised of several molecular layers. The gas phase concentrations of the DEP and ACA were 0 - 10 and 0 - 370 ng·cm−3, respectively. The ACA concentration in the water film was about 10 weight percent [15]. The surface concentrations of DEP (~10 ng/cm2) and ACA (<5 ng/cm2) measured in this study were much below the respective DEP and ACA monolayer weights of 77 and 47 ng/cm2 (relative to the molecular layer density of liquid water). At such small surface concentrations in the sub-monolayer regime, the (co-) condensation of DEP and ACA in the form of multilayer on the water film can safely be ignored.
After supplying the water, DEP and ACA, the frequency of QCM sensor became stable, showing a steady state. From this frequency, the DEP concentration in a steady state, SDEP,0, could be obtained. Next, in order to measure the DEP desorption process, the DEP supply was terminated by stopping the nitrogen gas supply to the DEP container. Through this process, although the nitrogen flow rates to the water container and the DEP container were kept constant, the total nitrogen flow rate was maintained by adjusting the main nitrogen flow rate.
3. Rate Theory
3.1. Surface Condition
Figure 2 shows the possible conditions of the silicon surface in the humid ambient atmosphere. Water vapor produces a very thin water film [6] on the silicon surface. DEP and ACA adsorb to the water film surface from the gas phase. The water film stays in a dynamic equilibrium with the wettability of the silicon native oxide surface and the environment i.e. RH. DEP has been recognized to be adsorbed on the water film surface [13,14]. In contrast, our previous study showed that ACA might be contained in the water film, partially dissociated [15]. Thus, the following two models have been evaluated in this study.
Model 1: ACA and DEP coexist and share the water film surface, as shown in Figure 2(a).
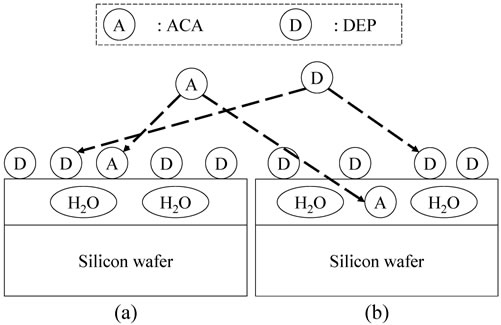
Figure 2. DEP and ACA on the silicon wafer surface. (a) Model 1: ACA on the water film; and (b) Model 2: ACA in the water film.
Model 2: ACA exists in the water film; DEP is adsorbed on the water film surface, as shown in Figure 2(b).
3.2. Model 1: Multi-Component System
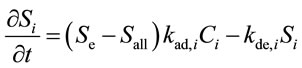
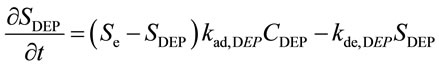
Using the MOSAIC model [9], the time-dependent adsorption and desorption behavior of chemical compounds on a surface is described as follows:
 (1)
(1)
 (2)
(2)
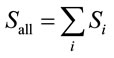
where t is the time (s). Si and Ci are the water film surface concentration (ng·cm−2) and the gas phase concentration (ng·cm−3), respectively, of chemical compound i. kad,i and kde,i are the adsorption rate constant (cm3·ng−1·s−1) and the desorption rate constant (s−1), respectively, of chemical compound i. Sall is the total concentration of chemical compounds on the water film surface (ng·cm−2). Se is the effective upper limit of the total concentration of chemical compounds on the water film surface (ng·cm−2).
When ACA and DEP coexist at the surface, as shown in Figure 2(a), Equations (1) and (2) can be written in the form of a two-component system.
 (3)
(3)
 (4)
(4)
 (5)
(5)
Using Equations (3) and (4) in the steady state, Se and Sall are shown to have the following relationship.
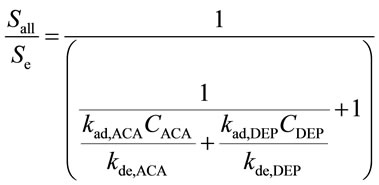 (6)
(6)
3.3. Model 2: Single-Component System
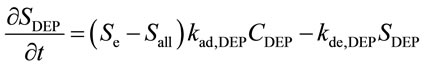
Taking into account that the ACA is very easily dissolved in water [17], it is assumed to exist in the thin water film, as shown in Figure 2(b). This suggests that DEP may behave as a single-component system. Thus, Equation (1) for a single-component system of DEP is written as follows:
 (7)
(7)
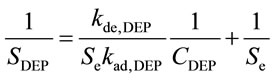
In the steady state, there is a linear relationship between 1/SDEP and 1/CDEP, as denoted by Equation (8) [13].
 (8)
(8)
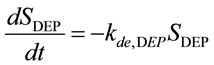
Using this equation, the values of kde, DEP/kad, DEP and Se can be obtained. The desorption rate constant is obtained using Equation (9) [13] along with the DEP desorption process by fixing the ACA concentration and the humidity in the gas phase.
 (9)
(9)
4. Results and Discussion
4.1. Desorption Behavior
The difference between Model 1 and Model 2 is expected to appear through the desorption process of DEP, as shown in Figure 3. When DEP exists with ACA on the water film surface in a two-component system, following Model 1, the surface concentration decrease induced by the DEP desorption, as indicated by the solid line in Figure 3(a), is moderated due to the ACA adsorption, following Equation (1) and indicated by the dotted line in Figure 3(a). Thus, the apparent DEP desorption rate through the DEP desorption process should be lower than that from the condition without ACA.
In contrast, Model 2 predicts that the DEP simply desorbs from the water film surface, following Equation (9) as shown in Figure 3(b). Because the amount of ACA in the water film does not change, the desorption rate constant of DEP is expected to be similar to that obtained from the condition without ACA. Taking into account that the water film surface condition may be slightly influenced by the contained ACA, the desorption rate constant can increase or decrease following the interaction
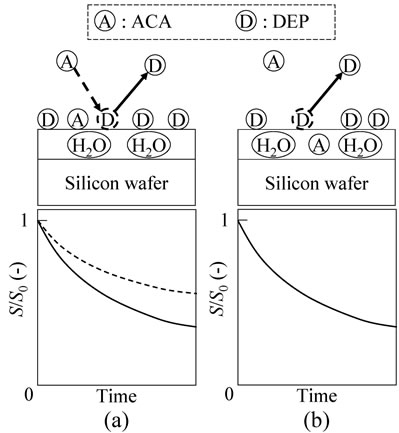
Figure 3. Desorption process of DEP from the silicon wafer surface. (a) Model 1: ACA on the water film; and (b) Model 2: ACA in the water film.
between the DEP and water film surface containing ACA. Thus, if the desorption rate constant decrease was unfortunately observed, the validity of Models 1 and 2 cannot be stated. However, if the DEP desorption rate constant was maintained or increased in the ambient gas containing ACA, Model 2 is valid.
Figure 4 shows the desorption behavior of DEP in the ambient atmosphere without ACA (white circles) and with ACA at 370 ng·cm−3 (dark circles). This figure shows that the DEP desorption rate increased by adding ACA in the gas phase. The kde,DEP value was 0.014 and 0.13 s−1 for without and with ACA, respectively. Thus, Model 2 was considered to be valid due to the increase in the desorption rate by the addition of ACA.
Assuming Model 2, the interaction between DEP and the water film surface is expected to change with the amount of ACA contained in the water film, because the surface condition change is due to the presence of ACA. The desorption rate constant increased with the increasing ACA concentration in the gas phase in Figure 5. These trends indicate that the interaction between the DEP and the water film surface changes with the ACA content in the water film.
4.2. Adsorption Behavior
Figure 6 shows the relationship between 1/SDEP and 1/CDEP for without (white circle) and with ACA (dark
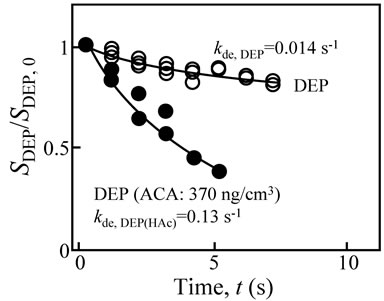
Figure 4. Desorption behavior of DEP in the ambient atmosphere without ACA (white circles) and with ACA (dark circles).
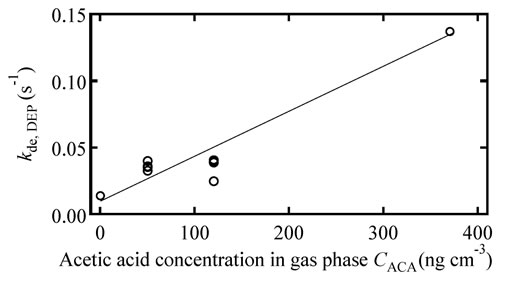
Figure 5. Desorption rate constant of DEP versus the ACA concentration in the gas phase.
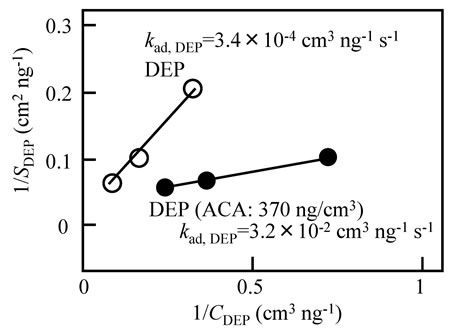
Figure 6. The 1/SDEP value versus the 1/CDEP value in the ambient atmosphere without ACA (white circle) and with ACA (dark circle).
circle) in the gas phase. In this figure, both the white circle and dark circle have a linear relationship, following Equation (8). Based on this figure, the kad,DEP value was 3.4 × 10⁻⁴ and 3.2 × 10⁻² cm3·ng−1·s−1 in the ambient atmosphere without and with ACA, respectively. This indicates that DEP behaves like adsorbed in the single-component system; the adsorption rate was increased by adding ACA in the gas phase. In Figure 7, the adsorption rate constant of the DEP gradually increased with the increasing ACA concentration in the gas phase, similar to the desorption rate constant.
The adsorption behavior was further evaluated. When the DEP and ACA coexist at the water film surface, the Sall value could be described by Equation (6). For this evaluation, the kad,DEP and kde,DEP values used are those obtained under the condition without ACA. The result, when changing the DEP gas phase concentration, is shown in Figure 8. In this figure, the Sall/Se value was normalized using that at the DEP gas phase concentration of 1.4 ng·cm−3.
As shown in Figure 8, the calculation assuming the two-component system predicts only a small change in Sall (<6%). However, the measurement showed that the Sall value had a 40% change. Thus, Equation (6) is concluded to be unsuitable for describing the DEP and ACA system. For the adsorption and desorption behavior of DEP in an ambient atmosphere, Model 2 can be used.
The increase in the rate constants for the adsorption and desorption indicated that the ACA in the water film enhanced the interaction between the DEP and water film. Because the intramolecular interaction is a very complicated subject [18,19], the interaction between DEP and the water film is simply assumed in this study as that between the four oxygen atoms of the DEP and water film. The hydrogen bonding and electrostatic attractive force increased over the water film surface due to the H+ ion increase from the ACA. However, when DEP rotating and moving over the water film surface meets with the CH3COO− ion present in the water film, which
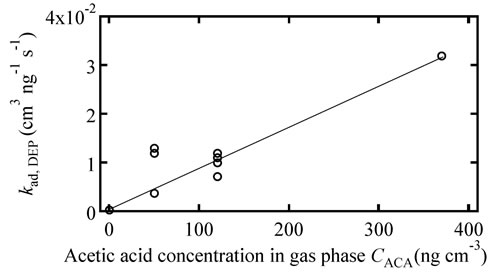
Figure 7. Adsorption rate constant of DEP versus the ACA concentration in the gas phase.
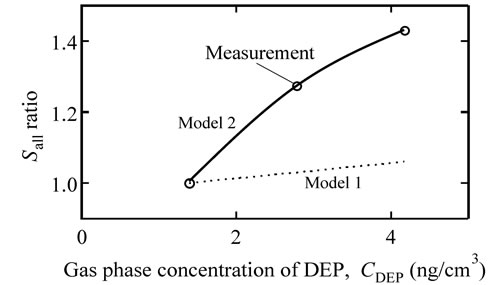
Figure 8. The Sall ratio versus the CDEP value in the ambient atmosphere containing ACA vapor. White circle is the measurement. Dotted line and solid line are the calculation by Model 1 and Model 2, respectively.
strongly combined with the water film surface, a local electrostatic repulsive force between the oxygen atoms induces the DEP desorption. Thus, both the adsorption and desorption rate can be enhanced by ACA. Based on the details of the molecular interactions, the process developed in this study will be useful for evaluating various phenomena. For extending this study, the details of the interactions between ACA, DEP and water should be clarified, because the details may give additional information for improving Model 2. Additionally, the influences of various acids and bases, such as ammonia, should be studied.
5. Conclusion
The molecular adsorption and desorption behavior on a silicon surface in a complex ambient atmosphere containing vapors of DEP, ACA and water in nitrogen was studied using the in-situ measurements from a quartz crystal microbalance and the rate theory. Because the DEP behavior of the adsorption and desorption in an ambient atmosphere containing a fixed amount of ACA and humidity was consistent with that from the rate theory when assuming the single-component system, ACA and DEP can separately exist in the water film and at the water film surface, respectively. The process used in this study will be useful for identifying the layer in which the various chemical compounds are present. Extending these studies, the process developed in this study should be applied to the environment analysis in various industrial fields for creating and using a highly clean surface.
6. Acknowledgements
The authors thank Mr. Nobuyoshi Enomoto of Halloran Electronics Co., Ltd., for his helpful suggestions and support.
REFERENCES
- S. D. Gendt, D. M. Knotter, K. Kenis, M. Depas, M. Meuris, P. W. Mertens and M. M. Heyns, “Impact of Organic Contamination on Thin Gate Oxide Quality,” Japanese Journal of Applied Physics, Vol. 37, No. 9A, 1998, pp. 4649-4655. doi:10.1143/JJAP.37.4649
- F. Sugimoto, S. Okamura, T. Inokuma, Y. Kurata and S. Hasegawa, “Influence of Organic Contamination on Silicon Dioxide Integrity,” Japanese Journal of Applied Physics, Vol. 39, No. 5A, 2000, pp. 2497-2502. doi:10.1143/JJAP.39.2497
- Y. Kang, W. Den and H. Bai, “Short Time Deposition Kinetics of Diethyl Phthalate and Dibutyl Phthalate on a Silicon Wafer Surface,” Industrial & Engineering Chemistry Research, Vol. 45, No. 4, 2006, pp. 1331-1336. doi:10.1021/ie050754s
- K. Saga and T. Hattori, “Analysis of Organic Contamination Adsorbed on a Silicon Surface in a Vacuum Chamber in Electron Beam Lithography,” Journal of the Electrochemical Society, Vol. 152, No. 6, 2005, pp. G494- G499. doi:10.1149/1.1914756
- K. S. Kim, J. Y. Kim, H. B. Kang, B. Y. Lee and S. M. Park, “Effects of Organic Contaminants during Metal Oxide Semiconductor Processes,” Journal of the Electrochemical Society, Vol. 155, No. 6, 2008, pp. H426-H431.
- T. Takahagi, S. Shingubara, H. Sakaue, K. Hoshino and H. Yashima, “Study on Adsorption Behavior of Organic Contaminations on Silicon Surface by Gas Chromatography/Mass Spectrometry,” Japanese Journal of Applied Physics, Vol. 35, No. 7A, 1996, pp. L818-L821.
- S. Tlili, E. G. Alvarez, S. Gligorovski and H. Wortham, “Adsorption Behavior of Two Model Airborne Organic Contaminants on Wafer Surfaces,” Chemical Engineering Journal, Vol. 187, No. 1-2, 2012, pp. 239-247. doi:10.1016/j.cej.2012.01.067
- T. Ehmann, L. Fabry, H. Ruefer, L. Kotz, S. Pahlke and C. Mantler, “Modification and Validation of the Pyromellitic Acid Electrolyte for the Capillary Electrophoretic Determination of Anions,” Journal of Chromatography A, Vol. 995, No. 1-2, 2003, pp. 217-226. doi:10.1016/S0021-9673(03)00488-6
- H. Habuka, M. Shimada and K. Okuyama, “Rate Theory of Multicomponent Adsorption of Organic Species on Silicon Wafer Surface,” Journal of the Electrochemical Society, Vol. 147, No. 6, 2000, pp. 2319-2323. doi:10.1149/1.1393527
- H. Habuka, M. Shimada and K. Okuyama, “Adsorption and Desorption Rate of Multicomponent Organic Species on Silicon Wafer Surface,” Journal of the Electrochemical Society, Vol. 148, No. 7, 2001, pp. G365-G369. doi:10.1149/1.1373660
- H. Habuka, K. Suzuki, S. Okamura, M. Shimada and K. Okuyama, “QCM for Si Surface Organic Contamination,” Journal of the Electrochemical Society, Vol. 152, No. 4, 2005, pp. G241-G245. doi:10.1149/1.1864472
- H. Habuka, M. Tawada, T. Takeuchi and M. Aihara, “Gas Velocity Influence on Silicon Surface Organic Contamination Evaluated Using Quartz Crystal Microbalance,” Journal of the Electrochemical Society, Vol. 152, No. 11, 2005, pp. G862-G866. doi:10.1149/1.2051869
- H. Habuka and D. Yamaya, “Physisorption and Desorption of Diethylphthalate and Isopropanol on a Silicon Surface,” Journal of the Electrochemical Society, Vol. 154, No. 12, 2007, pp. H1031-H1035. doi:10.1149/1.2794283
- H. Habuka, T. Naito and N. Kawahara, “Molecular Interaction Radii and Rate Constants for Clarifying Organic Compound Physisorption on Silicon Surface,” Journal of the Electrochemical Society, Vol. 157, No. 11, 2010, pp. H1014-H1018. doi:10.1149/1.3489364
- H. Habuka, T. Naito and A. Sakurai, “Acetic Acid Addsorption to Water Layer on Silicon Surface,” Proceedings of the 6th International Symposium on Advanced Science and Technology of Silicon Materials, (JSPS Symposium), Kona, Hawaii, 19-23 November 2012, pp. 63-66.
- “Crystal and Frequency Control Glossary,” International Crystal Manufacturing. http://www.icmfg.com/glossary.html
- N. K. Kai, “Kagakubinran,” 4th Edition, Iwanami, Tokyo, 1993.
- J. B. Israelachvili, “Intermolecular and Surface Forces,” Academic Press, Amsterdam, 1992.
- P. Atkins and J. de Paula, “Physical Chemistry,” 9th Edition, Oxford University Press, Oxford, 2010.
NOTES
*Corresponding author.