Open Journal of Forestry
Vol.4 No.4(2014), Article
ID:48377,16
pages
DOI:10.4236/ojf.2014.44045
Assessment of Mangrove Covers Change and Biomass in Mida Creek, Kenya
Fikir Alemayehu1*, Onwonga Richard1, Kinyanjui Mwangi James2, Oliverv Wasonga1
1Department of Land resource Management and Agricultural Technology, College of Agriculture and Veterinary Science, University of Nairobi, Kenya
2Department of Resource Surveys and Remote Sensing, Nairobi, Kenya
Email: *fikiral2@gmail.com, Dr.onwonga@gmail.com, mwangikinyanjui@gmail.com, oliverwasonga@gmail.com
Copyright © 2014 by authors and Scientific Research Publishing Inc.
This work is licensed under the Creative Commons Attribution International License (CC BY).
http://creativecommons.org/licenses/by/4.0/
![]()
![]()

Received 12 May 2014; revised 13 June 2014; accepted 30 June 2014
ABSTRACT
This study uses old aerial photographs, current high resolution satellite images and ground truthing to analyze the patterns and dynamics of Mida Creek mangrove forest changes over 41 years from 1969-2010. A non-distractive method was used to collect data on 25 sample plots and 934 trees were measured to estimate the above ground biomass and carbon stock of the forest. General published allometric equations with variables of Diameter at Breast Height (DBH) and wood density (ρ) which were species specific were used to estimate above ground biomass. A decline in mangrove cover (16%) took place between 1969 and 1989 and between 1989 and 2010 an increment was observed in mangrove cover (1452.5 ha in 1989 to 1655.7 ha in 2010). Signs of degradation within the mangrove forest were observed in 2010 in which the degraded land covered 8.8 ha. The total above ground biomass and carbon estimated on the 25 plots was 296.14 ton∙ha−1 and 148.07 ton∙ha−1 respectively. Mida Creek mangrove forest is largely dominated by the presence of Rhizophora mucronata and Ceriop tagal and the regeneration of these two species is very high. If the present dominance of the two species continues it will affect the species composition of the current mangrove forest. This study recommends a better management plan for the mangrove forest through increasing involvement of the surrounding communities. Furthermore, there should be a way to control selective and illegal cutting of mangroves and promote other species of trees for domestic and commercial use to reduce the high dependency on the use of mangroves for construction purposes.
Keywords:Aerial Photographs, Satellite Images, Allometric Equations, Biomass Estimation, Carbon Stock, Mangrove, Mida Creek

1. Introduction
Mangroves are distinctive ecological units (FAO, 1994) and grow along coastlines in the inter-tidal zone between land and sea (Allsopp et al., 2009). Mangroves support coastal ecosystems by providing environmental services and critical ecological functions, affecting both inland and oceanic resources (Kauffman & Donato, 2012). Mangrove ecosystems exchange matter and energy with the adjacent marine and terrestrial ecosystems (Gang & Agatsiva, 1992). These forests are nutrient-rich environments which support a variety of food chains and function as nursery and feeding ground for fish and invertebrates (Hoorweg & Muthiga, 2009; Allsopp et al., 2009; Hinrichsen, 1990; Taylor et al., 2003). Mangroves play a protective role against detrimental climatic impacts (Leni et al., 2011). They also support numerous species and serve to protect coastlines from storms (Allsopp et al., 2009) by breaking the storm-waves and dampening the tidal currents, and the sediments they trap help to build the coastline against forces of erosion (UNEP, 1984). In addition to protecting the coastline from natural hazards, mangrove forests provide goods and services that are of economic, ecological and environmental value to man (Hoorweg & Muthiga, 2009). In many developing countries, the survival of coastal communities is largely dependent upon the sustainable harvest of seafood, and the cultivation of fish and crabs in mangroves (Hinrichsen, 1990). Several studies have shown that, despite the numerous uses of mangrove forests they have been overexploited and converted to other land use. For instance, State of the Coast Report Kenya the (NEMA, 2009) stated that, in Kenya, mangrove forest cover has been lost either due to conversion pressure, over-exploitation or pollution during the last twenty years.
Mida Creeks holds substantial mangrove stands (Tychsen, 2006) it is also an important sea bird haven. Traditionally, mangrove forests provide the coastal human population with a variety of goods and services on which the poorer strata of society depend strongly (Thampanya et al., 2006). However mangrove degradation at the Kenyan coast has occurred at an alarming rate as the result of growing subsistence needs (Hoorweg & Muthiga, 2009). This is observed along the Watamu-Mida creek area (Cohen et al., 2013; Weru et al., 2000; Gang & Agatsiva, 1992; Hirsch & Mauser, 1992).
In Mida Creek in particular, several agricultural land use practices in and around the creek influence the mangrove ecosystem along the coast (Gang & Agatsiva, 1992). Furthermore, the mangrove forests of Mida Creek are showing signs of over-exploitation and degradation because of logging, settlement and selective harvesting of large trees (Weru et al., 2000). Recent assessment of biomass estimation in Mida Creek by Cohen et al. (2013) confirms the level of forest degradation due to illegal and poorly managed logging activities.
Mangroves grow on muddy and anaerobic soils which suffer from tidal inundation; as a result they show a distinctive pattern of biomass allocation (Komiyama et al., 2005). A consistent assessment and research on biomass accumulation in mangroves is necessary in order to use the resources such as; yield of commercial products from forests, and for the development of silvicultural practices (Kairo et al., 2009). Estimation of biomass is significant in describing the status of mangroves, and as an essential component of carbon sequestration estimation (Kirui et al., 2006). Measurements of stem diameter and sometimes height are used to estimate tree biomass and carbon stock using allometric equations (Kauffman & Donato, 2012). Komiyama et al. (2005) defined allometry as a powerful tool for estimating tree weight from independent variables such as trunk diameter and height that are quantifiable in the field.
As it is stated by several authors (Cohen et al., 2013; Kuyah et al., 2012; Kairo, 2009; Komiyama et al., 2005; Chave et al., 2005), in order to use the mangrove forest sustainably and improve the management, it is important to estimate the amount of biomass accumulation. Kenya is mandated to develop a greenhouse gas inventory for the land based emissions for UNFCCC reporting. Since the mangrove forests are treated as a unique forest category, this study justifies the need to develop a historical dataset to show changes in biomass stocks. Therefore, this research focused on the estimation of total above ground biomass and carbon stock of Watamu-Mida Creek mangrove forest and quantifies the mangrove dynamics over the last 41 years (1969-2010).
2. Materials and Methods
2.1. Study Site
The study area is located in Watamu-Mida Creek, Kilifi County Kenya Figure 1. The Mida Creek mangrove area is estimated to cover 1657.8 ha (Cohen et al., 2013). According to a UNEP report (UNEP, 1998), the principal soil types in the area include coastal sands and grumosoils (brown clay soils). Soils of the mangroves swamps around Mida Creek are poorly drained, deep and excessively saline, loam to clay, and often with sulfidic material
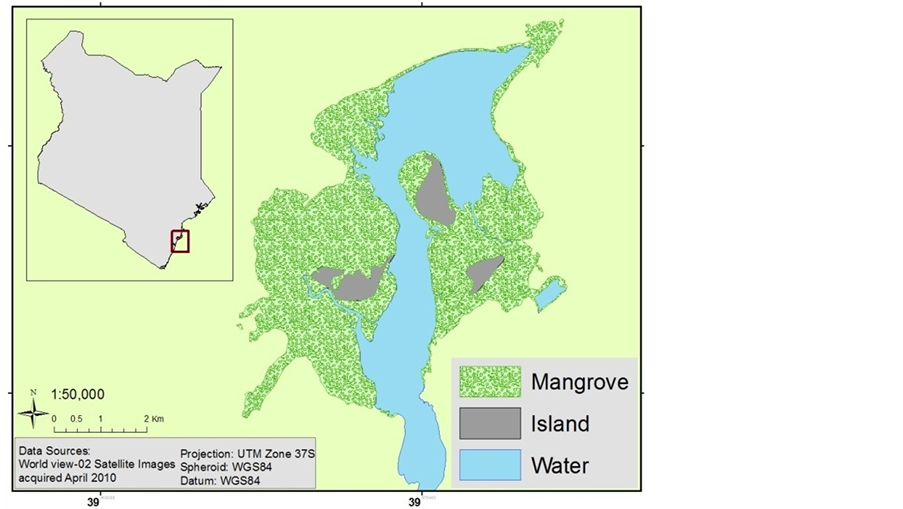
Figure 1. Location map of the study area.
Gang and Agatsiva (1992) stated the presence of seven mangrove species in Mida Creek. Another study by Kairo et al. (2002) in Mida creek confirmed the presence of seven mangrove species in which C. tagal, R. mucronata and A. marina are the dominant species. The main socioeconomic activities in Watamu/Mida creek area is tourism related, such as; curio vendors, beach traders, boat operators, sport fishing, snorkeling and diving and other water sports (NEMA, 2010). There are also some efforts by the community groups to use the Mida Creek mangrove areas as a source of income through promoting ecotourism activities. Currently there are two main ecotourism sites at Mida and Dabaso (boardwalks) which run through the mangrove forest and are managed by these community groups. The Mida Creek mangroves are not much affected by firewood extraction but are heavily exploited for building and fencing poles (Gang & Agatsiva, 1992). According to Dahdouh-Guebas et al. (2000), the most significant use of mangroves in Mida Creek is the use of poles for house construction.
2.2. Study Approach
2.2.1. Mangrove Cover Change Data Collection and Analysis
In order to estimate the mangrove cover over the last 41 years (1969-2013), an aerial photographic mosaic for 1969 and 1989, and a high resolution (0.5 m) Worldview satellite image for 2010 were used to digitize mangrove cover. The data were generated for the mangrove cover by on screen visual digitizing and interpretation using ArcGIS 9.3.1 and ERDAS Imagine 2014 version software. The aerial photographs have a scale of 1:60,000 and 1:50,000 for 1969 and 1989 respectively, as a result it was not sufficient to categorize mangrove at species level. Therefore, the classification of mangrove was undertaken based on two categories; open canopy, and closed canopy forest. The rest of the classification area was assigned as mud flats and the Mida creek water body. The preliminary classified maps were verified in the field (ground truthing) using a GPS.
2.2.2. Biomass Sampling
A non-destructive method of biomass estimation was done to record all the trees within a 10 m × 10 m quadrat sample. Using the quadrat, tree measurements for biomass data were taken from the two stratum of mangrove cover type: open canopy mangroves and closed canopy mangroves, both of which occur within the National Reserve. In each stratum, 25 sample plots were randomly distributed on 10 m × 10 m plots. In each plot tree Diameter at Breast Height (DBH) which is 1.3 m above the ground (where the highest prop-roots reach) was measured using a diameter tape. Tree height was measured using a Laser Ace for each mangrove tree to a minimum diameter of 7 cm. For saplings and seedlings qualitative methods were used to enumerate per species within 3 m × 3 m and 1 m × 1 m subplots at the center of the main plot for determination of species regeneration. The minimum distance between the plots was 50 m.
2.2.3. Allometric Equation
Published allometric equations developed for mangrove species by Komiyama et al. (2005) (Above Ground Biomass = 0.251*ρ*(D)2.46 were used. For the purposes of comparison Chave et al. (2005) (Above Ground Biomass = exp(−2.977 + ln(ρD2H) = 0.0509*ρD2H), Where ρ = wood density, D = Diameter at breast height (DBH), H = Height) and Kirui et al. (2006) (y = 0.8069DBH2.5154) were tried for biomass estimation. Values of biomass data were allocated to each mangrove species using the tree inventory data and each allometric equation. The equations have a coefficient of determination (R2) of 0.98 (Komiyama et al., 2005) and a standard error of 12.5% (Chave et al., 2005).
At local level in Kenya, the allometric equation published was the one developed by Kirui et al. (2006) applied only to R. mucronata which grows naturally. This is currently the only allometric equation developed for a mangrove species which grows in a natural environment in Kenya. An allometric equation developed for predicting the total above ground biomass at Gazi bay (which is some 100 Kms south of the study site) was y = 0.8069DBH2.5154 (r2 = 0.98, p < 0.05). This study uses the local equation for R. mucronata for the purpose of comparison with the general allometric equation developed by Chave et al. (2005) and Komiyama et al. (2005) to measure above ground biomass for R. mucronata. For data analysis and graphical presentations of the findings IBM SPSS version 19 were used.
The wood density for each species of mangrove was taken from Bosire et al. (2012) (Table 1) which has been developed for this region. The allometric relationships of the four dominant mangrove species (C. tagal, R. mucronatai B. gymnorrhiza, and A. marina) in Mida Creek were studied for the two variables of (DBH2H), and (ρ) (DBH). A number of different literature on the measurement of above ground biomass show the use of DBH2 H,DBH, wood density (ρ) or DBH alone (Chave et al., 2005; Komiyama et al., 2005; Leni, et al., 2011; Kirui et al., 2006). According to the study of common allometric equations by Komiyama et al. (2005) in order to attain a common allometric relationship, it is necessary to include wood density (ρ) with a given value for each specific species in the equation. For this study in order to avoid possible bias on the results of the estimation of biomass, trees with high DBH values from all species were eliminated. For Komiyama et al. (2005) general equation the maximum DBH limit was 49.0 cm.
To estimate the carbon stock of the mangrove, a conversion factor of biomass to C which is C = 0.55*biomass (total) as recommended by (FAO, 2004) was used. According to the FAO (2004) report on assessment of biomass and carbon stock in present land use, this coefficient is frequently used internationally.
3. Results
3.1. Descriptive Statistic
From the 25 sample plots a total of 934 trees were measured. In addition several saplings and seedlings of mangrove species were recorded. Based on the data gathered on the sample plots, the mangroves forest composed of

Table 1 . Specific wood density of major mangrove species in West Indian Ocean.
Note: Source: Bosire et al. (2012).
five main mangrove tree species namely C. tagal, R. mucronata, B. gymnorrhiza, A. marina, and X. granatum. Quantitative measurements were not carried out on regeneration, neverthelessh, an observation and count in the field showed the dominance of C. tagal and R. mucronata seedlings and saplings actively growing.
The relative dominance of C. tagal and R. mucronata was 69.3% and 22.8% respectively (Figure 2). Relative dominance by basal showed that A. marina, B. gymnorrhiza, and R. mucronata have the highest DBH with the maximum DBH of 148 (cm). Whereas B. gymnorrhiza had the tallest tree among the sample mangrove trees with the mean height of 16.6 (m) and there were 41 trees with DBH > 40 cm.
3.2. Biomass and Carbon Estimation
From the four species of mangroves trees, C. tagal had the highest biomass and carbon stock as it is the dominant species by basal and relative abundance in all the sampling plots (Table 2). The results of the biomass depicted that the equation by Chave et al. (2005) gave lower above ground weights compared with Komiyama et al. (2005). The result of above ground biomass for R. mucronata using the allometric equation developed by Kirui et al. (2006) also shows a higher result compare with the two common equations (Table 2).
Please refer to discussion section below for explanation on these differences.
3.3. Mangroves Cover Change over the 41 Years Period
The mangrove cover was found to have declined by (16%) in the last 41 years when comparing the 1969 cover with 1989. However the most recent cover record (2010) showed an increment of 165.5 ha when compared with the 1989 cover. Hence the highest cover loss was observed between 1969 and 1989, which was −337.8 ha (Table 3).
The above ground biomass estimated for each year was based on the total area of mangrove cover (obtained from aerial photographs and satellite image analysis) multiplied by the total biomass estimate for 2013. This
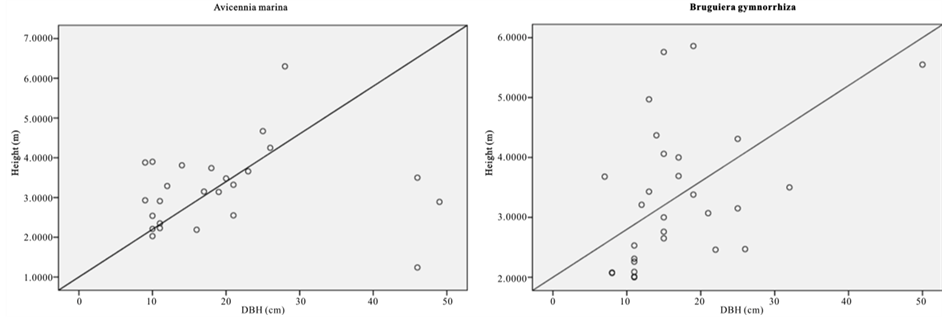
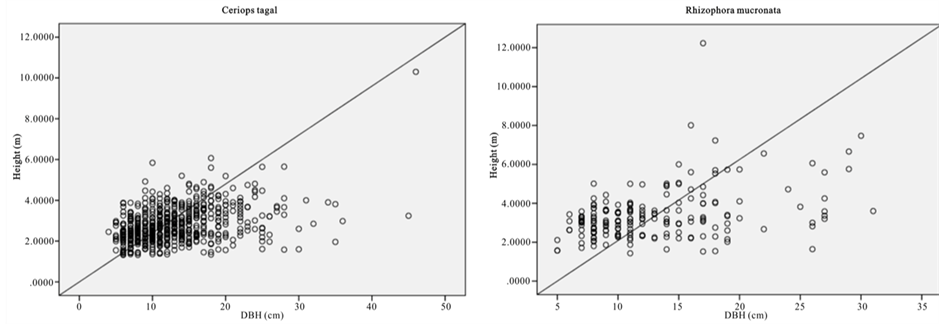
Figure 2. Scatter graph showing height versus DBH.
Table 2. Above ground biomass and carbon storage per species in mida creek mangrove.
Please refer to discussion section below for explanation on these differences.
Table 3. Mangroves cover change over the years.
gave the following above ground biomass results; 613661.3 ton (1969), 502964.2 ton (1989) and 551975.3 ton (2010) (Figure 3). The change in the biomass between 1969 and 1989 was 110697.1 ton while the change in biomass between 1969 and 2010 was 61,686 ton.
4. Discussion
This research tested if there would be a change in this mangrove forest over the last 41 years. It also focused on the estimation of total above ground biomass and carbon stock of Watamu-Mida creek mangroves in order to see if the change in mangrove cover affected the biomass and carbon stock.
4.1. Mangrove Cover Change Trends
In 1969 Mida Creek mangrove forest covered 2072.2 ha (Table 3, Figure 4). This cover declined by 16% during the 20 years period of 1969-1989. The decline in the mangrove forest cover could be due to expansion of the settlement around the mangrove forest which increased the use of mangrove poles as a source of building materials. The mangrove forest in Mida Creek is surrounded by 11 villages. Abuodha and Kairo (2001) indicated a high dependence on mangroves by coastal populations. The land use activities in and around the Creek have also influenced the mangrove forest (Gang & Agatsiva, 1992). A study by Kairo et al. (2002) showed the contribution of the anthropogenic influence for the decline in mangrove forest for the last three decades in Mida Creek. Another possible reason for the decline of the mangroves could be the export of building poles and charcoal produced from mangroves in the past. During data collection household questionnaires were conducted in the Mida Creek area (Oct-Nov, 2013) for another study to identify the historical land use change in the area. During this survey many respondents mentioned about mangrove harvesting for export in the past by those who had licenses to harvest mangroves mainly for building materials. This was confirmed by Dahdouh et al. (2000) study which showed that the decline in the mangroves of Kenya were mainly due to mangrove harvest for export to Middle East countries. According to a study by Hirsch and Mauser (1992), in the period of 1966-1970 an amount of 45,677 scores (1score = 20 poles) of mangroves were exported from Kenya to the Middle East. According to a report by Ravilious and Green (2003), mangrove forest has declined to the point that export-quality poles are no longer found in many coastal areas of Kenya.
The decline in cover loss reduced in the period of 1989-2010 could be partly as the result of a ban on the export of mangroves in 1982 (Hirsch & Mauser, 1992). According to a study by Kirui et al. (2013), in the period between 2000 and 2010 mangroves along Kenyan coastal areas observed the lowest rate of loss due again to a
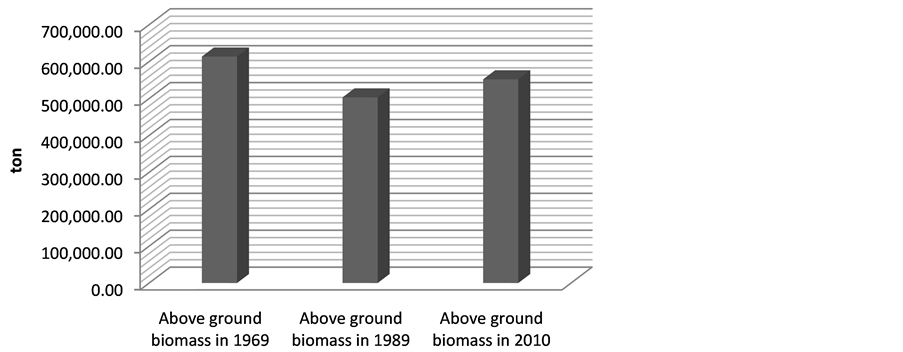
Figure 3. Estimated above ground biomass from 1969-2010.
presidential ban on the harvesting of mangroves for the domestic market. In the present study the result of 2010 mangrove cover has improved compared with the 1989 however another cover type appeared which showed the level of degradation in the mangrove forest (Figure 5). Kairo et al. (2002) study confirmed the high magnitude of human disturbance of the mangrove forest at Mida Creek. Dahdouh et al. (2000) stated the primary reason for observed change in the forest was due to decline in overall number of trees. The other possible pressure for mangrove forest in Mida Creek could be the growing number of hotels, cottages and private holiday houses. This has been observed on the field that some new residential private houses are in close proximity to the mangroves forest, some cleared the forest to get a better view of the sea. In 1992 there were 7 big Hotels in Watamu Mida Creek area (Hirsch & Mauser, 1992). Currently there are 23 hotels and over 18 different lodges and guest houses and several private residence or holiday houses (COAST Project, 2013). The image of 2010 reveled a complete clearance of some areas within the forest which later on confirmed during the (Oct-Nov, 2013) field work. This new degraded area covered 8.8 ha of land.
This study found out the overall trends of the mangrove cover for the last 41 years, and in general the current mangrove cover has improved since 1989 as compared with 2010 (1452.5 ha to 1655.7 ha). On the other hand, it was observed that there is selective cutting of mangrove poles mainly; C. tagal, B. gymnorrhiza and R. mucronata. These species are targeted mainly for house construction as the poles are long and straight (Dahdouh et al., 2000). Gang and Agatsiva (1992) also observed the high intensity of cutting of C. tagal and X. granatum for poles (Figure 6).
4.2. Biomass Estimation
Current study also tried to estimate the biomass of the mangrove forest in Mida Creek using general allometry equations. The result found out that the above ground biomass estimated using the equation developed by Chave et al. (2005) which includes three variables with the parameter of diameter (DBH), wood density (ρ) and height (H) was less (R2 value for all four species compared with the result with Komiyama (2005) and Kirui et al. (2006) (Figures 7-10).Significant correlation was observed using the general equation by Komiyama et al. (2005) DBH and (ρ) as explanatory variables where used (correlation is significant at 0.01 level) (R2 = 0.96, R2 = 0.93, R2 = 0.99 and R2 = 0.95)was observed for A. marina, B. gymnorrhiza, C. tagaland, R. mucronata respectively. For this study the local equation developed for R. mucranata by Kirui et al. (2006) using DBH estimated the highest above ground biomass (135 t/ha ). For this study the result showed that above ground biomass was best estimated using (DBH) as a parameter.
In a similar biomass estimation study in Kenya, Kirui et al. (2006), found out that the use of diameter as the independent variable can best estimate the biomass of R. mucronata. The above ground biomass estimated by Kirui et al. (2006) for R. mucronata at Gazi Bay was 452.02 t/ha which was much higher than in the present study for the same species (135 t/ha) using the same equation. Both Komiyama et al. (2005) and Chave et al. (2005) general equation obtained lower above ground estimation of R. mucronata (i.e. 39.5 and 8.3 t/ha) respectively.
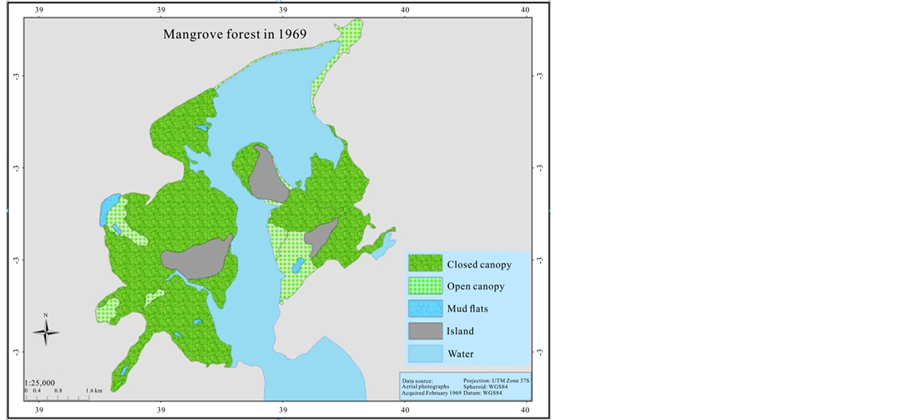
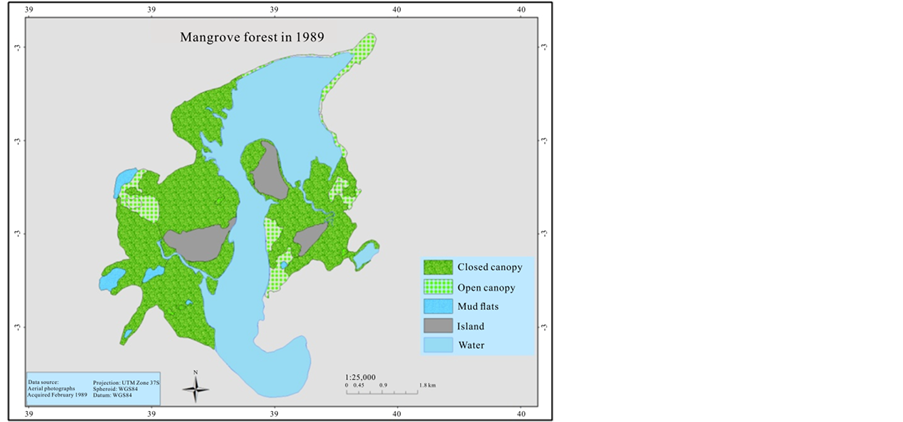
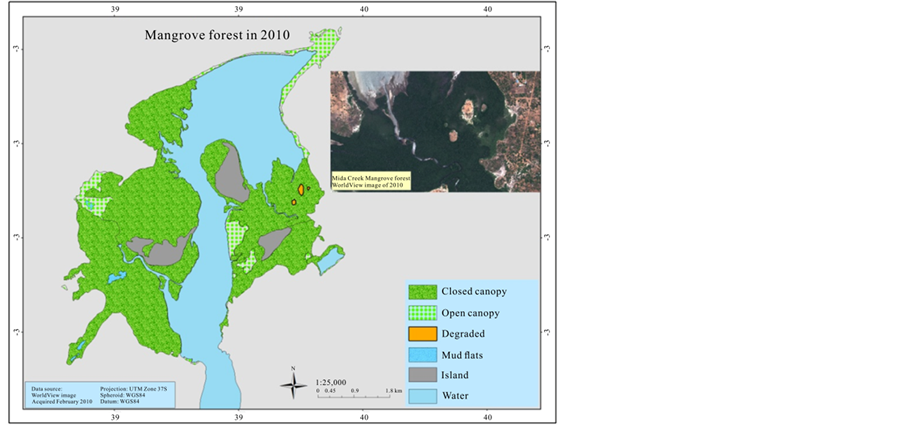
Figure 4. Mangrove cover map of 1969, 1989, and 2010.
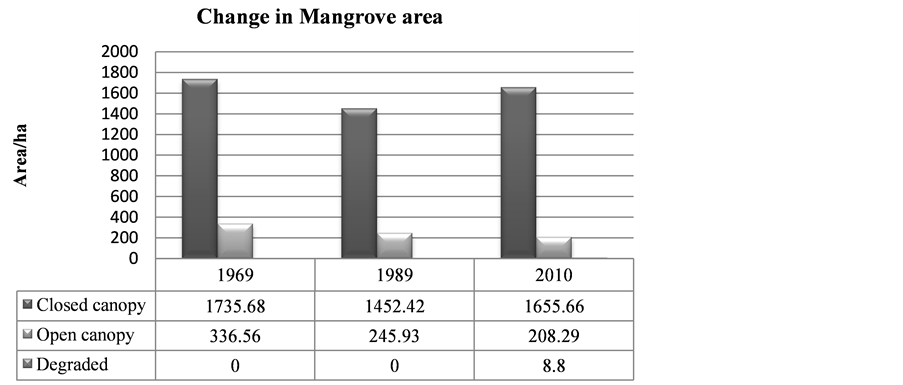
Figure 5. Change in mangrove area between 1969, 1989 and 2010.
 (a)
(a)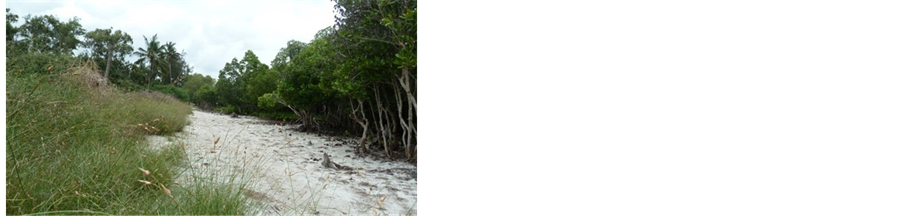 (b)
(b)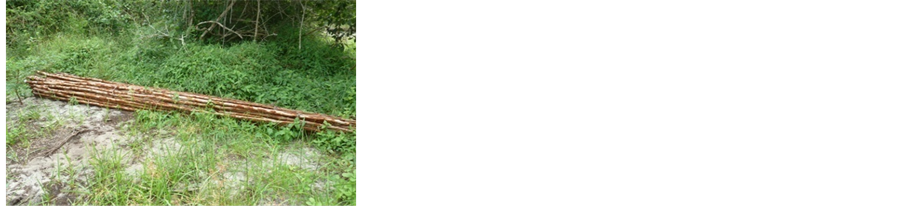 (c)
(c)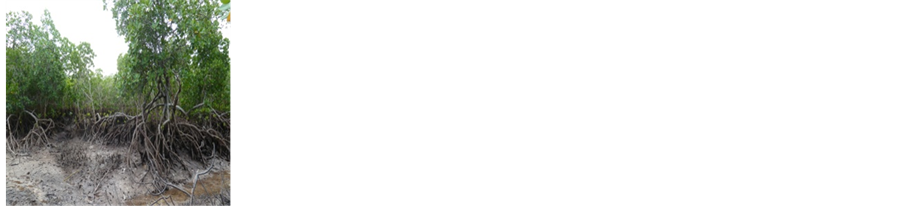 (d)
(d)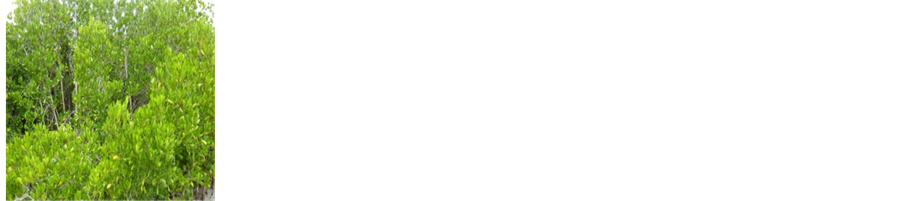 (e)
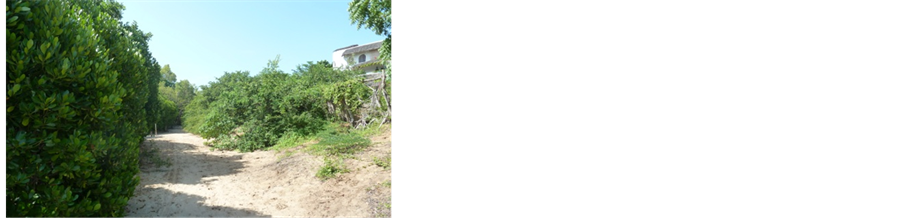
(e)
Figure 6. Mangroves under pressure: (a) Residential settlements are occurring nearer to the mangrove forest over time; (b) Local settlement areas are often directly adjacent to the mangrove forest; (c) Mangrove poles ready for collection and transport to market; (d) An example of a degraded mangrove area and, (e) Relatively undisturbed mangrove stand.
Very few studies are available on the estimation for above ground biomass in a natural mangrove forest in Kenya. Hence, it was not easy to compare findings of the present study above ground biomass for C. tagal, A. marina, and B. gymnorrhiza species with other studies at local level. Many of previous studies in Kenya have focused on replanted mangrove forests (e.g. Langat (2006), plantation of B. gymnorrhiza, Kairo et al. (2008) plantation of R. mucronata, Tamooh et al. (2009) plantation of R. mucronata, Kairo et al. (2009) plantation of R. mucronata, A. marina, C. tagal, S. alba). However, the use of different equations can also yield variation in biomass estimation (Kauffman & Donato, 2012). For instance, two above ground biomass estimation studies for R. mucronata species at Gazi Bay, Kenya, in a primary forest came out with a different result 515 t/ha (Slim et al., 1996) and 452.02 t/ha (Kirui et al., 2009). The differences in these results could be because of; varying sample size, variation in wood density, ecology, plant age, and the type of forest i.e. primary or planted (Cohen et al., 2013; Kairo et al., 2009; Kirui et al., 2006; Tamooh et al., 2009; Komiyama et al., 2008). Comparison
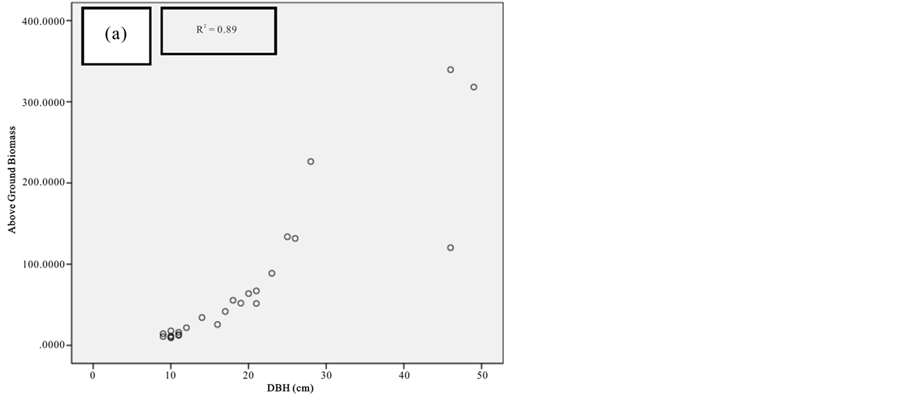
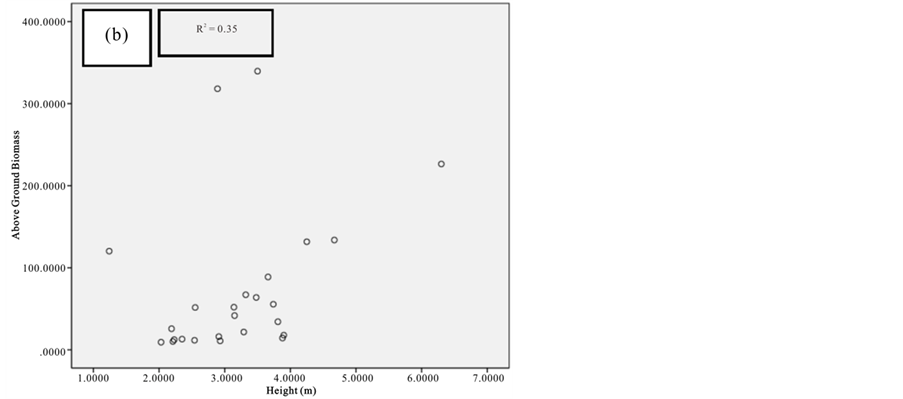
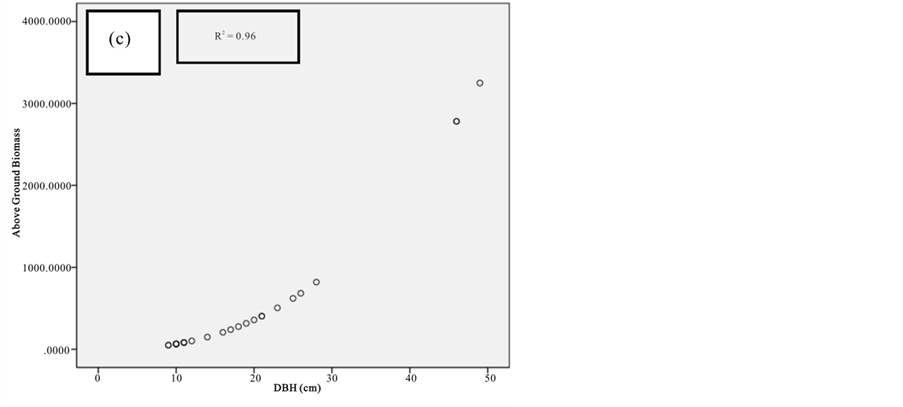
Figure 7. Scatter plots for A. marina showing: (a) The relationship between DBH and above ground biomass estimated using Chave et al., 2005; (b) The relationship between H and above ground biomass estimated using Chave et al., 2005; (c) The relationship between DBH and above ground biomass estimated using Komiyama et al., 2005.
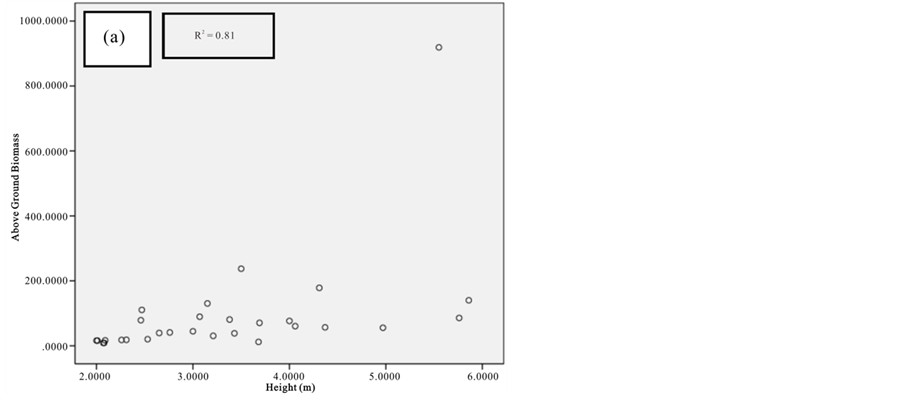
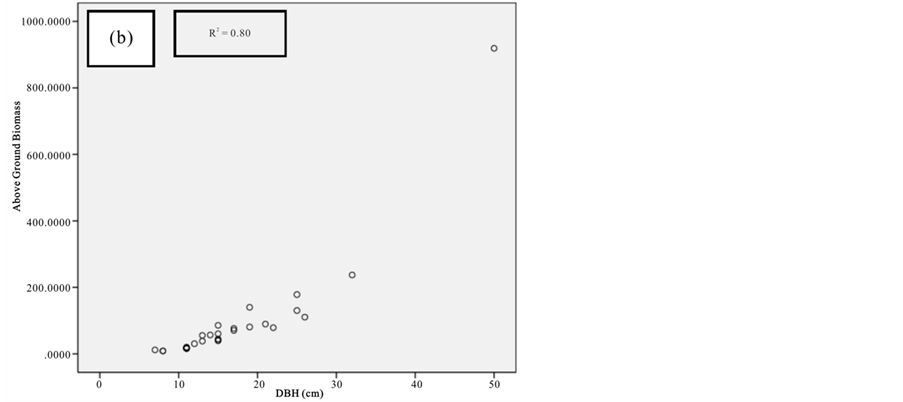
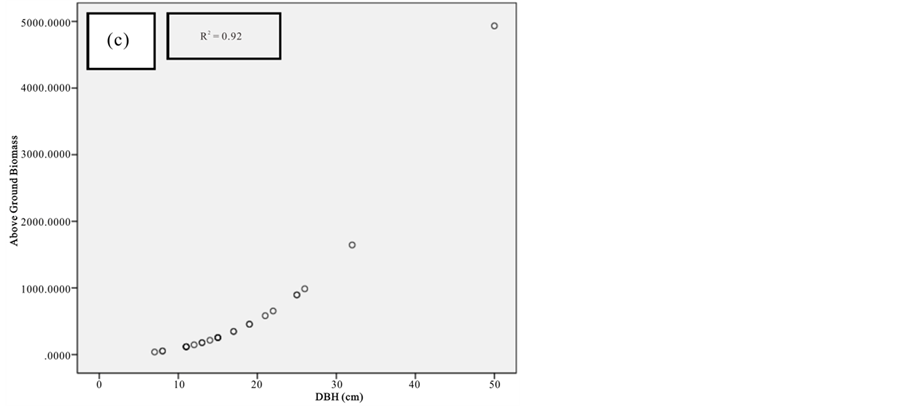
Figure 8. Scatter plots for B. gymnorrhiza showing: (a) The relationship between DBH and above ground biomass estimated using Chave et al., 2005; (b) The relationship between H and above ground biomass estimated using Chave et al., 2005; (c) The relationship between DBH and above ground biomass estimated using Komiyama et al., 2005.
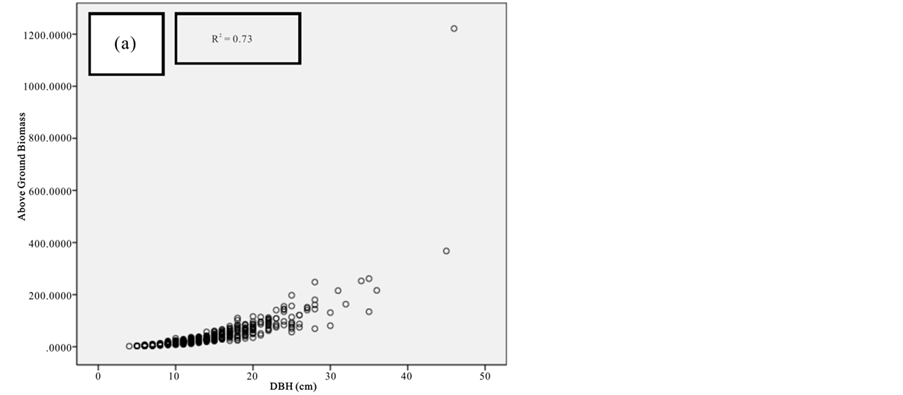
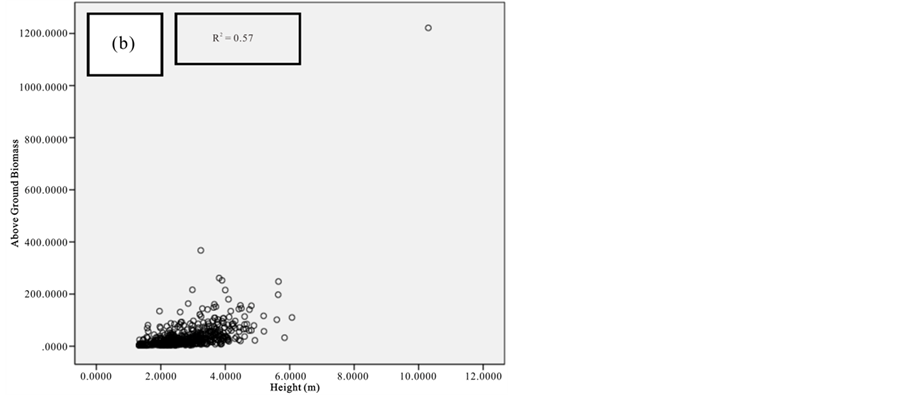
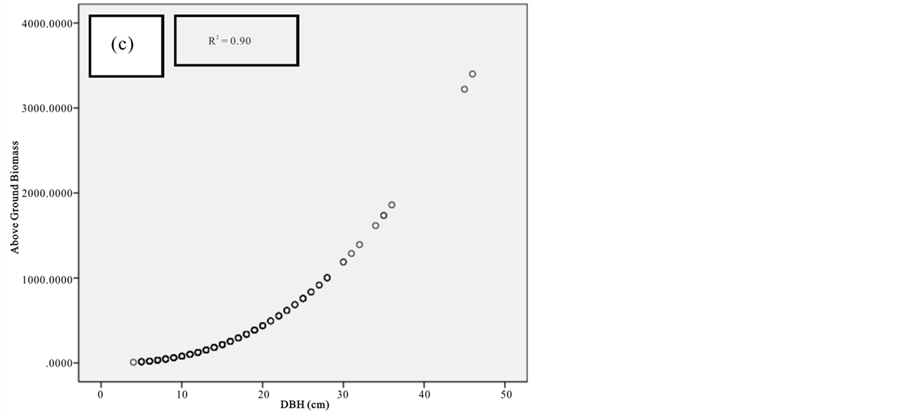
Figure 9. Scatter plots for C. tagal showing: (a) The relationship between DBH and above ground biomass estimated using Chave et al., 2005; (b) The relationship between H and above ground biomass estimated using Chave et al., 2005; (c) The relationship between DBH and above ground biomass estimated using Komiyama et al., 2005.
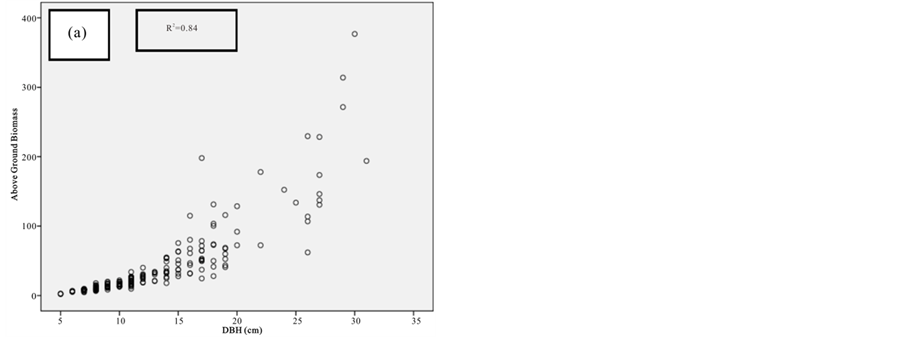
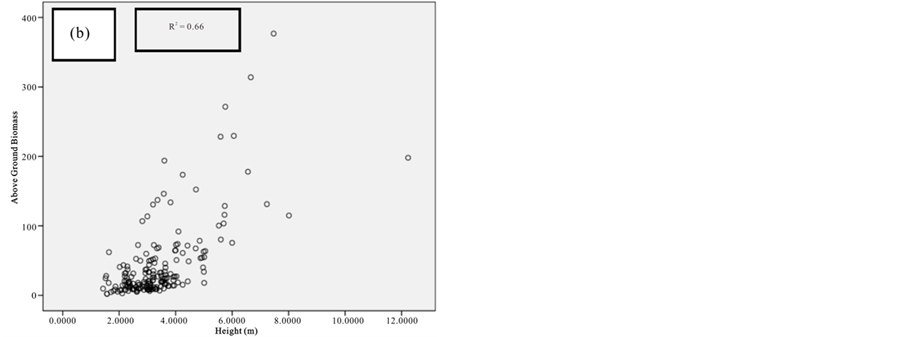
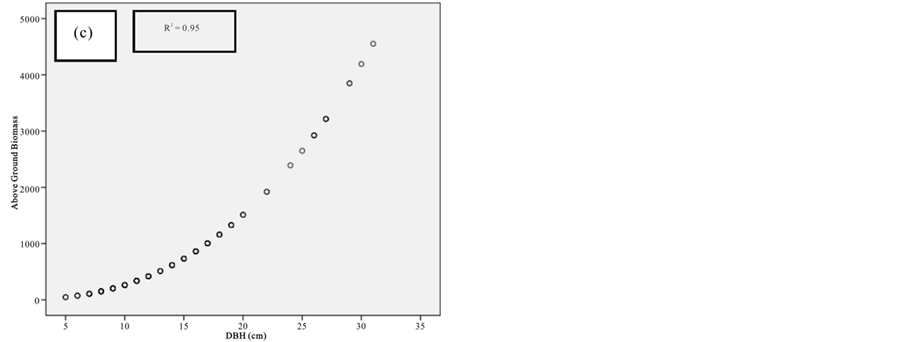
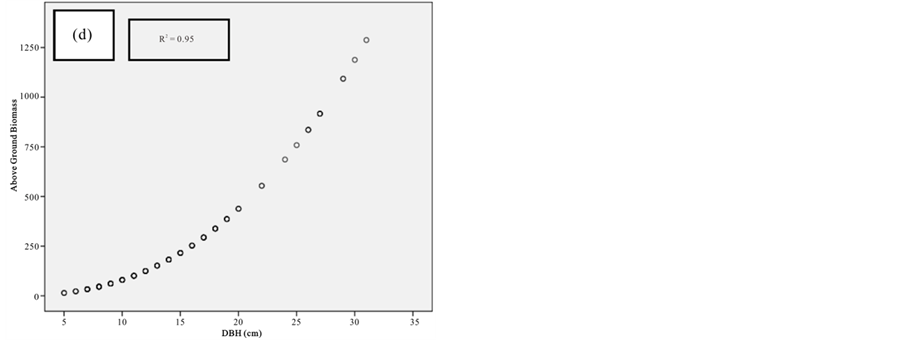
Figure 10. Scatter plots for R. mucronata showing: (a) The relationship between DBH and above ground biomass estimated using Chave et al., 2005; (b) The relationship between H and above ground biomass estimated using Chave et al., 2005; (C) The relationship between DBH and above ground biomass estimated using Komiyama et al., 2005; (d) The relationship between DBH and above ground biomass estimated using Kirui et al, 2006.
of above ground biomass estimation from Kenya and South East Asia with the current study presented on Table4
Most studies have only had small sample sizes compared with the current study Table4 This could explain the variation in results in addition to other factors which have been mentioned above. There was a limitation in finding the appropriate equation for this study as there is no local allometric equation developed using evidence at local level. In most biomass estimation studies, researchers develop an equation using destructive methods and compare the result with existing general equations. In the current study the main objective was to estimate the mangrove cover change for the last four decades and biomass estimation was based on a non-destructive method.
In regard to species domination, the results in this study agreed with a previous study by Gang and Agatsiva (1992). In their study of the status of mangroves in Mida Creek, they found high dominance of C. tagal and R. mucronata and higher seedling growth in these two species. The present study also found the same dominance of these two species both at seedling and sapling stages. Another study in Mida Creek by Kairo et al. (2002) also confirmed the dominance of R. mucronata and C. tagal, and a high tendency towards the dominance of C. tagal. According to a study by Kairo et al. (2002), the reason for the dominance of these two species and the high number of seedlings and saplings in the Mida Creek mangroves was as the result of a stronger anthropogenic pressure which may resulting in C. tagal becoming more dominant. In addition, other studies revealed that the composition of the regenerated species depends on the species mix of the neighboring population (Kairo et al., 2001), the stability of the soil to hold the seeds and young trees, and the germination percentage of seeds and propagules (Hirsch & Mauser, 1992).
Table 4. Comparison of different above ground biomass for the four mangrove species in this study with other studies.
Note: Kg DW = above ground biomass is given in Kg dry weight. The above ground biomass comparison results for Kirui (2006), was taken from Cohen et al. (2013).
5. Conclusion
This study compared a number of general equations to derive biomass and carbon values for the Mida creek mangrove forest. While there remain technical questions about the value of each equation, it is clear that the study has highlighted a number of specific lines of enquiry for further study. These lines of enquiry will need to be thoroughly investigated if this important site is to be maintained to both maximize future use by local communities, as well as sustain the biodiversity and tourism values for future generations.
This study found out important areas for further studies. There is a need for biodiversity value versus economic value additional study as the outcome of this would have direct implications for an improved management plan for the area. Further study can also be undertaken on each specific species to understand why there appears to be a changing ecology within this mangrove forest with the predominance of C. Tagal and R. macronata. There is also a need to be much fuller discussion with the surrounding eleven local communities to decide what future management is best placed for the biodiversity conservation, tourism potential and community interest/needs in the area. Furthermore there is a need to consider alternative land uses (e.g. planting of Cassurina sp.) in order to meet the increasing demands for building poles and timber, both within local village communities as well as in the expanding hotel and private residence markets. Institutional mandates between Kenya Forest Service and Kenya Wildlife Service need to be fully clarified in order for the above management plans for the area to be both approved and supported by these government agencies.
Acknowledgements
This research is fully supported by Regional Universities Forum for Capacity Building in Agriculture (RUFORUM) and the author is thankful for the support given to conduct the field work. The author would like to thank UNIDO COAST Project for the use of the 2010 Worldview satellite image. The author also wishes to thank Mr. Chemuku Wekesa from Kenya Forestry Research Institute for assisting in organizing the field work in the study area. The constructive comments and support from Dr. Ermiyas Ayenekulu was gratefully appreciated.
References
- Abuodha, P. A. W., & Kairo, J. G. (2001). Human-Induced Stresses on Mangrove Swamps along the Kenyan Coast. Hydrobiologia, 458, 255-265. http://dx.doi.org/10.1023/A:1013130916811
- Allsopp, M., Page, R., Johnston, P., & Santillo, D. (2009). State of the World’s Oceans. Dordrecht: Springer Science and Business Media B.V.
- Bosire, J. O., Bandeira, S., & Rafael, J. (2013). Coastal Climate Change Mitigation and Adaptation through REDD+ Carbon Programs in Mangroves in Mozambique: Pilot in the Zambezi Delta. Determination of Carbon Stocks through Localized Allometric Equations Component (27 p). WWF.
- Camacho, L. D., Gevana, D. T., Carandang, A. P., Camacho, S. C., Combalicer, E. A., Rebugio, L. L., & Youn, Y. C. (2011). Tree Biomass and Carbon Stock of a Community-Managed Mangrove Forest in Bohol, Philippines. Forest Science and Technology, 7, 161-167. http://dx.doi.org/10.1080/21580103.2011.621377
- Chave, J., Andalo, C., Brown, S., Cairns, M. A., Chambers, J. Q., Eamus, D. et al. (2005). Tree Allometry and Improved Estimation of Carbon Stocks and Balance in Tropical Forests. Ecosystem Ecology. Oecologia, 145, 87-99.http://dx.doi.org/10.1007/s00442-005-0100-x
- COAST Project (2013). Baseline Report for the Reef and Marine Recreation Management Thematic Area of the Watamu, Kenya. Eco Africa: UNIDO.
- Cohen, R., Kaion, J., Okello, J. A., Bosire, J. O., Kairo, J. G., Huxham, M., & Mencuccini, M. (2013). Propagating Uncertainty to Estimates of Above-Ground Biomass for Kenyan Mangroves: A Scaling Procedure from Tree to Landscape Level. Forest Ecology and Management, 310, 968-982. http://dx.doi.org/10.1016/j.foreco.2013.09.047
- Dahdouh-Guebas, F., Kairo, J. G., Jayatissa, L. P., Cannicci, S., & Koedam, N. (2002). An Ordination Study to View Vegetation Structure Dynamics in Disturbed and Undisturbed Mangrove Forests in Kenya and Sri Lanka. Plant Ecology, 161, 123-135.
- Dahdouh-Guebas, F., Mathenge, C., Kairo, J. G., & Koedam, N. (2000). Utilization of Mangrove Wood Products around Mida Creek (Kenya) amongst Subsistence and Commercial Users. Economic Botany, 54, 513-527. http://dx.doi.org/10.1007/BF02866549
- FAO (1994). Mangrove Forest Management Guidelines. Rome: Forest Resources Development Branch, Forest Resources Division FAO Forestry Department M-36. Publications Division, Food and Agriculture Organization of the United Nations.
- FAO (2004). Assessing Carbon Stocks and Modelling Win-Win Scenarios of Carbon Sequestration through Land-Use Changes. Rome: Natural Resource Management and Environmental Department.
- Gang, P. O., & Agatsiva, J. L. (1992). The Current Status of Mangroves along the Kenyan Coast: A Case Study of Mida Creek Mangroves Based on Remote Sensing. The Ecology of Mangrove and Related Ecosystems. Hydrobiologia, 247, 29-36. http://dx.doi.org/10.1007/978-94-017-3288-8_4
- Government of Kenya (2009). State of the Coast Report: Towards Integrated Management of Coastal and Marine Resources in Kenya (88 p). Nairobi: National Environment Management Authority (NEMA).
- Hinrichsen, D. (1990). Our Common Seas: Coasts in Crisis. London: Earthscan Publication Ltd. (in association with Nairobi: UNEP).
- Hirsch, D., & Mauser, A. (1992). The Economic Values of Mangroves Two Case Studies: Mida Creek and Funzi Bay (Unpublished). Amsterdam: University of Amsterdam.
- Hoorweg, J., & Muthiga, N. A. (2009). Advances in Coastal Ecology People, processes and Ecosystems in Kenya. In African Studies Collection (vol. 20). Leiden: African Studies Centre.
- Kairo, J. G., Bosire, J., Langat, J., Kirui, B., & Koedam, N. (2009). Allometry and Biomass Distribution in Replanted Mangrove Plantations at Gazi Bay, Kenya. Aquatic Conservation: Marine and Freshwater Ecosystems, 19, 63-69.
- Kairo, J. G., Dahdouh-Guebas, F., Gwada, P. O., Ochieng, C., & Koedam, N. (2002). Regeneration Status of Mangrove Forests in Mida Creek, Kenya: A Compromised or Secured Future? Ambio, 31, 562-568.
- Kairo, J. G., Langat, J., Dahdouh-Guebas, F., Bosire, J., & Karachi, M. (2008). Structural Development and Productivity of Replanted Mangrove Plantations in Kenya. Forest Ecology and Management, 255, 2670-2677. http://dx.doi.org/10.1016/j.foreco.2008.01.031
- Kauffman, J. B., & Donato, D. C. (2012). Protocols for the Measurement, Monitoring and Reporting of Structure, Biomass and Carbon Stocks in Mangrove Forests. Working Paper 86. Bogor: CIFOR.
- Kirui, K. B., Kairo, J. G., & Karachi, M. (2006). Allometric Equations for Estimating above Ground Biomass of Rhizophora Mucronata Lamk. (Rhizophoraceae) Mangroves at Gaxi Bay, Kenya. West Indian Ocean Journal of Marine Science, 5, 27-34.
- Kirui, K. B., Kairoa, J. G., Bosirea, J., Viergever, K. M., Rudra, S., Huxhamb, M., & Briers, R. A. (2013). Mapping of Mangrove Forest Land Cover Change along the Kenya Coastline Using Landsat imagery. Ocean & Coastal Management, 83, 19-24. http://dx.doi.org/10.1016/j.ocecoaman.2011.12.004
- Komiyama, A., Ong, J. E., & Poungparn, S. (2008). Allometry, Biomass, and Productivity of Mangrove Forests: A Review. Aquatic Botany, 89, 128-137. http://dx.doi.org/10.1016/j.aquabot.2007.12.006
- Komiyama, A., Poungparn, S., & Kato, S. (2005). Common Allometric Equations for Estimating the Tree Weight of Mangroves. Journal of Tropical Ecology, 21, 471-477. http://dx.doi.org/10.1017/S0266467405002476
- Kuyah, S., Dietz, J., Muthuri, C., Jamnadass, R., Mwangi, P., Coe, R., & Neufeldt, H. (2012). Allometric Equations for Estimating Biomass in Agricultural Landscapes: I. Above Ground Biomass. AGEE-4172 ELSEVIER, Agriculture, Ecosystems and Environment, 158, 216-224.
- Tamooh, F., Kairo, J. G., Huxham, M., Kirui, B., Mencuccini, M., & Karachi, M. (2009). Biomass Accumulation in a Rehabilitated Mangrove forest at Gazi Bay. In African Studies Collection (vol. 20). Leiden: African Studies Centre.
- Taylor, M., Ravilious, C., & Green, E. P. (2003). Mangroves of East Africa. Nairobi: UNEP-WCMC.
- Thampanya, U., Vermaat, J. E., Sinsakul, S., & Panapitukkul, N. (2006). Coastal Erosion and Mangrove Progradation of Southern Thailand. Hat Yai: Coastal Resources Institute, Prince of Songkla University.
- Tychsen, J. (2006). KenSea. Environmental Sensitivity Atlas for Coastal Area of Kenya. Copenhagen: Geological Survey of Denmark and Greenland (GEUS), 76 p.
- UNEP/ECLAC (1984). The State of Marine Pollution in the Wider Caribbean Region. In Regional Seas Reports and Studies (No. 36). Nairobi: UNEP.
- Weru, S. M., Wakaba, G. M., Macharia, D., Mwakau, B. K., Njue, R. M., Verheij Koyo, A.O. Muthiga, N., Kavu, B. K., Kareko, J. K., & Litoro, M. (2000). Managment Plan: Malindi Watamu Marine Parks and Reserves. Mombasa: Kenya Wildlife Services.
NOTES

*Corresponding author.