Theoretical Economics Letters
Vol. 2 No. 1 (2012) , Article ID: 17361 , 5 pages DOI:10.4236/tel.2012.21011
Corruption, Growth, and Taxation*
Department of Economics, University of Ottawa, Ottawa, Canada
Email: {#ydissou, tyaka023}@uottawa.ca
Received December 21, 2011; revised January 13, 2012; accepted January 20, 2012
Keywords: Corruption; Economic growth; Government; Taxes
ABSTRACT
Several empirical papers have shown that corruption is an impediment to growth, as it mainly constitutes hindrance to investment. While there are few theoretical studies linking corruption and growth, none of the existing papers can explain the fall in the growth-maximizing tax rate of the economy following reduction in corruption. We present an endogenous growth model where corruption hinders investment and decreases the growth-maximizing tax rate of the economy. Incentives to invest in private capital fall as the corrupt government diverts some portion of the tax revenue away from investment in public capital that has an impact on the return of private inputs. We show, using a nonlinear (concave) relationship between the intensity of corruption and the amount of wasted resources that reducing corruption can be beneficial not only to growth, but to the average taxpayer in the economy as the tax rate would fall.
1. Introduction
Corruption remains one of the major obstacles to economic prosperity in many countries. It is known to distort incentives, impede investment and divert the allocation of productive resources to rent-seeking activities (Murphy, Shleifer & Vishny [1]). These detrimental effects are likely to slow growth. While there are a limited number of studies that explicitly link corruption and growth, no study has analytically illustrated how a reduction in corruption can at the same time boost growth and reduce the optimal tax rate. The model presented in this paper addresses this gap in order to explain successful anti-corruption policies and its subsequent economic recovery accompanied by lower tax rates in some countries.
Referring to Mo [2], corruption leads to lower growth through three different types of transmission mechanisms: the human capital channel, the institutions channel and the investment channel. The latter is the channel of interest in this paper. Unlike already established producers, new investors are often in need of licenses, registrations, permits and, therefore, are more likely to fall victims of corrupt public officials (Murphy, Shleifer & Vishny [3]). This observation has been substantively supported by empirical evidence (Aseidu and Freeman [4]; Mauro [5]). It is often suggested in passing that corruption acts as an arbitrary tax on investment, lowering the marginal product of capital and thereby slowing growth.
This paper proposes a theoretical model to solve the puzzle. In our model, corruption acts as a hindrance to capital accumulation by lowering the private marginal product of capital. The simple model considers two cases in which corruption operates: a linear and a non-linear relationship between corruption intensity and tax revenue. In the first case, an increase in corruption shifts down the single-peaked growth function. Alternatively, a reduction in corruption stretches the “growth-possibility frontier” upward leaving the level of the growth-maximizing tax unaltered. In the second case, corruption operates nonlinearly. We show that curbing corruption not only raises the maximum possible growth rate, but it also lowers the growth-maximizing tax rate by stretching the “growthpossibility frontier” upward and to the left. To our knowledge, this theoretical illustration is novel and has not been presented in endogenous growth literature or in the literature on corruption.
2. The Model
2.1. Overview
The baseline specification of this model builds upon the seminal contribution of Barro [6] to the literature on endogenous growth. The model comprises three actors: representative consumer, representative firm and the government. The consumer maximizes its intertemporal utility subject to the budget constraint. The consumer is the owner of the representative firm. The firm’s production technology relies on private capital and public capital to produce output. The representative consumer spends its after-tax income on consumption and investment in future private capital. The government collects flat-rate income taxes and seeks to run a balanced budget. If the government is honest, all collected taxes are invested in the private productive process in the form of public capital, which, in turn, is used as a productive input. If the government is corrupt, only a fraction of tax revenues is passed on to the private productive process in the form of public capital, while bribe becomes an implicit consumption, which the representative consumer takes as given. The model presents two cases featuring two functional specifications of corruption intensity, linear and non-linear, resulting in two distinct modifications of the “growthpossibility frontier”.
2.2. Consumer
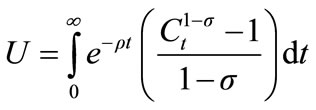
The economy is populated by an infinitely-lived representative consumer who derives utility from consumption. The size of the population is normalized to one and, therefore, the subsequent analysis can be viewed in percapita terms. In addition, for simplicity, the model abstracts from labour supply. Consumer’s intertemporal utility function is as follows:
 (1)
(1)
where ρ is the rate of time preference, σ is the inverse of the intertemporal elasticity of substitution and  is consumption at time t.
2.3. Firm
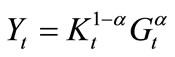
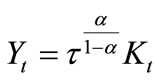
The consumer owns a representative firm, which has access to Cobb-Douglas production technology. The firm’s production function is:
 (2)
(2)
The two inputs,  and
and , represent private capital and public capital, respectively1. The production function exhibits constant marginal returns and has diminishing marginal returns to each input taken separately. Public capital is funded with tax revenues derived from a proportional tax levied on output. Government spending on public capital is considered a productive and an essential input for firm production.
2.4. The Government
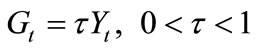
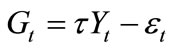
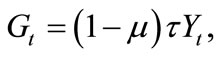
The government levies a proportional tax on output with the requirement of running a balanced budget:
 (3)
(3)
The expression in (3) simply states that government spending on public capital equals the amount collected from taxation. If the government is honest, no tax revenue is pocketed by corrupt bureaucrats; rather all tax revenue is spent on public capital.
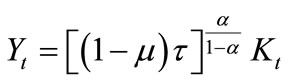
Assume that the representative firm cannot influence the government’s decision and takes the levied tax as given. Therefore, the production function can be rewritten using (3) as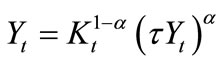 . Isolating
 , the production function becomes:
 (4)
(4)
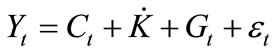
This is the familiar AK-type production function, where the private marginal product of capital is . The consumer spends its after-tax income on consumption goods and savings, which are subsequently invested. Formally, we have
 . Since
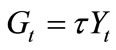 , it is possible to rewrite the aggregate budget constraint for this economy as
 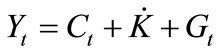 based on the consumer’s budget constraint.
Private capital evolves according to the following law of motion:
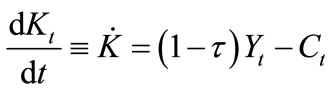 (5)
(5)
The consumer maximizes utility as defined in (1) subject to its budget constraint (5). Using (4), this constraint can be rewritten as 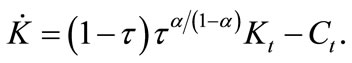 This maximization problem can be easily solved with the use of the Hamiltonian2, which yields the following Euler equation:
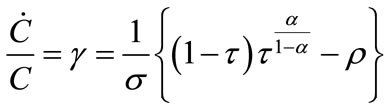 (6)
(6)
In expression (6),  is the general growth rate, corresponding to the growth rate of output, which is the main variable of interest here3. By inspection of (6), it is evident that the tax has two opposing effects on growth mentioned earlier. The tax lowers growth directly because it enters negatively in the term within the parentheses. At the same time, the tax raises growth indirectly by increasing the private marginal product of capital. According to this logic, there is a positive tax rate that maximizes growth, namely
 .4
.4
Let us now consider a self-interested government that is corrupt. Suppose that in such a case not all collected tax revenues are channeled back into private production in the form of public capital. Instead, only a specific fraction of tax revenues collected is used in the production process as public capital, . The remainder,
  , is a distortion associated with government intervention (here, taxation) and represents bribery. In this setting, the representative consumer, upon the payment of its taxes, does not determine the amount that is diverted away from public treasury. This amount is implicitly consumed. In other words, the variable
  is not a choice variable for the consumer. Thus, an increase in corruption lowers effective public capital in line with the level of tax revenues. More formally, consider the following government budget constraint:
 (7)
(7)
where  is effective government spending on public capital,
  is the collected tax revenues, and
  represents total bribes collected and diverted from production. Consider the following two possible cases representing two different ways in which corruption may operate. Consider Case 1 featuring “linear” corruption.
2.5. Case 1
Suppose that the bribe is linear in the tax revenues collected:
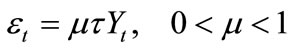 (8)
(8)
where µ is corruption intensity. An increase in µ implies an increase in corruption. No matter the tax rate the government decides to levy for a given level of output, there is always a constant fraction of tax revenues “pocketed away”. Combining (7) and (8), the corrupt government’s budget constraint becomes:
 (9)
(9)
Only a fraction  of tax revenues is used for public capital. The rest is consumed by rent-seekers, who are part of the population. Loosely speaking, since population is normalized to one, in the presence of corrupt government apparatus, the representative consumer implicitly steals from its own self by consuming more, and thereby reducing its savings. Similar to the case with an honest government, the firm lacks the lobbying power necessary to influence not only the tax rate, but also the level of corruption intensity. Expression (9) can be substituted into the production function (2) to obtain:
 (10)
(10)
Note that corruption intensity lowers private marginal product of capital  in Expression (10).
An increase in corruption intensity shifts down the marginal product of capital in a parallel fashion.
It is important to reiterate that a bribe constitutes windfall consumption for the representative consumer. Thus, the maximizing consumer decides only on his consumption and saving levels; the bribe does not enter its decision set. The consumer’s after tax income is spent on consumption and savings, as in the previous case. However, since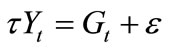 , output is now spent on consumption, investment, effective public spending and on a total bribe as shown in the aggregate budget constraint below:
 (11)
(11)
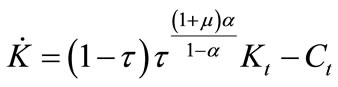
Referring back to the budget constraint of the consumer 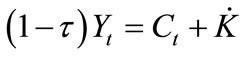 and taking note of (10), capital evolves according to the new equation of motion:
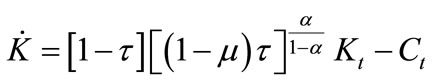 (12)
(12)
Expression (12) reveals how corruption acts as a hindrance to capital accumulation. Since bribe is windfall consumption, the consumer’s momentary utility function is modified in the following way:
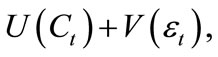 where
where  (13)
(13)
As mentioned earlier,  is considered given and, therefore, is not a decision variable. Moreover, for mathematical convenience, we consider an additive utility function. The consumer maximizes (13) subject to (12). Using the Hamiltonian and the same F.O.C. as in the case without corruption, the following growth rate is derived:
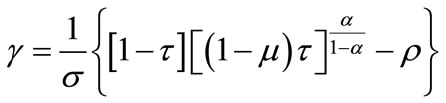 (14)
(14)
Inspecting expression (14) reveals that the corruption intensity parameter,  , lowers the private marginal product of capital thereby decreasing growth. The optimization condition,
  yields the growth-maximizing tax rate
 , which, surprisingly, does not depend on the corruption parameter. The tax has two opposing effects on growth as discussed earlier. The second beneficial effect is weaker because corruption intensity lowers the marginal product of capital. Furthermore, the growth rate is still a single peaked function of the tax. In the presence of constant returns to rentseeking, the “growth-possibility frontier” shifts down leaving the growth-maximizing tax unaffected and independent of
  5.
5.
2.6. Case 2
Another, possibly more insightful option is to introduce corruption intensity in a non-linear fashion. Referring to the complexity of economic growth and that of corrupt behaviour, Aidt, Dutta, & Sena [7] have recently described many sources of non-linearity in the relationship between corruption and growth. In this paper, we depict non-linearity through corruption’s non-linear affect on the private marginal product of capital (that is, via an exponent). This possibility grants some additional complexity to the corruption-growth relationship. Consider the following expression for the government’s budget constraint:
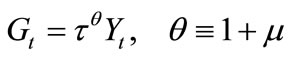 (15)
(15)
where  is corruption intensity such that when
  government is honest and spends all tax revenues on public capital. However, as soon as
 , the government displays corrupt behaviour by lowering the fraction of tax revenues used for public capital6. It follows that a positive amount
  is wasted on unproductive windfall consumption. The fraction diverted from productive public spending,
  is increasing in corruption intensity,
  , at a decreasing rate7. Otherwise, we have a positively sloped and concave relationship between the amount wasted and the intensity of corruption. The choice of this functional relationship aims to reflect the idea that when corruption is very low, a very small fraction of tax revenues is spent unproductively.
The firm continues to take both the tax rate and the corruption intensity parameter as given. Its production function becomes:
 (16)
(16)
Notice that, as expected, the private marginal product of capital is lower than that in the corruption-free model
 . In contrast to Case 1, corruption intensity reduces the private marginal product of capital in a non-linear fashion. It is easy to show that an increase in corruption intensity affects the curvature of the marginal product differently in comparison to the previous case.
The consumer’s optimization problem is similar to the one described in Case 1, with the exception that the consumer now maximizes (13) subject to a new capital accumulation Equation (17):
 (17)
(17)
Using the same procedure, the output growth rate is calculated as follows:
 (18)
(18)
The tax rate that maximizes (18) can again be easily computed:
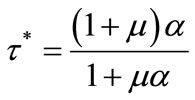 (19)
(19)
Expression (19) reduces to  with
with . As long as
 ,
,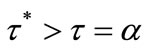 . This result suggests that, in the presence of a non-linear relationship between corruption intensity and the amount wasted, the single-peaked growth as a function of tax is skewed and flattened rightward as shown in Figure 1. Furthermore,
  as long as
 , suggesting that greater corruption intensity flattens and skews the growth function further to the right. Thus, the model with the corruption specification
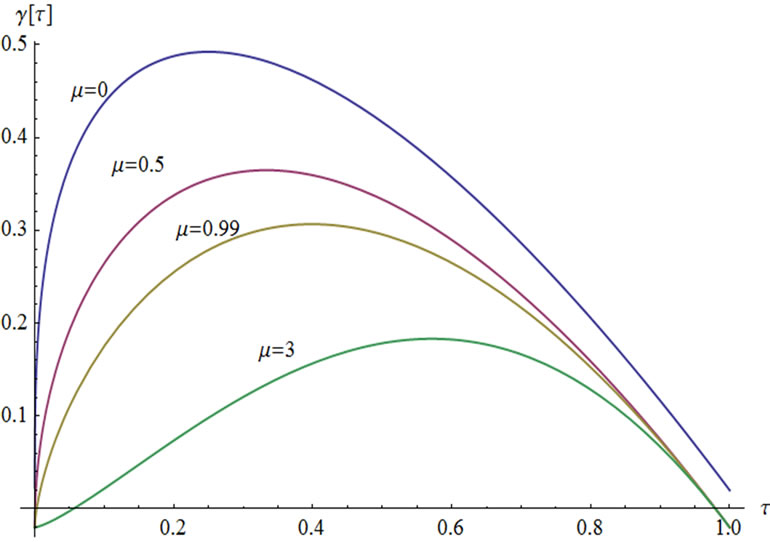
Figure 1. Growth rate as a function of tax for different values of corruption intensity.
of Case 2 yields the following suggestion. If a country manages to successfully reduce its corruption intensity, not only does it raise its maximum possible growth rate, but it also reduces its growth-maximizingtax rate. Graphically, a reduction in  corresponds to an upward and leftward stretch in the “growth possibility frontier”.
Many empirical studies point to the finding that corruption is associated with slow growth. Growth predictions in Case 1 and in Case 2 are consistent with this observation. Moreover, the result of Case 2 is reminiscent of the experience of some countries like Ghana, which implemented a relatively effective anti-corruption policy during the 1980s. As documented by Chand and Moene [9], Ghana’s economic stagnation from 1960s to 1980s was characterized by rent-seeking behaviour of tax officers. In 1981, President Rawlings stepped up with a promise to contain corruption by means of radical reforms, which eventually turned out relatively successful. As the tax system was made simpler and more transparent, the average tax rate was lowered. The improvements in the Ghanaian tax administration are probably due to corruption containment. In this model, such improvement can be reflected by a significant decrease in μ, which is accompanied with a lower .
.
3. Concluding Remarks
This paper presents a simple endogenous growth model where corruption hinders investment. In the presence of corruption, government diverts a part of tax revenues away from investment in public capital, which in turn is a necessary input in private production. Consequently, private marginal product of capital is diminished. Two possible cases have been analyzed. In the first case, where the amount of resources wasted increases linearly with the intensity of corruption, the growth-maximizing tax rate is independent of the intensity of corruption. Such a linear specification of corruption fails to explain successful anti-corruption reforms that lead at the same time to higher growth and lower taxes, in some countries. The second case, which models a non-linear (concave) relationship between the intensity of corruption and the amount of wasted resources offers a better explanation of how fighting corruption can be beneficial not only to growth, but also to the average taxpayer in the economy. A decrease in corruption intensity reduces the growthmaximizing tax rate of the economy. The result of the second case is novel and allows for additional complexity in modelling the corruption-investment-growth nexus.
REFERENCES
- K. M. Murphy, A. Shleifer and R. W. Vishny, “The Allocation of Talent: Implication for Growth,” The Quarterly Journal of Economics, Vol. 106, No. 2, 1991, pp. 503-530. doi:10.2307/2937945
- P. H. Mo, “Corruption and Economic Growth,” Journal of Comparative Economics, Vol. 29, 2001, pp. 66-79. doi:10.1006/jcec.2000.1703
- K. M. Murphy, A. Shleifer and R. W. Vishny, “Why Is Rent-Seeking So Costly to Growth?” The American Economic Review, Vol. 83, No. 2, 1993, pp. 409-414.
- E. Asiedu and J. Freeman, “The Effect of Corruption on Investment and Growth: Evidence from Firms in Latin America, Sub-Saharan Africa, and Transition Countries,” Review of Development Economics, Vol. 13, No. 2, 2009, pp. 200-214. doi:10.1111/j.1467-9361.2009.00507.x
- P. Mauro, “Corruption and Growth,” The Quarterly Journal of Economics, Vol. 110, 1995, pp. 681-712. doi:10.2307/2946696
- R. J. Barro, “Government Spending in a Simple Model of Endogenous Growth,” Journal of Political Economy, Vol. 98, No. 5, 1990, pp. S103-S125. doi:10.1086/261726
- T. Aidt, J. Dutta and V. Sena, “Governance Regimes, Corruption and Growth: Theory and Evidence,” Journal of Comparative Economics, Vol. 36, 2008, pp. 195-220. doi:10.1016/j.jce.2007.11.004
- P. Mauro, “The Persistence of Corruption and Slow Economic Growth,” Staff Papers, International Monetary Fund, Vol. 51, No. 1, 2004, pp. 1-18.
- S. Chand and K. Moene, “Controlling Fiscal Corruption,” World Development, Vol. 27, No. 7, 1999, pp. 1129-1140. doi:10.1016/S0305-750X(99)00050-9
NOTES
*We would like to thank Selma Didic and Roland Pongou for helpful comments and discussions. Usual caveats apply.
#Corresponding author.
1Traditional functional form usually includes a constant technology parameter Aas in . Here, A is assumed to equal 1.
2Denoting , the Hamiltonian for this maximization problem is
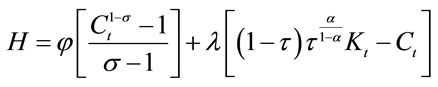
To solve for the optimal consumption path first-order conditions (F.O.C.) require that
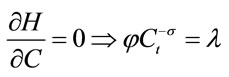 and
and 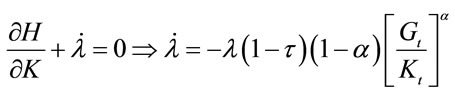
Differentiating with respect to time and combining the above F.O.C we obtain the well-known Euler equation in (16).
3Growth expression in (6) is similar to Barro [6]’s specification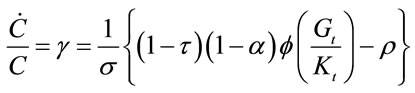 .
.
4As shown in Barro (1990): 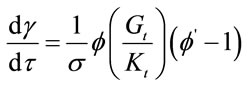 where growthmaximizing condition requires
 . If
. If 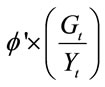 is the elasticity of output with respect to government spending, which is constant and equal to
  with Cobb-Douglas technology, then this condition implies that growth maximizing tax rate is
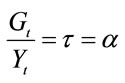 .
.
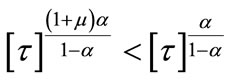
5This result contrasts to some extent with that of Barro [6]’ smodel of a self-interested government, in which the growth-maximizing tax rate is τ > α. Unlike the present model, Barro [6] does not impose any functional relationship between εt and Gt. Mauro [8], who also uses the same production function, arrives to a similar conclusion that stealing away from a productive public input leads to a lower marginal product of capital. In contrast with the present model, in Mauro [8]’ssetting the amount stolen becomes windfall income for the representative firm entering positively in the capital accumulation equation. Here, on the other hand, bribe is an impediment to capital accumulation.
6Although there are other non-linear functional forms that can be used, the functional form in (15) is most mathematically convenient.
7Let 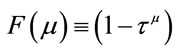 be the fraction of tax revenues allocated to consumption via corruption, then
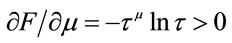
and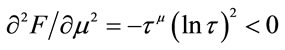 .
.