Open Journal of Obstetrics and Gynecology
Vol.3 No.1(2013), Article ID:26886,4 pages DOI:10.4236/ojog.2013.31011
Comparison of Glycated Albumin (GA) and Glycosylated Hemoglobin (A1C) in monitoring glycemic excursions during pregnancy
![]()
1Dr. V. Seshiah Diabetes Research Institute, Dr. Balaji Diabetes Care Centre, Chennai, India 2Nutrition and Clinical Research Department, Dr. V. Seshiah Diabetes Research Institute, Dr. Balaji Diabetes Care Centre, Chennai, India
Email: vseshiah@gmail.com
Received 3 October 2012; revised 6 November 2012; accepted 15 November 2012
Keywords: GDM; NGT; GA; A1C; GW; MNT; BMI
ABSTRACT
Objective: To compare GA with A1C in monitoring glycemic excursions during pregnancy. Research Design and Methods: This study included 30 women with Gestational Diabetes Mellitus (GDM) and an equal number with Normal Glucose Tolerance (NGT). GDM were followed up every 2 weeks till 36 - 37 weeks and NGT were reviewed monthly once. Fasting Plasma Glucose (FPG), Postprandial Plasma Glucose (PPG), Ferritin, GA and A1C were estimated. GDM were advised Medical Nutritional Therapy (MNT). Target glycemic control was FPG ~ 5 mmol/L and 2 hr PPG ~ 6.6 mmol/L. Non-responders to MNT were administered insulin. Results: In GDM, mean FPG was 5.16 ± 0.55 mmol/L in the first visit and 4.73 ± 0.52 mmol/L in the last visit. The PPG at first visit was 7.07 ± 1.51 mmol/L and 6.16 ± 0.70 mmol/L in the last visit. The mean GA was 12.48% ± 0.8%, 12.51% ± 0.9%, 12.40% ± 1.0%, 12.30% ± 0.86% and 12.38% ± 0.87% at the first, second, third, fourth and fifth visit respectively. The mean A1C at first, third and fifth visits was 5.16% ± 0.35%, 5.24% ± 0.29% and 5.21% ± 0.28% respectively. In NGT women, mean FPG at first visit was 4.37 ± 0.37 mmol/L and 4.39 ± 0.43 mmol/L in the last visit. The mean PPG was 5.95 ± 1.01 mmol/L in the first visit and 5.75 ± 1.61 mmol/L in the last visit. The mean GA was 12.17% ± 0.85% in first visit and 12.10% ± 0.77% in the last visit. A1C was 4.84% ± 0.31% and 4.91% ± 0.33% in the first and last visit respectively. Conclusions: Glycemic control was observed earlier with GA than A1C. GA is a better indicator of recent past shortterm glycemic control in GDM.
1. INTRODUCTION
Women with pre-gestational diabetes and their fetuses are at increased risk of developing serious complications compared with the non-diabetic pregnant women, includeing spontaneous abortion, preterm labor, hypertensive disorders, and delivery by cesarean section despite improved access and quality of antenatal care [1]. Women diagnosed to have gestational diabetes mellitus (GDM) during pregnancy also do develop similar complications, though not of same magnitude. Gestational diabetes mellitus accounts for ~90% of cases where pregnancy is complicated by diabetes [2], with potentially long-reaching consequences, including increasing the risk of subsequently developing type 2 diabetes for both mother and child [3]. Disrupted metabolic homeostasis has been implicated as a possible cause [4]; indeed, fetal macrosomia may result from minor disturbances in glucose metabolism [5]. These observations indicate an optimum glycemic control is essential to minimize the maternal and fetal morbidity and mortality of pregnancies complicated by glucose intolerance [6]. This is possible by home glucose monitoring by the glucometers which gives immediate glycemic level and by estimation of glycated proteins which indicate the glycemic excursions of the past few weeks to months.
Glycated proteins GA and A1C are known to reflect the plasma glucose level and are used as a standard index of glycemic control in patients with diabetes mellitus [7]. Since the lifespan of erythrocytes is about 120 days, A1C reflects the glycemia for the recent few months. Glycated albumin (GA) is an another index of glycemic control which correlates with the plasma glucose levels during the recent past few weeks because the turnover of albumin is about 20 days. Although the ratio of GA/A1C is usually close to 3, the value changes based on the metabolic state [8]. Several recent studies have confirmed that the point measurements of GA and A1C are closely correlated in diabetes. But publications are not many on the clinical use of GA as a marker for shortterm glycemic control in GDM. Hence this prospective study was undertaken with the aim of comparing GA with A1C and out of them which would serve as a earlier marker of glycemic control during pregnancy.
2. RESEARCH DESIGN AND METHODS
This study was initiated with the approval of ethics committee of the institute. A total of 524 pregnant women between 24 - 28 gestational weeks underwent 2 hrs OGTT with 75 g glucose from 21st Oct 2010 to 10th May 2012, in our “diabetes and pregnancy” specialty referral clinic. Among them, 271 were diagnosed as GDM by WHO criteria of 2 hr PG ≥ 7.8 mmol/L [9]. They were all explained about the study, particularly about the importance of adhering to the follow up schedule. A cohort of 30 GDM and 30 NGT women were included in this study after obtaining their informed consent. Details regarding family history, previous obstetric history, treatment for any concomitant diseases and food habits were obtained. Mean age, mean Body Mass Index (BMI) and mean Gestational Week (GW) were recorded for both GDM and NGT.
GDM were advised Medical Nutrition Therapy (MNT). The target glycemic control aimed was FPG ~ 5 mmol/L and 2 hr PPG ~ 6.6 mmol/L. Non-responders to MNT were administered insulin GDM were followed up every 2 weeks till 36 - 37 weeks. Venous blood samples were collected from them on each visit and their FPG, PPG were measured by GOD-POD method by Hitachi autoanalyzer 902. GA was estimated by Lucica GA-L assay kit—enzymatic method. For estimation of A1C the venous blood was collected at the first visit, third visit (4th week) and fifth visit (8th week). A1c was measured by automated determination with high-performance liquid chromatography (Bio-Rad). Ferritin level was measured by Ferro zinc electro chemiluminescence method—automated determination with cobas during first and fourth visits in both GDM and NGT. NGT were reviewed monthly once and the same biochemical parameters were determined.
Statistical Analysis
Statistical analysis was performed by SPSS version 10. Comparison of mean values between the two groups was done by independent t-test and p value < 0.05 was considered statistically significant.
3. RESULTS
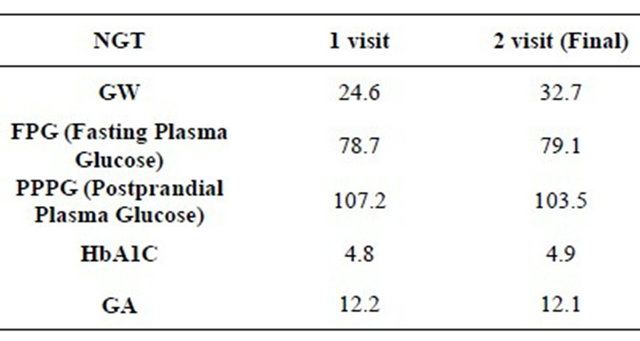
Mean age of GDM and NGT were 27.10 ± 4.05 and 23.80 ± 3.61 years; mean BMI was 26.50 ± 4.28 kg/m2 and 22.10 ± 5.58 kg/m2, mean GW was 26.23 ± 2.24 and 24.60 ± 1.87, respectively.
In GDM, mean FPG at first and last visit was 5.16 ± 0.55 mmol/L and 4.73 ± 0.52 mmol/L, respectively. PPG at first visit was 7.07 ± 1.51 mmol/L and 6.16 ± 0.70 mmol/L in the last visit, The mean GA was 12.48% ± 0.8%, 12.51% ± 0.9%, 12.40% ± 1.0%, 12.30% ± 0.86% and 12.38% ± 0.87% in first, second, third, fourth and fifth visit. The mean A1c at first visit was 5.16% ± 0.35%, in the third visit (4th week) 5.24% ± 0.29% and in the last visit (8th week) 5.216% ± 0.28%. In this study both GA and A1C values run parallel (Figure 1). In NGT women, mean FPG in the first was 4.37 ± 0.37 mmol/L and in the last visit 4.39 ± 0.43 mmol/L. Mean PPG was 5.95 ± 1.01 mmol/L in the first visit and 5.75 ± 1.61 mmol/L in the last visit. Mean GA was 12.17% ± 0.85% and 12.10% ± 0.77% at the first and the last visit respectively. A1c was 4.84% ± 0.31% and 4.91% ± 0.33% in the first and the last visit respectively. Ferritin value for GDM was 26.2 ± 11.4 ng/mL and 26.7 ± 12.5 ng/mL in first & fifth visits. The glycemic control was observed earlier with GA, around two weeks compared to eight weeks by A1C. Anthropometric findings and biochemical parameters are given Table 1 for GDM and Table 2 for NGT groups. Among 30 GDM, 7 responded to MNT and the remaining required insulin for glycemic control.
4. DISCUSSION
Obesity and advanced age are the risk factors for the
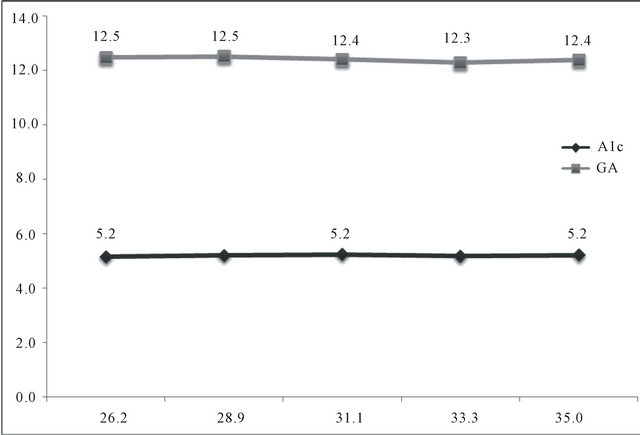
Figure 1. Mean gestational weeks, A1C and GA (Glycated Albumin) among GDM (Gestational Diabetes Mellitus).
Table 1. Biochemical parameters for GDM group mean values.

Table 2. Biochemical parameters for NGT Group Mean Values.
development of GDM [10]. In this study also, these factors were observed as risk factors for GDM. During pregnancy a strict glycemic control is essential to prevent the perinatal complications. The ideal glycemic control for this would be FPG ~ 5 mmol/L, 2 hr PPG ~ 6.6 mmol/L and mean plasma glucose 5.85 mmol/L [11]. The therapy is adjusted by monitoring the plasma glucose both in the fasting and post prandial state. To understand the glycemic excursions during pregnancy besides performing the point of care by capillary blood glucose measurement with glucometers, there is a need to have a test which could give an idea about the plasma glucose excursions in the previous weeks. GA as well as A1C are useful markers of glycemic control in the recent past [12]. GA reflects the retrospective glycemic excursions in the immediate past of approximately two weeks and A1C, glycemic excursions of more than eight weeks.
There is a biphasic variation of A1C levels during pregnancy [13]. The biphasic variation of A1C levels in subjects with NGT [14] and GDM [15] is explained by iron-deficiency anemia in them. This phenomenon is attributed to increase in A1C as a result of extension of red cell survival due to iron deficiency anemia [16-18] and these findings have been confirmed by Kim C. et al. [19]. GA is not affected by this phenomenon and thus serves as a better indicator of short term glycemic control.
In this study, GA levels strongly correlated with the A1C levels in both GDM and NGT women and these glycated proteins also correlated with FPG and PPG, similar to the observation of Yang et al. and Abe et al. [10,12]. Hashimoto K et al. [14] documented that A1C but not GA was elevated because of iron deficiency anemia in late pregnancy in diabetic women. In our cohort, we did not find this difference as the ferritin level was within the normal range. This is due to the public health policy of iron and folic acid supplementation from the preconception period itself. In this study both GA and A1C values run parallel. This is due to the intervention with MNT or insulin to maintain the maternal plasma glucose at the target glycemic level. Another observation in this study is GA indicates maternal glycemic control of the past few weeks whereas A1C level indicates of the past few weeks to months, but the important clinical advantage of GA is that, it reveals glycemic excursions earlier.
5. CONCLUSION
GA is a better indicator of short term glycemic excursions than A1C. GA offers an opportunity for earlier interventions to obtain a better glycemic control during pregnancy and thus good fetal outcome. We recommend more studies in this aspect.
6. ACKNOWLEDGEMENTS
We thank the patients for their co-operation during the study. This study received financial support from Asahi Kasei Pharma, Japan.
![]()
![]()
REFERENCES
- The Confidential Enquiry into Maternal and Child Health (CEMACH) (2005) Pregnancy in women with type 1 and type 2 diabetes in 2002-2003, England Wales and Northern Ireland. CEMACH, London.
- Expert Committee on the Diagnosis and Classification of Diabetes Mellitus (2003) Report of the expert committee on the diagnosis and classification of diabetes mellitus. Diabetes Care, 26, S5-S20. doi:10.2337/diacare.26.2007.S5
- Dornhorst, A. and Rossi, M. (1998) Risk and prevention of type 2 diabetes in women with gestational diabetes. Diabetes Care, 21, B43-B49.
- McCance, D.R., Pettitt, D.J., Hanson, R.L., Jacobsson, L.T., Knowler, W.C. and Bennett, P.H. (1994) Birth weight and non-insulin dependent diabetes: Thrifty genotype, thrifty phenotype, or surviving small baby genotype? British Medical Journal, 308, 942-945. doi:10.1136/bmj.308.6934.942
- Mello, G., Parretti, E., Mecacci, F., Lucchatti, R., Cianciulli, D., Lagazio, C., Pratesi, M. and Scarselli, G. (1997) Anthropometric characteristics of full-term infants: Effects of varying degrees of normal glucose metabolism. Journal of Perinatal Medicine, 25, 197-204. doi:10.1515/jpme.1997.25.2.197
- Ekbom, P., Damm, P., Nogaard, K., Clausen, P., FeldtRasmussen, U., Feldt-Rasmussen, B., Nielsen, L.H., Molsted-Pedersen, L. and Mathiesen, E.R. (2000) Urinary albumin excretion and 24-hour blood pressure as predictors of pre-eclampsia in type I diabetes. Diabetologia, 43, 927-931. doi:10.1007/s001250051471
- Bunn, H.F., Gabbay, K.H. and Gallop, P.M. (1978) The glycosylation of hemoglobin: Relevance to diabetes mellitus. Science, 200, 21-27. doi:10.1126/science.635569
- Koga, M. and Kasayama, S. (2010) Clinical impact of glycated albumin as another glycemic control marker. Endocrine Journal, 57, 751-762. doi:10.1507/endocrj.K10E-138
- Alberti, K.G. and Zimmet, P.Z. (1998) Definition, diagnosis and classification of diabetes mellitus and its complications. Part 1: Diagnosis and classification of diabetes mellitus provisional report of a WHO consultation. Diabetic Medicine, 15, 539-553. doi:10.1002/(SICI)1096-9136(199807)15:7<539::AID-DIA668>3.0.CO;2-S
- Yang, H., Wei, Y., Gao, X., Xu, X., Fan, L., He, J., Hu, Y., Liu, X., Chen, X., Yang, Z. and Zhang, C. (2009) China National GDM Survey Working Group. Risk factors for gestational diabetes mellitus in Chinese women: A prospective study of 16,286 pregnant women in China. Diabetic Medicine, 26, 1099-104.
- Langer, O., Levy, J., Brustman, L., Anyaegbunam, A., Merkatz, R. and Divon, M. (1989) Glycemic control in gestational diabetes mellitus—How tight is tight enough: Small for gestational age versus large for gestational age? American Journal of Obstetrics & Gynecology, 161, 646- 653.
- Abe, F., Miyamoto, N., Tahara, Y., Takahashi, J. and Shima, K. (1993) Serum glycated albumin concentrations during pregnancy. Annals of Clinical Biochemistry, 30, 198-200.
- Worth, R., Potter, J.M., Drury, J., Fraser, R.B. and Cullen, D.R. (1985) Glycosylated haemoglobin in normal pregnancy: A longitudinal study with two independent methods. Diabetologia, 28, 76-79.
- Hashimoto, K., Noguchi, S., Morimoto, Y., Hamada, S., Wasada, K., Imai, S., Murata, Y., Kasayama, S. and Koga, M. (2008) A1C but not serum glycated albumin is elevated in late pregnancy owing to iron deficiency. Diabetes Care, 31, 1945-1948. doi:10.2337/dc08-0352
- Hashimoto, K., Osugi, T., Noguchi, S., Morimoto, Y., Wasada, K., Imai, S., Waguri, M., Toyoda, R., Fujita, T., Kasayama, S. and Koga, M. (2010) A1C but not serum glycated albumin is elevated because of iron deficiency in late pregnancy in diabetic women. Diabetes Care, 33, 509-511. doi:10.2337/dc09-1954
- Brooks, A.P., Metcalfe, J., Day, J.L. and Edwards, M.S. (1980) Iron deficiency and glycosylated haemoglobin A. Lancet, 2, 141. doi:10.1016/S0140-6736(80)90019-7
- Tarim, O., Küçükerdoğan, A., Günay, U., Eralp, O. and Ercan, I. (1999) Effects of iron deficiency anemia on hemoglobin A1C in type 1 diabetes mellitus. Pediatrics International, 41, 357-362.
- Coban, E., Ozdogan, M. and Timuragaoglu, A. (2004) Effect of iron deficiency anemia on the levels of hemoglobin A1c in nondiabetic patients. Acta Haematologica, 112, 126-128. doi:10.1159/000079722
- Kim, C., Bullard, K.M., Herman, W.H., Beckles, G.L., Kim, C., Bullard, K.M., Herman, W.H. and Beckles, G.L. (2010) Association between iron deficiency and A1C levels among adults without diabetes in the national health and nutrition examination survey, 1999-2006. Diabetes Care, 33, 780-785. doi:10.2337/dc09-0836