Optics and Photonics Journal
Vol.2 No.3(2012), Article ID:22503,4 pages DOI:10.4236/opj.2012.23029
Primary Study of the Use of Laser-Induced Plasma Spectroscopy for the Diagnosis of Breast Cancer
1National Institute of Laser Enhanced Sciences, Cairo University, Giza, Egypt
2College of Medicine, Cairo University, Giza, Egypt
3College of Medicine, King Saud University, Riyadh, KSA
4College of Applied Medical Science, King Saud University, Riyadh, KSA
Email: hishamimam@niles.edu.eg
Received June 20, 2012; revised July 17, 2012; accepted July 29, 2012
Keywords: LIPS; Malignant; Breast
ABSTRACT
Breast cancer, or malignant breast neoplasm, is a type of cancer that originates from breast tissue, most commonly from the inner lining of the milk ducts or the lobules that supply the ducts with milk. It is one of the most widespread diseases, especially in women. Thus far, large efforts have been towards the early diagnosis of cancer in general, and breast cancer specifically. Most of these techniques deal with malignant tissues without inducing or increasing pathological tissue changes or causing major side effects for the patient. This paper proposes a new technique for diagnosing the presence or occurrence of cancer and assessing its grade early, accurately, and safely. The presented technique depends on the interaction between the laser and the soft tissue in order to induce plasma, and allows us to classify the cancer by studying the difference in the intensity ratio of the trace elements in normal and malignant tissues. The results presented here show that only four patients out of the total sample of 30 have erroneous trace elements and that this does not affect the overall decision. Hence, the performance of LIPS can be measured as 87%, while retaining 100% accuracy. Furthermore, LIPS technique is a simple and promising technique that is capable of diagnosing malignant cells and tissues.
1. Introduction
Laser-Induced Plasma Spectroscopy (LIPS), also known as Laser-Induced Breakdown Spectroscopy, is a form of atomic emission spectroscopy. When the output from a (pulsed) laser focuses on a small spot of a solid surface, an optically induced plasma, frequently called a laser induced plasma, laser-ablated plasma, or laser spark is formed on this surface. Plasma, which is defined as “the fourth state of matter,” occurs as an electrified gas with the atoms dissociated into positive ions and negative electrons. Further, it may be defined alternatively as a medium whose dielectric properties are determined only by free charges.
LIPS technique consists of three main parts, namely an ablation laser, a detector, and focusing and collection optics. This technique utilizes the high power densities obtained by focusing the radiation from a pulsed, fixed frequency laser (usually Nd:YAG) to generate a luminous micro-plasma in the focal region of an analyte. The energy density in the focal region can reach values up to GW/cm2. Part of the laser pulse energy is used to ablate the sample of interest; subsequently, the material in the plasma core is vaporized and atomized. The plasma temperature can reach several electron volts and the plasma is typically highly ionized. In a good approximation, the plasma composition is representative of the analyte’s elemental composition [1]. This technique has been used extensively for qualitative determinations with great success as well as successfully used for the elemental analysis of solids, liquids, gases, and aerosols, meaning that it is increasingly applied in basic and applied research [2].
Analyses for trace elements in biological tissue are uniquely susceptible to extreme errors unless special precautions are taken during collection, storage, and analysis. The integrity of the specimen can be compromised before it is analyzed, by contamination during collection and processing or by the attenuation of the analytic concentration during storage. If this happens, the determined values are not valid even though the method of analysis is extremely sensitive and highly accurate [3].
Breast cancer (also known as malignant breast neoplasm) is a type of cancer that originates from breast tissue, most commonly from the inner lining of the milk ducts (ductal carcinomas) or the lobules (lobular carcinomas) that supply the ducts with milk. It is a disease that afflicts humans and other mammals. While the overwhelming majority of cases are women, men can also develop breast cancer [4].
Although most types of breast cancers are easy to diagnose through the microscopic analysis of a biopsy, rarer types of breast cancers require specialized examination. Further, while screening techniques are useful in determining the possibility of cancer, further testing is necessary to confirm whether a lump detected during a screening is cancerous as opposed to a benign alternative such as a simple cyst [5].
Both mammography and clinical breast examinations can indicate the approximate likelihood that a lump is cancerous, while both approaches can also detect other lesions. When the test results are inconclusive, however, fine needle aspiration cytology may be used. Other options for carrying out a biopsy include a core biopsy, where a section of the breast lump is removed, and an excisional biopsy, where the entire lump is removed. In addition, a vacuum-assisted breast biopsy may help diagnose breast cancer among selected female patients [6]. Further, carcinoma in situ is the growth of low-grade cancerous or precancerous cells within a particular tissue compartment such as the mammary duct without the invasion of the surrounding tissue. By contrast, invasive carcinoma is not confined to the initial tissue compartment.
Breast cancer can be graded by comparing the appearance of breast cancer cells with that of normal breast tissue. Whereas normal cells in an organ such as the breast are usually differentiated, meaning that they take on specific shapes and forms that reflect their function as part of that organ, cancerous cells lose that differentiation. In cancer, the cells that would usually line up in an orderly way to make up the milk ducts thus become disorganized, cell division becomes uncontrolled, and cell nuclei become less uniform. Pathologists describe cells as well differentiated (low grade), moderately differentiated (intermediate grade), and poorly differentiated (high grade) as the cells progressively lose the features seen in normal breast cells. Poorly differentiated cancers have a worse prognosis [7].
The calculation of electron density using the LIPS technique shows that differences between normal and malignant cells might be supported by the hypothesis that an alteration in glucose uptake within malignant cells may cause these tissues to have elevated electron density [8]. Indeed, previous studies have reported that the concentration of trace elements varies for cancerous and noncancerous cells [9,10]. This research has shown a clear distinction between intensity based on the concentration of trace elements in normal and malignant tissues, finding that the concentration of trace elements such as calcium, iron, and manganese is larger in normal cells in comparison with malignant cells. The ratio of the intensity of different atomic lines observed in the LIPS signal compared with that for the calcium line has also been compared.
The present research aims to distinguish between normal and malignant tumor cells from histological sections by using LIPS in order to measure in real time the concentrations of trace elements. The overall objective is for this technique to be incorporated with laser scalpels in order to monitor the cancer-affected area during surgery. We believe this technique has the potential to be an automated, real-time diagnostic procedure for cancer that would greatly facilitate the diagnosis and classification of tumors.
2. Materials and Methods
The plasma was formed with the aid of a Q-switched Nd:YAG laser (Continuum, Surellite II, USA) operating at the fundamental wavelength (1064 nm) with a pulse duration of 10 ns and a variable repetition rate in the range 1 - 10 Hz. The temporal history of the plasma was obtained by recording the emission features at predetermined delay times using a variable delay generator, which is triggered by the laser pulse. The laser beam with pulse energy of 350 mJ was used for sample ablation. Energy was adjusted using a suitable combination of beam splitters at a constant high voltage (1.3 kV) and a Q-switch delay to ensure spatial and temporal beam profile stability.
An energy meter (Nova, Ophir Optronics Ltd., USA) was employed to monitor the shot-to-shot pulse energy. The laser was a single pulse with an optimized delay time (td) of 1500 ns and an optimized gate width (tw) of 10,000 ns. The beam from the pulsed laser was passed through a quartz plano-convex lens (10 cm focal length) and focused on the sample in order to create a spark or breakdown in the medium. The light emission from the sample was collected and conveyed to the Echelle spectrometer (SE200PI-HO, Princeton, USA) by means of a 1 m long fused-silica optical fiber mounted on a micro-xyz translation stage. The Echelle spectrometer provided a constant spectral resolution of 3100 (CSR), over a wavelength range of 190 - 1100 nm, displayable in a signal spectrum.
A getable, intensified ICCD camera, (Princeton, IMAX) coupled to the spectrometer was used to detect the dispersed light. To avoid electronic interference and jitters, the intensifier high voltage was triggered optically. The Echelle grating spectrometer provides high resolution in a more compact size and covers a much wider spectral range compared with conventional grating spectrometers [11].
Emission spectra were analyzed using the commercial GRAMS Spectroscopic Data Analysis software (version 8.0; Galactic Industrial Salem, NH, USA), which reads data from the chip and reconstructs the spectrum. This makes it possible to measure a large wavelength range simultaneously with a high spectral resolution. In addition to the atomic database used by the mentioned software, spectral lines were identified by the latest electronically published database [http://webbook.nist.gov]. Both malignant and normal tissue cells were exposed to Nd:YAG laser pulses of a sufficient energy level to induce the plasma at 1064 nm. No real sample preparation was needed to take the LIPS measurements, because the malignant and normal tissue cells were placed on a glass plate and the laser light was focused in such a way that not only the base glass but also the ablation of the cells took place.
Atomic absorption spectroscopy was used to estimate the concentrations of the studied elements (i.e., zinc, copper, iron, manganese, and calcium concentrations) and then the same samples in normal and malignant breast tissues were measured using the LIPS technique. The samples of known weight were first prepared. Each sample was kept in a dry clean vial and maintained until analyzed. Tissue samples were then digested using the dry weight technique, which is a simple and efficient digestion method for rapid sample preparation and quantification-assisted acid digestion by concentrated nitric acid. After digestion, the samples were diluted using distilled water and then assayed by an atomic absorption spectrophotometer.
The emission intensities of each element were normalized to the emission intensity of the calcium line (393.36 nm) in order to reduce the effect of instrument signal fluctuation and matrix interference effects, where calcium was considered to be a constant constituent of the analyzed samples. The steps necessary to analyze the sample using the LIPS technique were also straightforward, namely exposing the malignant and normal tissue cells to the focused laser pulses as shown in the experimental setup in Figure 1.
The light emitted from the laser-produced plasma on the sample surface was collected by an optical fiber cable and fed to the Echelle spectrometer. The dispersed light was then transformed into its corresponding emission spectrum in the ICCD camera and displayed on a PC for further analysis using the GRAMS software.
Each sample was measured five times at five different spots on the malignant and normal tissue cell samples. These five obtained spectra were then averaged to obtain the final spectrum, as shown in Figure 2. The concentration of each element was calculated by replacing its relative intensity in its specific calibration curve equation [12].
Thirty surgical specimens of breast cancer cases were randomly obtained from patients aged from 30 to 65 years old. Sixteen surgical specimens were obtained by excisional biopsy and 14 by radical mastectomy operation. All specimens were fixed in formalin (10% formaldehyde in
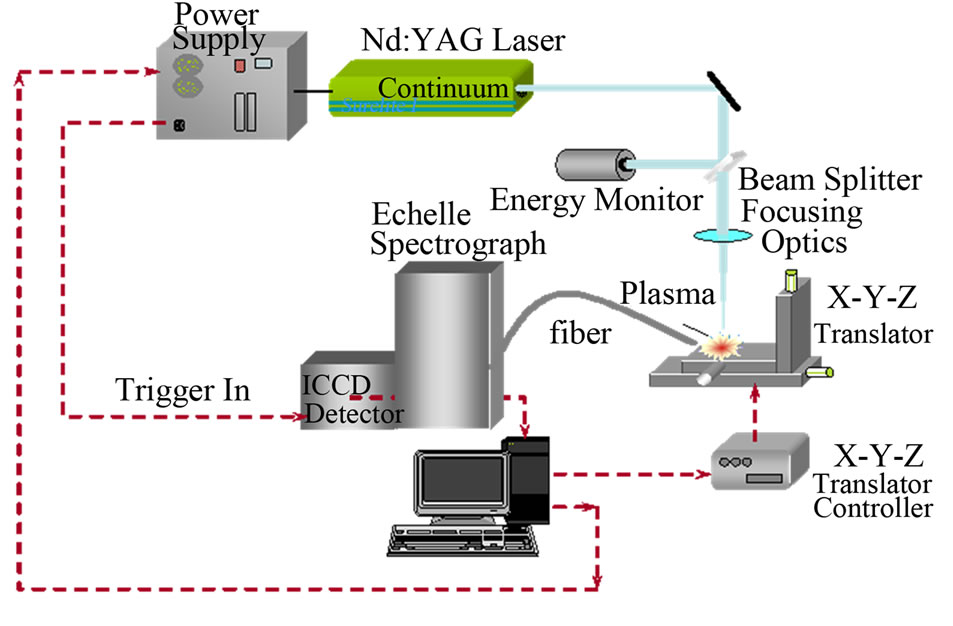
Figure 1. The experimental setup for the LIPS technique.
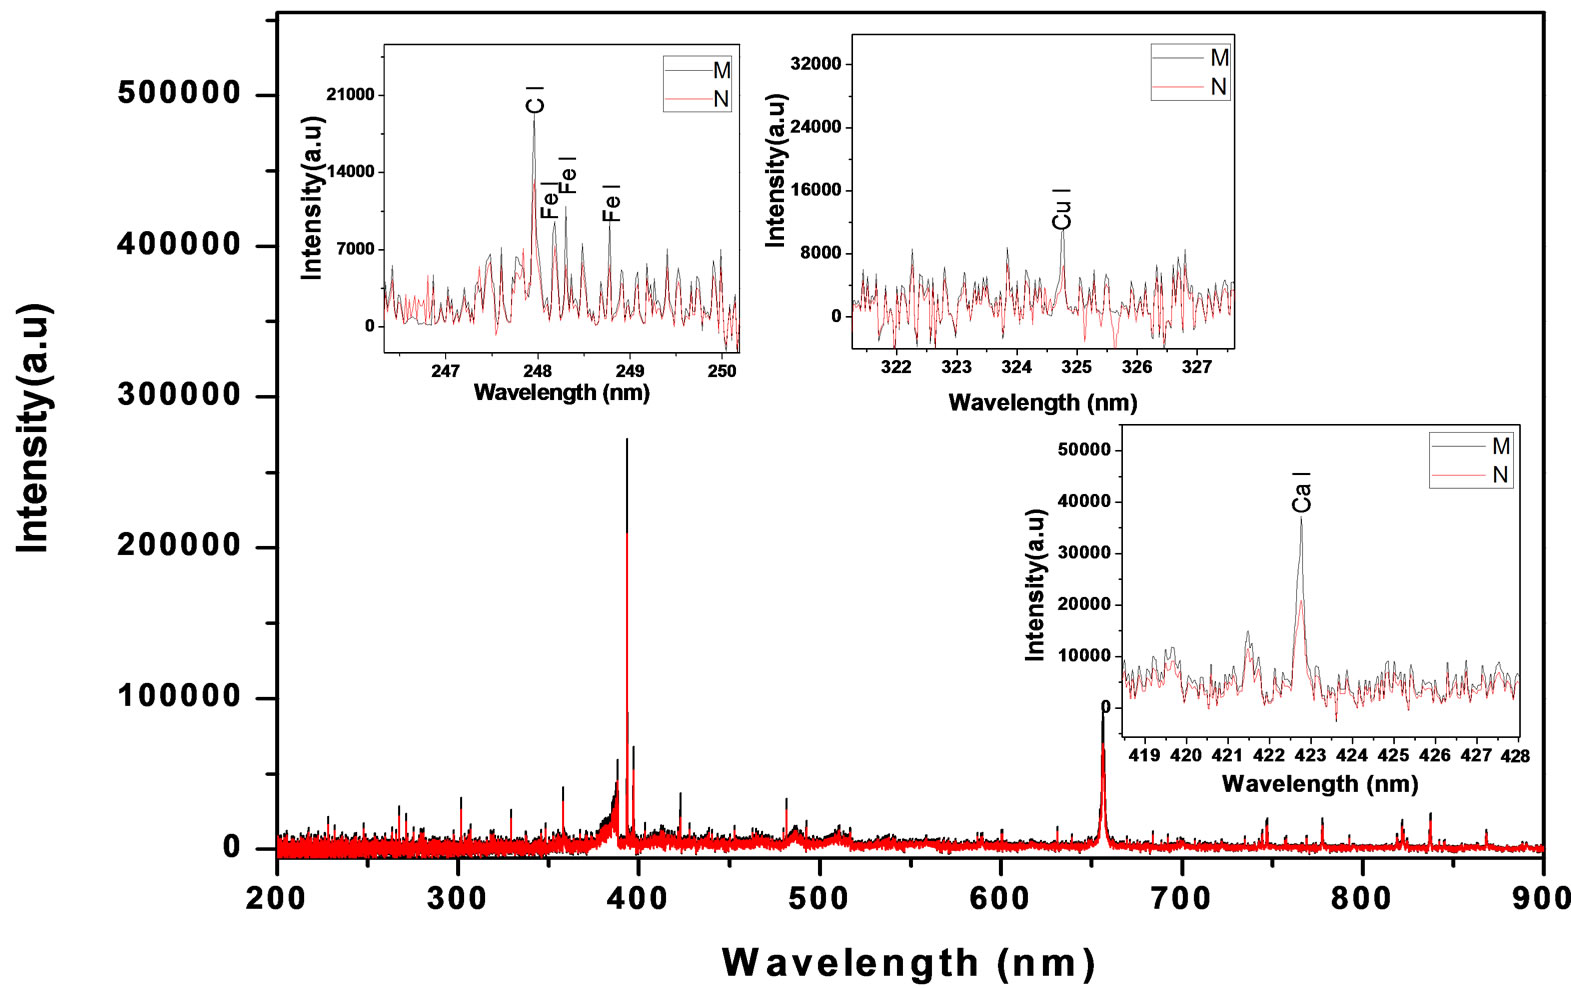
Figure 2. LIBS spectrum of malignant and normal tissues, with zoomed segments of Ca, Cu, C and Fe lines.
water) and then histologically processed to form paraffin blocks, which were sectioned at 4 μm using a microtome. These sections were layered on a glass slide for staining and the slides were embedded for 2 minutes in hematoxylin (which stains the nuclei blue) and then eosin (which stains the cytoplasm and the extracellular connective tissue matrix pink). The histological slides were finally examined under a microscope.
3. Results and Discussion
The 30 reports classified each breast cancer case into two types: lobular and/or ductal. Examples of a pathology photo of a ductal carcinoma and a lobular carcinoma are presented in Figure 3. This classification of the cases yielded 27 (90%) ductal carcinoma cases and three cases (10%) of lobular carcinoma (Figure 3).
As mentioned in the Materials and Methods, each sample was measured five times after its exposure to the Nd:YAG laser beam in order to create a plasma on the surface of the tissue. The five spectrum segments of the normal and malignant samples were then recorded, where five laser shots on each sample were accumulated with a delay time (td) of 1500 ns and a gate width (tw) of 10,000 ns. The wavelengths of interest were 393.6 nm and 422.6 nm for Ca, 388.6 nm for Fe, 324.75 nm for Cu, 334.5 nm for Zn, and 259.37 nm for Mn. The results of the Ca concentrations in malignant and normal samples are presented in Figure 4. The concentrations of Zn, Cu, Mn, and Fe in each sample were normalized to that of Ca in the same sample. These measurement results are presented in Figures 5-8. The results obtained using the LIPS technique showed an enhancement in the concentration levels of the tested trace elements (Ca, Zn, Cu, Mn, and Fe) in the malignant breast tissue samples compared with the levels of the normal ones. Voting as a decision-level fusion method is the simplest approach to fusing the outputs of multiple estimates or predictions by emulating the way in which humans reach consensus. The fused output decision is thus based on majority rule (i.e., the maximum number of votes wins). Variations in voting techniques include weighted voting (i.e., in which sensors are given relative weights), plurality, and consensus methods.
To implement this structure, each classification or prediction, i, outputs a binary vector, Xi, with D elements (i.e., the number of hypothesized output decisions). The binary vectors are combined into a matrix X, with row i representing the input from sensor i. The voting fusion structure then sums the elements in each column as described by the following equation:
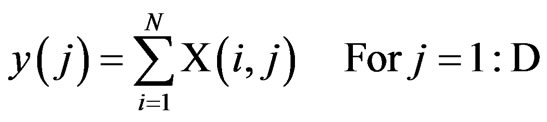
The output, y(j), is a vector of length D, where each element indicates the total number of votes for output class j. At time k, the decision rule selects the output, D (k), as the class that carries the majority vote, according to the following Equation:
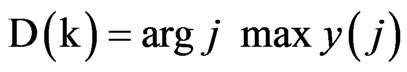
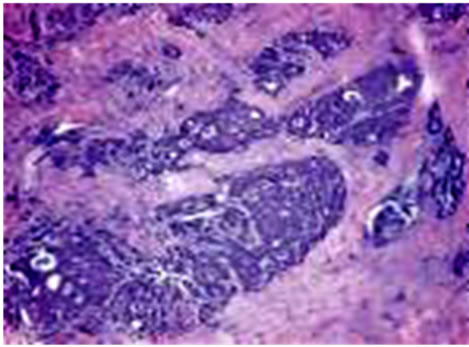

Figure 3. Example of pathology photos of a ductal and a lobular carcinoma.
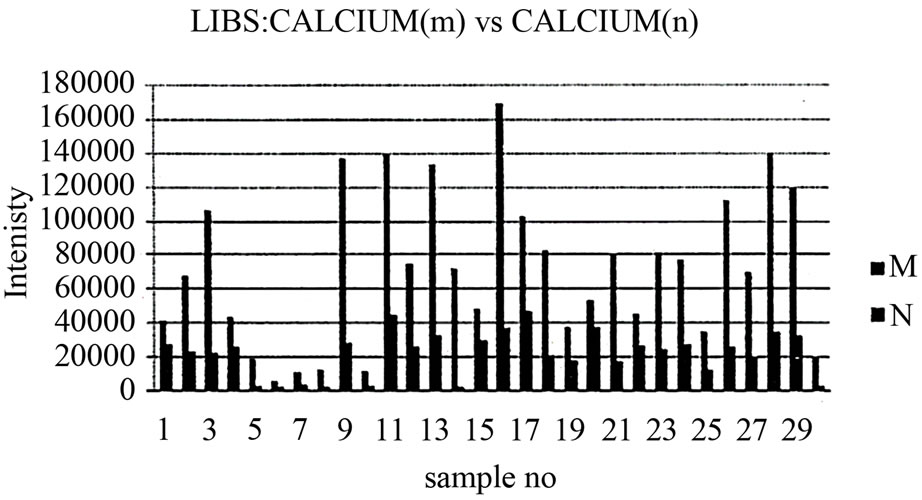
Figure 4. Relation between calcium in malignant and normal tissues using LIPS.
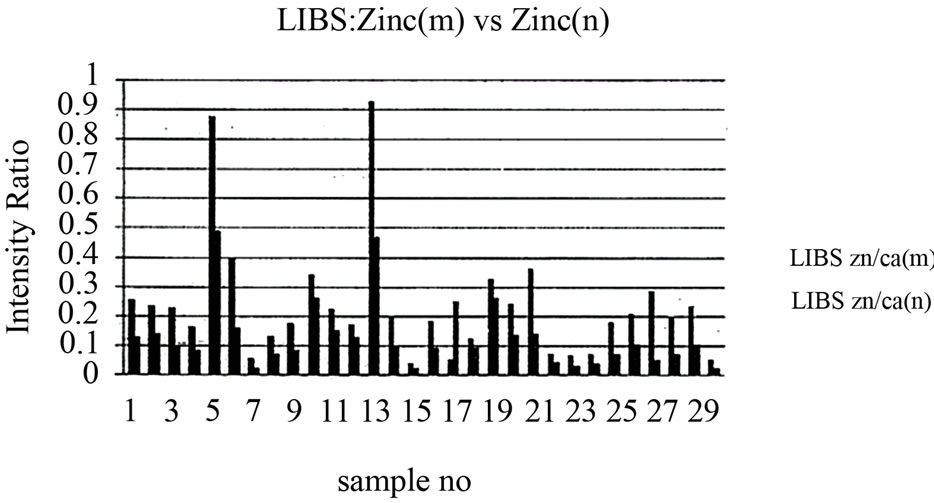
Figure 5. Relation between zinc to calcium ratio in malignant and normal tissues.
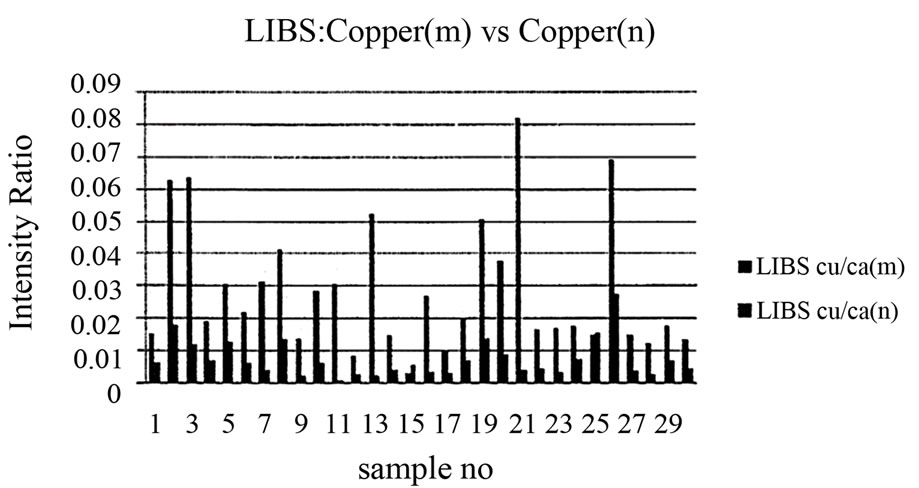
Figure 6. Relation between copper/calcium ratio in malignant and normal tissues.
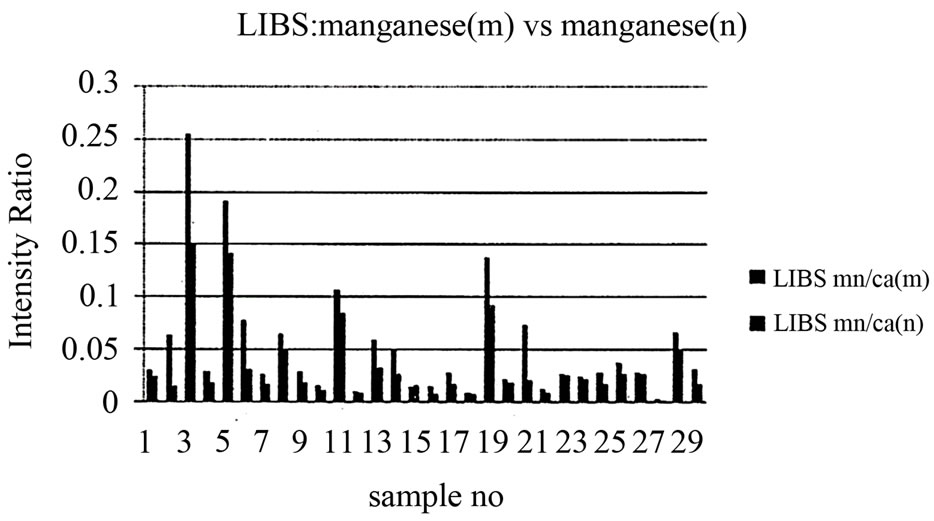
Figure 7. Relation between magnesium/calcium ratio in malignant and normal tissues.
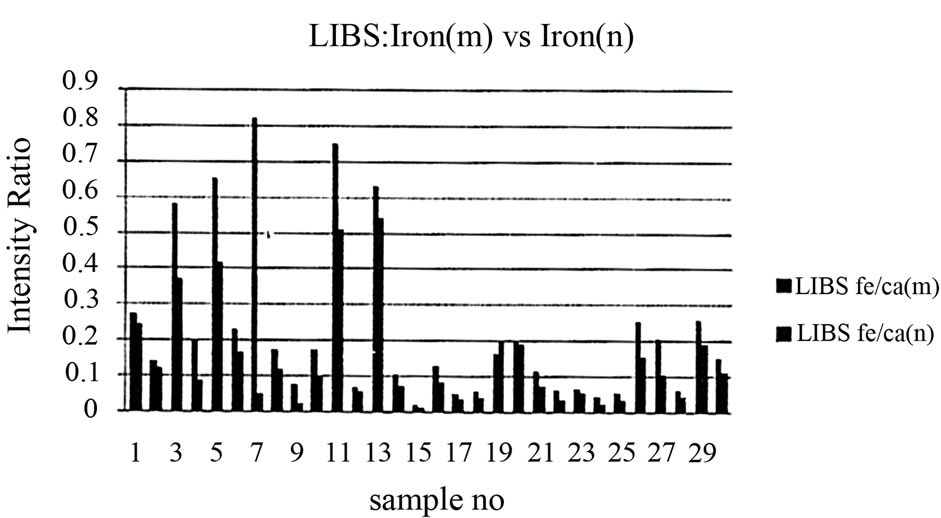
Figure 8. Relation between iron/calcium ratio in malignant and normal tissues.
The voting algorithm generates a decision for a certain problem by taking the votes of more than one decision element. The decision is then taken by considering the majority of votes as a global decision. In the breast cancer diagnostics using LIPS, five factors were thus measured and considered to be decision members. These factors were the normalized traces elements, namely copper, zinc, calcium, manganese, and iron.
One of the advantages of the LIPS approach is the ease of collecting data on a computer in a standardized form. These data sheets are picked up instantaneously by the voting algorithm and run against it to quickly decide whether cells are normal or malignant. The voting algorithm runs once for every trace element and “votes” for each element as normal or malignant. A counter is then started to tally the number of votes for each case, with a final decision taken at the end of the algorithm, namely after the last trace element has been tested. The malignant/normal decision-making flowchart used in this study is presented in Figure 9.
The data collection phase of the testing procedure yielded differences in the intensity values of malignant and normal tissue samples (Table 1). If the difference was a positive value (i.e., the malignant intensity was higher than the normal intensity), an increment in the malignant counter occurred, and vice versa. The voting algorithm yielded accurate results for the 30 investigated samples. As expected,
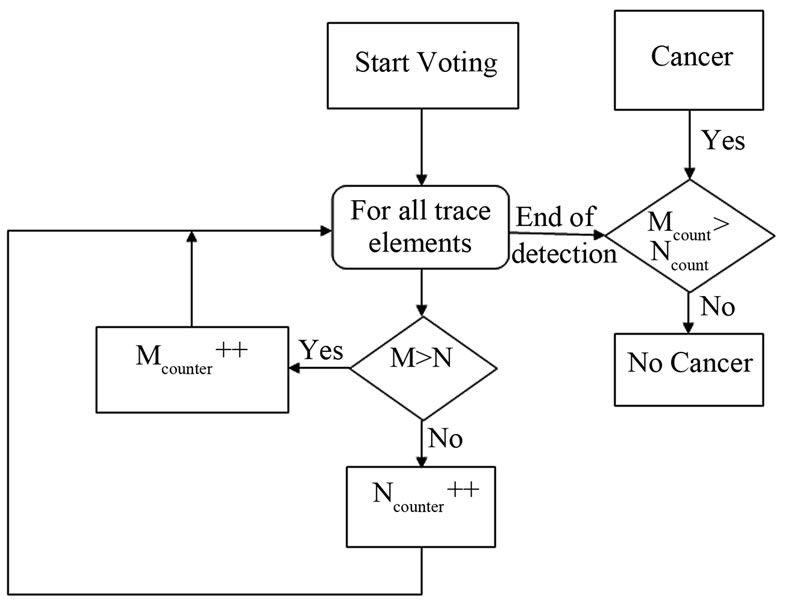
Figure 9. Voting algorithm for malignant/normal decision making.
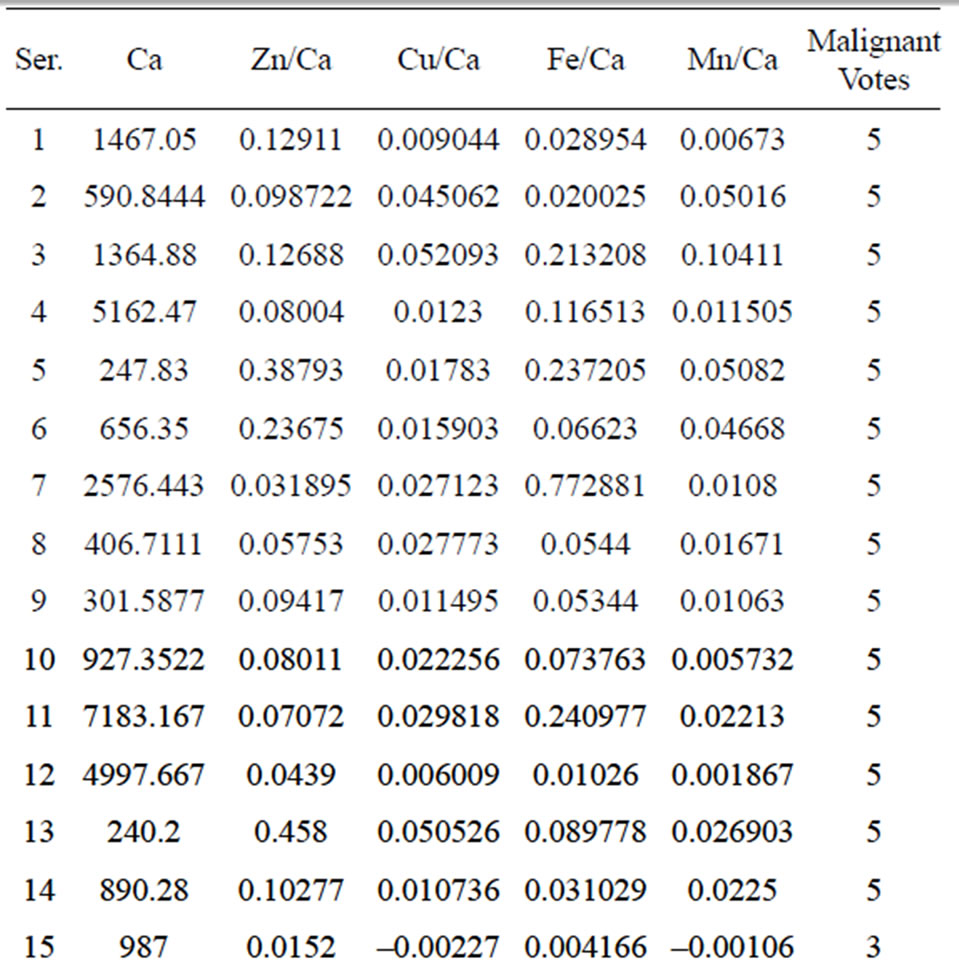
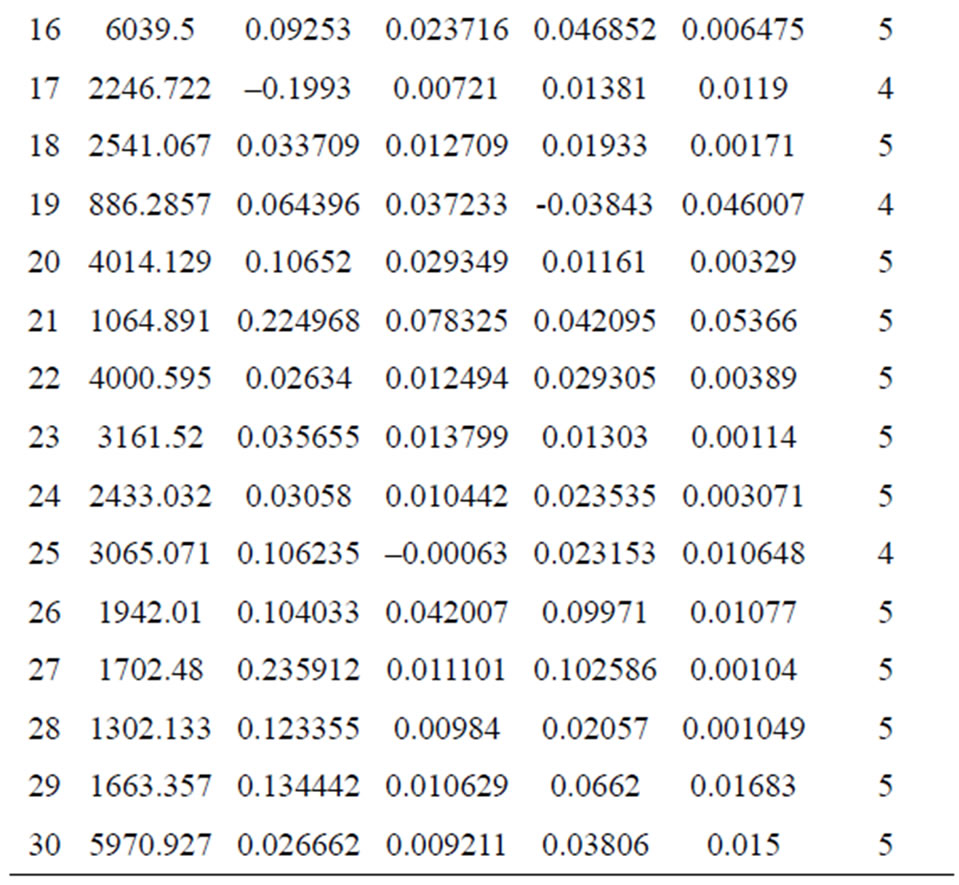
Table 1. Differences between malignant and normal samples.
an almost 100% decision factor was achieved for all samples except for the cases in which the cancer grades were Stage I (where a 50% decision factor was still achieved). Table 2 presents the decision factors using the voting algorithm. The results show that only four patients out of the total sample of 30 have erroneous trace elements and that this does not affect the overall decision. Hence, the performance of LIPS can be measured as 87%, while retaining 100% accuracy.
The LIPS technique is used to distinguish normal and malignant tumor cells from histological sections by measuring the concentrations of trace elements in real time. Previous studies have observed that the concentration of trace
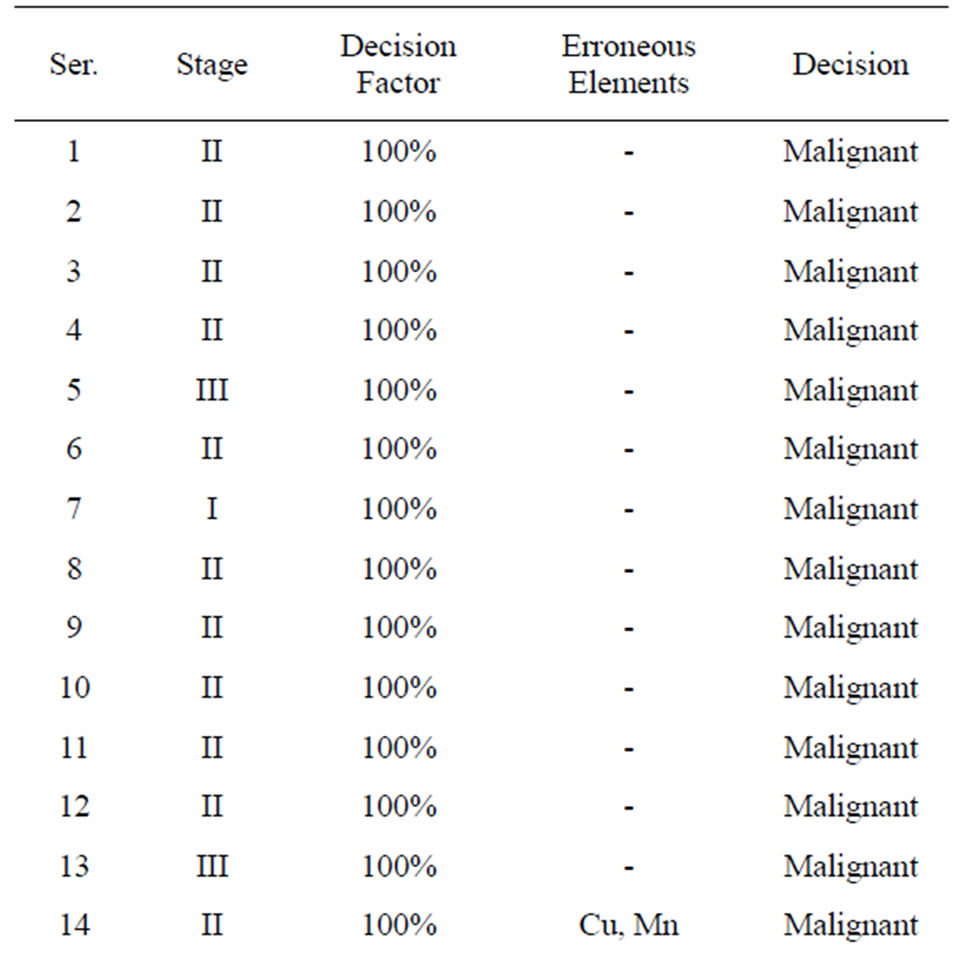
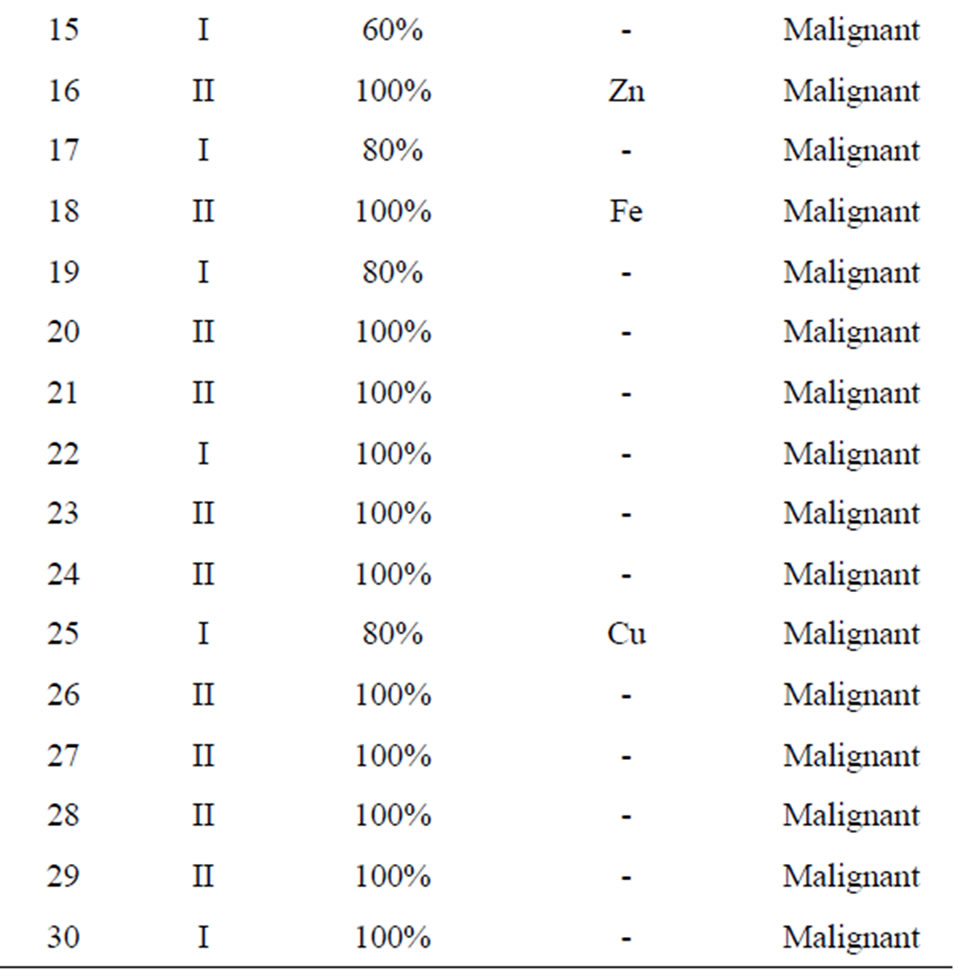
Table 2. Decision factor using the voting algorithm.
elements such as Zn, Cu, Fe, Mn, and Ca in normal and malignant cells vary significantly. For example, the concentration of calcium, iron, and zinc is larger in malignant cells in comparison with normal cells. The present study showed that the trace elements copper, iron, manganese, zinc, and calcium were all significantly higher in cancerous tissues than they were in their normal counterparts. However, the relevance of such elevated concentrations of these elements in breast cancer tissue remains a matter of conjecture.
Evidence has suggested a relation between cellular activity/blood supply and the formation of micro calcifications in malignant breast tissues. It would seem reasonable, therefore, to assume that these elements might influence the carcinogenic process in malignant breast tissues. The present data raise the possibility that relatively high levels of copper, iron, zinc, manganese, and calcium in benign breast tissue may be associated with a modest increase in the risk of subsequent breast cancer. The results described herein indicated that a relatively high concentration of iron in benign breast tissue was positively associated with a subsequent breast cancer risk.
However, because we were unable to separate our measure of iron levels into free iron and iron in conjugation with enzymes, we could not differentiate between two possible explanations for this finding. The first explanation is that high levels of free iron in benign breast tissue might increase breast cancer risk because of the catalytic effect of iron in mutagenic radicals and the suppressant effect on the host’s immune function. The second explanation is that both benign breast tissue and breast cancer cells might demand high levels of iron in order to sustain their power of proliferation given that iron is required for ribonucleotide reductase, a key enzyme in DNA synthesis [6,13].
The LIPS technique is a promising technology because of its simplicity, low degree of sample preparation, and low possibility of contamination. It is also minimally invasive, since a small-sized sample can generate good results. Further, because data are easily interpretable, skilled analysts are not required, while the necessary instruments are rugged and portable. This technique is similar to discharge/arc emission spectroscopy, in which elements are excited to a higher energy state by an electric discharge.
Many previous studies have indicated that metal ions can interact with nucleic acids to influence base-pairing and conformation. Such effects have been known to cause somatic mutations, a consequence of base-pairing errors or frame-shift mutations by deletion, leading to cellular transformation. For example, magnesium, manganese, and zinc are cofactors of many enzymes, especially RNA and DNA polymerases [14]. A comparison of trace element levels in normal and neoplastic human breast tissues has shown a relatively consistent and characteristic pattern of elevation for calcium, vanadium, copper, zinc, selenium, and rubidium [15].
4. Conclusions
The presented findings suggest an association between the elemental composition of breast tissues and the formation of breast particles. In other words, increases in the elemental concentrations and clustered calcifications in the breast may be related. Specifically, we can draw the following five conclusions about the LIPS technique:
• A simple and promising technique is capable of diagnosing malignant cells and tissues;
• It minimizes tissue preparation and human effort and error;
• It reduces the possibility of contamination as well as standard errors;
• It is minimally invasive, since a small-sized sample can generate good results;
• It gives online quantification for all trace elements in a tissue simultaneously.
Future work should include enhancing the voting algorithm in order to assess the degrees of deviation of malignant cells from normal cells and thus deduce the cancer grade. The enhancing mechanism could also include the study of building combined techniques that use more complex algorithms that could avail the advantage of LIPS results in confusing and fuzzy cases.
REFERENCES
- B. K. Abraham, C. Justenhoven, B. Pesch, et al., “Investigation of Genetic Variants of Genes of the Hemochromatosis Pathway and Their Role in Breast Cancer,” Cancer Epidemiology Biomarkers and Prevention, Vol. 14, 2005, pp. 1102-1107. doi:10.1158/1055-9965.EPI-05-0013
- B. Shane, A. Kumar, J. P. Singh and F. Y. Yueh, “Characterization of Malignant Tissue Cells by Laser-Induced Breakdown Spectroscopy,” Applied Optics, Vol. 43, No. 28, 2004, pp. 5399-5403. doi:10.1364/AO.43.005399
- Z. Martin, S. Wullschleger, A. Palumbo, O. West, J. Smith, B. Evans, H. O’Neill and J. Woodward, “Applications of Laser Induced Breakdown Spectroscopy to Environmental and Biological Sample Analysis,” Proceedings of 54th Pittsburgh Conference & Exposition on Analytical Chemistry & Applied spectroscopy Pittcon 2003 Spectroscopy Society of Pittsburgh, Orlando, 9-14 March 2003.
- J. Sariego, “Breast Cancer in the Young Patient,” The American Surgeon, Vol. 76, No. 12, 2010, pp. 1397-1401.
- D. Saslow, J. Hannan, J. Osuch, M. H. Alciati, C. Baines, M. Barton, J. K. Bobo, C. Coleman, et al., “Clinical Breast Examination: Practical Recommendations for Optimizing Performance and Reporting,” CA: A Cancer Journal for Clinicians, Vol. 54, No. 6, 2004, pp. 327-344. doi:10.3322/canjclin.54.6.327
- Y. H. Yu, C. Liang and X. Z. Yuan, “Diagnostic Value of Vacuum-Assisted Breast Biopsy for Breast Carcinoma: A Meta-Analysis and Systematic Review,” Breast Cancer Research and Treatment, Vol. 120, No. 2, 2010, pp. 469- 479. doi:10.1007/s10549-010-0750-1
- Merck Manual, “Professional Edition, Section; Gynecology and Obstetrics, Ch. 253, Breast Cancer,” Merck Sharp & Dohme Corp., Whitehouse Station, 2010.
- E. A. Ryan, M. J. Farquharson and D. M. Flinton, “The Use of Compton Scattering to Differentiate between Classifications of Normal and Diseased Breast Tissue,” Physics in Medicine and Biology, Vol. 50, No. 14, 2005, pp. 3337-3348. doi:10.1088/0031-9155/50/14/010
- W. B. Lee, J. Y. Wu, Y. I. Lee and J. Sneddon, “Recent Applications of Laser-Induced Breakdown Spectroscopy: A Review of Material Approaches,” Applied Spectroscopy Review, Vol. 39, No. 1, 2004, pp. 27-97. doi:10.1081/ASR-120028868
- J. G. Liehr and J. S. Jones, “Role of Iron in EstrogenInduced Cancer,” Current Medicinal Chemistry, Vol. 8, No. 7, 2001, pp. 839-849.
- W. O. John, “Trace Analysis by Infrared Spectroscopy,” Spectroscopy, Vol. 14, No. 10, 1991, pp. 27-30.
- D. A. Cremers and L. J. Radziemski, “Handbook of LaserInduced Breakdown Spectroscopy,” John Wiley & Sons, Hoboken, 2006. doi:10.1002/0470093013
- D. A. Cremers and L. J. Radziemski, “Handbook of Laserinduced Breakdown Spectroscopy,” John Wiley & Sons, Hoboken, 2007.
- I. B. Weinstein, “Current Concepts in Mechanisms of Clinical Carcinogenesis,” Bulletin of the New York Academy of Medicine, Vol. 54, No. 4, 1978, pp. 366-383.
- S. L. Rizk and H. H. Sky-Peck, “Comparison between Concentrations of Trace Elements in Normal and Neoplastic Human Breast Tissue,” Cancer Research, Vol. 44, No. 11, 1984, pp. 5390-5394.