Paper Menu >>
Journal Menu >>
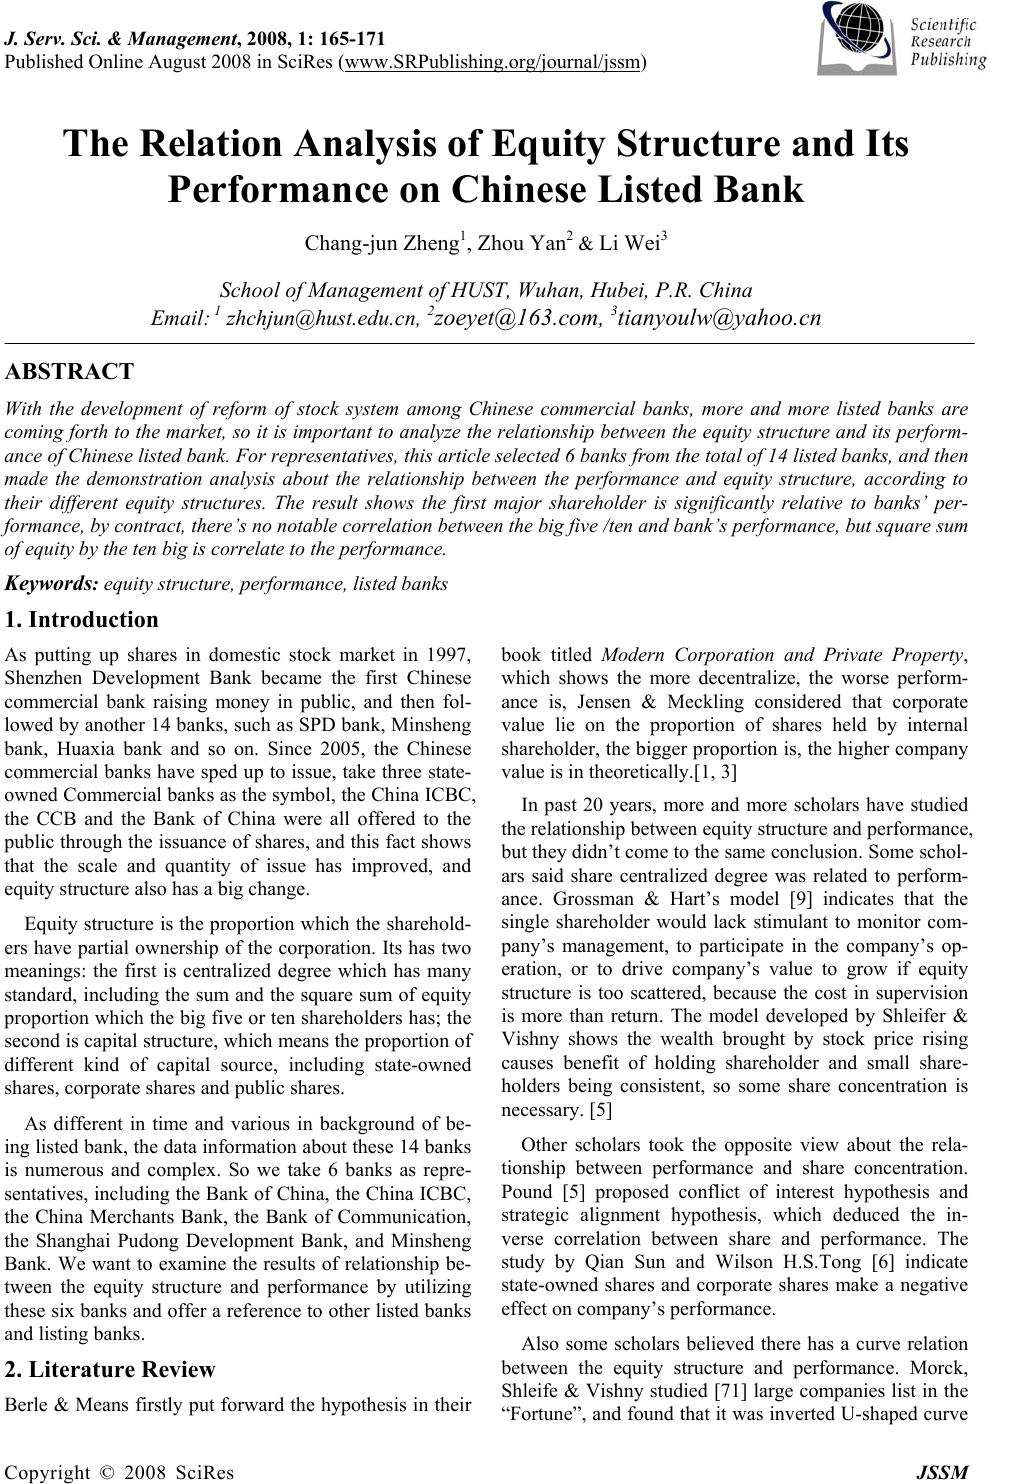 J. Serv. Sci. & Management, 2008, 1: 165-171 Published Online August 2008 in SciRes (www.SRPublishing.org/journal/jssm) Copyright © 2008 SciRes JSSM The Relation Analysis of Equity Structure and Its Performance on Chinese Listed Bank Chang-jun Zheng1, Zhou Yan2 & Li Wei3 School of Management of HUST, Wuhan, Hubei, P.R. China Email: 1 zhchjun@hust.edu.cn, 2zoeyet@163.com, 3tianyoulw@yahoo.cn ABSTRACT With the development of reform of stock system among Chinese commercial banks, more and more listed banks are coming forth to the market, so it is important to analyze the relationship between the equity structure and its perform- ance of Chinese listed bank. For representatives, this article selected 6 banks from the total of 14 listed banks, and then made the demonstration analysis about the relationship between the performance and equity structure, according to their different equity structures. The result shows the first major shareholder is significantly relative to banks’ per- formance, by contract, there’s no notable correlation between the big five /ten and bank’s performance, but square sum of equity by the ten big is correlate to the performance. Keywords: equity structure, performance, listed banks 1. Introduction As putting up shares in domestic stock market in 1997, Shenzhen Development Bank became the first Chinese commercial bank raising money in public, and then fol- lowed by another 14 banks, such as SPD bank, Minsheng bank, Huaxia bank and so on. Since 2005, the Chinese commercial banks have sped up to issue, take three state- owned Commercial banks as the symbol, the China ICBC, the CCB and the Bank of China were all offered to the public through the issuance of shares, and this fact shows that the scale and quantity of issue has improved, and equity structure also has a big change. Equity structure is the proportion which the sharehold- ers have partial ownership of the corporation. Its has two meanings: the first is centralized degree which has many standard, including the sum and the square sum of equity proportion which the big five or ten shareholders has; the second is capital structure, which means the proportion of different kind of capital source, including state-owned shares, corporate shares and public shares. As different in time and various in background of be- ing listed bank, the data information about these 14 banks is numerous and complex. So we take 6 banks as repre- sentatives, including the Bank of Chin a, the China ICBC, the China Merchants Bank, the Bank of Communication, the Shanghai Pudong Development Bank, and Minsheng Bank. We want to examine the results of relationship be- tween the equity structure and performance by utilizing these six banks and offer a reference to other listed banks and listing banks. 2. Literature Review Berle & Means firstly put forward the hypothesis in their book titled Modern Corporation and Private Property, which shows the more decentralize, the worse perform- ance is, Jensen & Meckling considered that corporate value lie on the proportion of shares held by internal shareholder, the bigger proportion is, the higher company value is in theoretically.[1, 3] In past 20 years, more and more scholars have studied the relationship between equity structure and performance, but they didn’t come to the same conclusion. Some schol- ars said share centralized degree was related to perform- ance. Grossman & Hart’s model [9] indicates that the single shareholder would lack stimulant to monitor com- pany’s management, to participate in the company’s op- eration, or to drive company’s value to grow if equity structure is too scattered, because the cost in supervision is more than return. The model developed by Shleifer & Vishny shows the wealth brought by stock price rising causes benefit of holding shareholder and small share- holders being consistent, so some share concentration is necessary. [5] Other scholars took the opposite view about the rela- tionship between performance and share concentration. Pound [5] proposed conflict of interest hypothesis and strategic alignment hypothesis, which deduced the in- verse correlation between share and performance. The study by Qian Sun and Wilson H.S.Tong [6] indicate state-owned shares and corporate shares make a negative effect on company’s performance. Also some scholars believed there has a curve relation between the equity structure and performance. Morck, Shleife & Vishny studied [71] large companies list in the “Fortune”, and found that it was inverted U-shaped curve 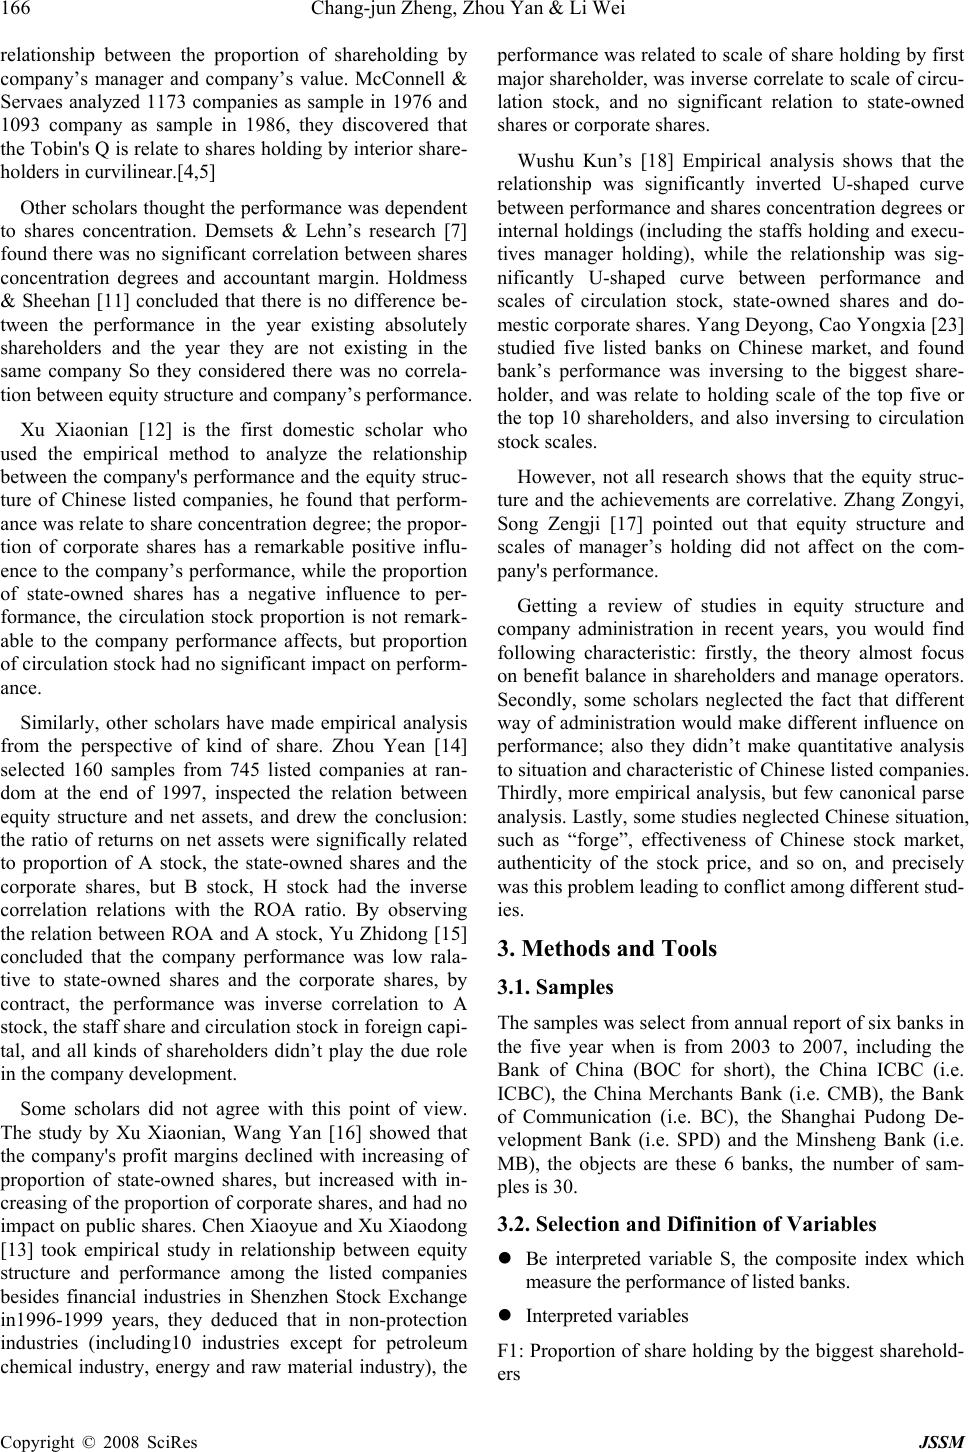 166 Chang-jun Zheng, Zhou Yan & Li Wei Copyright © 2008 SciRes JSSM relationship between the proportion of shareholding by company’s manager and company’s value. McConnell & Servaes analyzed 1173 companies as sample in 1976 and 1093 company as sample in 1986, they discovered that the Tobin's Q is relate to shares holding by interior share- holders in curvilinear.[4,5] Other scholars thought the performance was dependent to shares concentration. Demsets & Lehn’s research [7] found there was no significant correlation between shares concentration degrees and accountant margin. Holdmess & Sheehan [11] concluded that there is no difference be- tween the performance in the year existing absolutely shareholders and the year they are not existing in the same company So they considered there was no correla- tion between equity structure and company’s performance. Xu Xiaonian [12] is the first domestic scholar who used the empirical method to analyze the relationship between the company's performance and the equity struc- ture of Chinese listed companies, he found that perform- ance was relate to share concentration degree; the propor- tion of corporate shares has a remarkable positive influ- ence to the company’s performance, while the proportion of state-owned shares has a negative influence to per- formance, the circulation stock proportion is not remark- able to the company performance affects, but proportion of circulation stock had no significant impact on perform- ance. Similarly, other scholars have made empirical analysis from the perspective of kind of share. Zhou Yean [14] selected 160 samples from 745 listed companies at ran- dom at the end of 1997, inspected the relation between equity structure and net assets, and drew the conclusion: the ratio of returns on net assets were significally related to proportion of A stock, the state-owned shares and the corporate shares, but B stock, H stock had the inverse correlation relations with the ROA ratio. By observing the relation between ROA and A stock, Yu Zhidong [15] concluded that the company performance was low rala- tive to state-owned shares and the corporate shares, by contract, the performance was inverse correlation to A stock, the staff share and circulation stock in foreign capi- tal, and all kinds of shareholders didn’t play the due role in the company development. Some scholars did not agree with this point of view. The study by Xu Xiaonian, Wang Yan [16] showed that the company's profit margins declined with increasing of proportion of state-owned shares, but increased with in- creasing of the proportion of corporate shares, and had no impact on public shares. Chen Xiaoyue and Xu Xiaodong [13] took empirical study in relationship between equity structure and performance among the listed companies besides financial industries in Shenzhen Stock Exchange in1996-1999 years, they deduced that in non-protection industries (including10 industries except for petroleum chemical industry, energy and raw material industry), the performance was related to scale of share holding by first major shareholder, was inverse correlate to scale of circu- lation stock, and no significant relation to state-owned shares or corporate shares. Wushu Kun’s [18] Empirical analysis shows that the relationship was significantly inverted U-shaped curve between performance and shares concentration degrees or internal holdings (including the staffs holding and execu- tives manager holding), while the relationship was sig- nificantly U-shaped curve between performance and scales of circulation stock, state-owned shares and do- mestic corporate shares. Yang Deyong, Cao Yongxia [23] studied five listed banks on Chinese market, and found bank’s performance was inversing to the biggest share- holder, and was relate to holding scale of the top five or the top 10 shareholders, and also inversing to circulation stock scales. However, not all research shows that the equity struc- ture and the achievements are correlative. Zhang Zongyi, Song Zengji [17] pointed out that equity structure and scales of manager’s holding did not affect on the com- pany's performance. Getting a review of studies in equity structure and company administration in recent years, you would find following characteristic: firstly, the theory almost focus on benefit balance in shareholders and manage operators. Secondly, some scholars neglected the fact that different way of administration would make different influence on performance; also they didn’t make quantitative analysis to situation and ch aracteristic o f Chin ese listed co mpanies. Thirdly, more empirical analysis, but few canonical parse analysis. Lastly, some studies neglected Chinese situation, such as “forge”, effectiveness of Chinese stock market, authenticity of the stock price, and so on, and precisely was this problem leading to conflict among different stud- ies. 3. Methods and Tools 3.1. Samples The samples was select from annual report of six banks in the five year when is from 2003 to 2007, including the Bank of China (BOC for short), the China ICBC (i.e. ICBC), the China Merchants Bank (i.e. CMB), the Bank of Communication (i.e. BC), the Shanghai Pudong De- velopment Bank (i.e. SPD) and the Minsheng Bank (i.e. MB), the objects are these 6 banks, the number of sam- ples is 30. 3.2. Selection and Difinition of Variables z Be interpreted variable S, the composite index which measure the perform ance of l i st ed banks. z Interpreted variables F1: Proportion of share holding by the biggest sharehold- ers 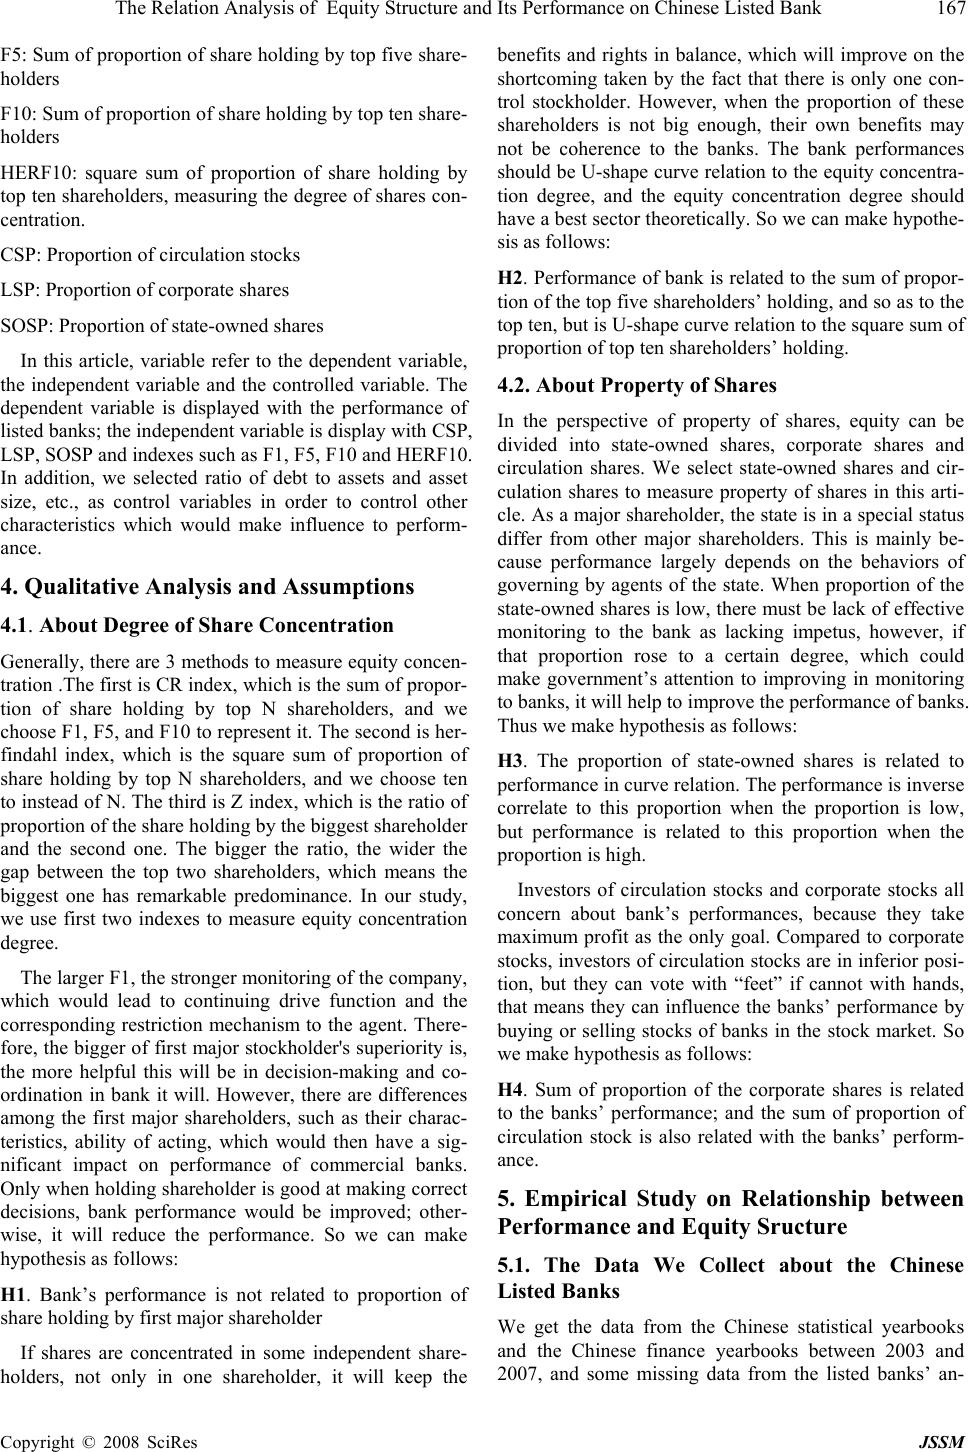 The Relation Analysis of Equity Structure and Its Performance on Chinese Listed Bank 167 Copyright © 2008 SciRes JSSM F5: Sum of proportion of share holding by top five share- holders F10: Sum of proportion of share holding by top ten share- holders HERF10: square sum of proportion of share holding by top ten shareholders, measuring the degree of shares con- centration. CSP: Proportion of circulation stocks LSP: Proportion of corporate shares SOSP: Proportion of state-owned shares In this article, variable refer to the dependent variable, the independent variable and the controlled variable. The dependent variable is displayed with the performance of listed banks; the independent variable is display with CSP, LSP, SOSP and indexes such as F1, F5, F10 and HERF10. In addition, we selected ratio of debt to assets and asset size, etc., as control variables in order to control other characteristics which would make influence to perform- ance. 4. Qualitative Analysis and Assumptions 4.1. About Degree of Share Concentration Generally, there are 3 methods to measure equity concen- tration .The first is CR index, which is the sum of propor- tion of share holding by top N shareholders, and we choose F1, F5, and F10 to represent it. The second is her- findahl index, which is the square sum of proportion of share holding by top N shareholders, and we choose ten to instead of N. The th ird is Z index, which is th e ratio of proportion of the share holding by the biggest shareholder and the second one. The bigger the ratio, the wider the gap between the top two shareholders, which means the biggest one has remarkable predominance. In our study, we use first two indexes to measure equity concentration degree. The larger F1, the stronger monitoring of the company, which would lead to continuing drive function and the corresponding restriction mechanism to the agent. There- fore, the bigger of first major stockholder's superiority is, the more helpful this will be in decision-making and co- ordination in bank it will. However, there are differences among the first major shareholders, such as their charac- teristics, ability of acting, which would then have a sig- nificant impact on performance of commercial banks. Only when holding shareholder is good at making correct decisions, bank performance would be improved; other- wise, it will reduce the performance. So we can make hypothesis as follows: H1. Bank’s performance is not related to proportion of share holding by first major shareholder If shares are concentrated in some independent share- holders, not only in one shareholder, it will keep the benefits and rights in balance, which will improve on the shortcoming taken by the fact that there is only one con- trol stockholder. However, when the proportion of these shareholders is not big enough, their own benefits may not be coherence to the banks. The bank performances should be U-shape curve relation to the equity concentra- tion degree, and the equity concentration degree should have a best sector theoretically. So we can make hypothe- sis as follows: H2. Performance of bank is related to the sum of propor- tion of the top five shareholders’ holding, and so as to the top ten, but is U-shape curve relation to the square sum of proportion of top ten shareholders’ holding. 4.2. About Property of Shares In the perspective of property of shares, equity can be divided into state-owned shares, corporate shares and circulation shares. We select state-owned shares and cir- culation shares to measure property of shares in this arti- cle. As a major shareholder, the state is in a special status differ from other major shareholders. This is mainly be- cause performance largely depends on the behaviors of governing by agents of the state. When proportion of the state-owned shares is low, there must be lack of effective monitoring to the bank as lacking impetus, however, if that proportion rose to a certain degree, which could make government’s attention to improving in monitoring to banks, it will help to improve the performance of banks. Thus we make hypothesis as follows: H3. The proportion of state-owned shares is related to performance in curve relation. The performance is inverse correlate to this proportion when the proportion is low, but performance is related to this proportion when the proportion is high. Investors of circulation stocks and corporate stocks all concern about bank’s performances, because they take maximum profit as the only goal. Compared to corporate stocks, investors of circulation stocks are in inferior posi- tion, but they can vote with “feet” if cannot with hands, that means they can influence the banks’ performance by buying or selling stocks of banks in the stock market. So we make hypothesis as follows: H4. Sum of proportion of the corporate shares is related to the banks’ performance; and the sum of proportion of circulation stock is also related with the banks’ perform- ance. 5. Empirical Study on Relationship between Performance and Equity Sructure 5.1. The Data We Collect about the Chinese Listed Banks We get the data from the Chinese statistical yearbooks and the Chinese finance yearbooks between 2003 and 2007, and some missing data from the listed banks’ an-  168 Chang-jun Zheng, Zhou Yan & Li Wei Copyright © 2008 SciRes JSSM nual reports .(see the table 1). 5.2. The Model of Equity Structure Attributing to Banks’ Performance Theoretical analysis shows that the equity structure will ultimately affect the bank's profitability and performance in the market, but the relationship between them also needs empirical analysis. In order to get the function rela- tion between the equity attributes and the banks’ per- Table1.The banks’ performance index and the variables. S—the composite index which measure the performance of listed banks, we get it by the weighted average between PE and the net assets returns ratio; F1—Proportion of share holding by the biggest shareholders; F5—Sum of proportion of share holding by top five shareholders; F10—Sum of proportion of share holding by top ten shareholders; HERF10—square sum of proportion of share holding by top ten shareholders, measuring the degree of shares concentration; CSP—Proportion of circulation stocks; LSP—Proportion of corporate shares; SOSP—Proportion of state-owned shares S F1 F5 F10 HERF10 CSP(%) LSP(%) SOSP(%) 19.54 35.30 92.80 95.66 2709.32 100.00 0.00 0.00 12.72 35.30 92.60 95.50 2704.13 100.00 0.00 0.00 14.78 0.00 0.00 0.00 0.00 0.00 0.00 0.00 9.50 0.00 0.00 0.00 0.00 0.00 0.00 0.00 7.00 0.00 0.00 0.00 0.00 0.00 0.00 0.00 63.21 17.88 43.23 51.89 547.46 100.00 0.00 0.00 33.94 17.79 43.09 51.75 544.01 100.00 0.00 0.00 26.97 17.78 37.61 47.06 454.86 27.00 63.90 3.70 30.53 17.95 37.98 47.14 462.22 26.30 69.90 3.80 25.61 17.95 37.98 47.03 458.68 26.30 72.00 1.80 28.99 22.02 69.11 72.68 1289.49 100.00 0.00 0.00 21.15 21.78 62.49 65.62 1067.13 50.40 27.90 21.80 16.31 0.00 0.00 0.00 0.00 0.00 0.00 0.00 2.66 0.00 0.00 0.00 0.00 0.00 0.00 0.00 24.48 0.00 0.00 0.00 0.00 0.00 0.00 0.00 17.62 67.49 95.32 97.26 4800.41 100.00 0.00 0.00 13.90 67.49 95.09 97.07 4794.88 100.00 0.00 0.00 12.40 0.00 0.00 0.00 0.00 0.00 0.00 0.00 10.60 0.00 0.00 0.00 0.00 0.00 0.00 0.00 14.55 0.00 0.00 0.00 0.00 0.00 0.00 0.00 72.72 23.57 41.01 47.40 652.20 100.00 0.00 0.00 45.29 23.57 41.37 47.11 653.43 100.00 0.00 0.00 39.76 7.01 26.08 37.32 170.28 27.60 63.30 9.10 31.80 7.01 26.08 37.06 168.50 27.70 62.50 9.80 26.52 6.44 24.80 33.27 140.74 27.70 65.20 7.10 28.19 5.90 25.57 44.35 202.45 100.00 0.00 0.00 25.43 5.98 25.97 42.00 190.26 100.00 0.00 0.00 27.24 5.99 25.98 42.06 190.59 100.00 0.00 0.00 27.40 6.98 29.46 48.40 251.61 30.10 69.90 0.00 26.21 7.40 32.61 53.27 303.54 26.00 74.00 0.00  The Relation Analysis of Equity Structure and Its Performance on Chinese Listed Bank 169 Copyright © 2008 SciRes JSSM Table 2. the regression analysis between the banks’ performance and the equity attribution Coefficients Std. Error t Stat P-value Lower 95% Upper 95% Intercept 12.469 4.37929 2.8473 0.0085 3.467373 21.4709118 CSP(%) 0.1979 0.05791 3.4164 0.0021 0.0788103 0.31689295 LSP(%) 0.1635 0.09333 1.7514 0.0917 -0.028383 0.35528582 SOSP(%) -0.011 0.58503 -0.02 0.9845 -1.214039 1.19104615 Table 3. The regression analysis between the banks’ performance and the equity attribution. A De pe ndent Variable: S model Unstandardized Coefficients Standardized Coeffi- it t Sig. B Std. Error Beta B Std. Error 1 (Constant) 12.469 4.379 2.847 0.008 CSP 0.198 0.058 0.577 3.416 0.637 LSP 0.163 0.093 0.327 1.751 0.984 SOSP -0.011 0.585 -0.004 -0.020 0.276 Table 4. The relation between the banks’ performance and the proportion of CSP. Model Summary and Parameter Esti- mates. Dependent Variable: S; the induced variable is the banks’ performance index S,the independent variable is the pro- portion of CSP. The independe nt variable is proportion of circulation stocks Model Summary Parameter Estimates Equation R Square F df1 df2 Sig Constant b1 Linear .229 8.335 1 28 .007 17.188 .164 Table 5. The relation between the banks’ performance and the concentration ratio of t he equity. A Depende nt Var i able : S model Unstandardized Coefficients Standardized Coefficients t Sig. B Std. Error Beta B Std. Error 1 (Constant) 12.772 3.299 3.871 0.001 F1 2.020 0.457 2.376 4.421 0.000 F5 -.182 0.435 -0.370 -0.418 0.680 F10 0.294 0.341 0.621 0.862 0.397 HERF10 -0.030 0.006 -2.563 -5.31 0.000 formance, we have done the regression analysis by using the tools Excel and SPSS based on the related data of the listed banks. The results which get from Excel are showed in table 2. The results which get from SPSS are showed in Table 3. From the analysis of P-value and the coefficient of sig- nificant level (sig), we get the conclusions: The P-value and the sig about CSP is 0.02 (smaller than 0.05), which means there is a linear relation between the proportion of circulation stocks and the banks’ performance; The re- lated coefficients about LSP and SOSP are bigger than 0.05, which means there is no linear relation between the proportion of corporate shares (the proportion of state- owned shares) and the banks’ performance. In the following we have done specific research about the linear relation between the proportion of circulation stocks and the banks’ performance, assume S=0 b+1 b* CSP+e, we did the linear regression by SPSS, the result is showed in Table 4. By the result we can get S=17.188+0.164CSP+e, that means there is a positive linear relation between the banks’ performance and the proportion of circulation stocks. 5.3. The Model of the Equity Concentrative Degree’s Effect to Banks’ Performance To test the relationship between the equity concentrative degree and banks’ performance we take banks’ perform- ance as the result of the equity concentrative degree, fi- nancial leverage and the company's assets complicated action, as the corporation’s data shows, the explanatory ability and the fitting degree which independent variable to dependent variable is the strongest, the relationship between them is shown below: eHERF10aFaFaFaaS 410352110 +++++= (1)  170 Chang-jun Zheng, Zhou Yan & Li Wei Copyright © 2008 SciRes JSSM Figure 1. Fitting char t of r e al S and pr edict S used by F1 Figure 2. Fitting char t of r e al S and pr e dict S used by HERF10 In which the variable S is the banks’ performance, measured by earnings per share and net assets yield, a0 is a virtual variable delegates the intercept, F1 is the stock proportions that the first major shareholder holds, F5 is the stock proportions that the top five shareholders hold, F10 is the stock proportions that the top ten shareholders hold, HERF10 is the square sum of the top ten sharehold- ers’ proportions. Regression results are as follows: The results: coefficient of significant level (sig) o f pro- portion of shareholding by the biggest shareholders (F1) is 0.000, far less than 0.05, and the same to the square sum of proportion of share holding by top ten sharehold- ers (HERF10) , which explains proportion of sharehold- ing by the biggest shareholders (F1) and the square sum of proportion of share holding by top ten shareholders (HERF10) can interpret the variables S significantly. But coefficient of significant level (sig) of Sum of proportion of share holding by top five shareholders (F5) and pro- portion of share holding by top ten shareholders (F10) are far more than 0.05, which means F5 and F10 is not suit- able for interpreting the v ariables S. Actually, from the picture drew by SPSS, we can find the performance (S) predicted by F1 and HERF10 is highest fitting to real performance, which means a sig- nificant interpreting to the variables S. pictures drew by SPSS are as follows: 6. Conclusions and Suggestions In summary, through the qualitative analysis and the em- pirical research of listed banks in China, we obtain some conclusions below: First, choose the net asset yield and per share yield, we have constructed an Index S to reflect the particularity of banks’ performance. However, because it is difficult to acquire relevant data, the construction of the index is not perfect; it is just an idea of reference, to make the indica- tors used to measure the banks’ performance more rea- sonable. Second, between the proportions of the first major shareholders in commercial bank and the performance of banks there is a significant correlation. As we have de- scribed in the qualitative analysis, the largest shareholder of governance will have a direct effect on performance of the bank, and to strengthen the shareholding ratio of the top five and the top 10 shareholders, forming a certain degree of control over checks and balances will help im- prove the listed Banks operating performance. Third, the "multiple checks and balances" is a better equity structure. Decentralization and lower the largest shareholder’s equity proportions can avoid the major shareholder controlling the bank effectively, and improv- ing the structure of the bank's corporate management. Fourth, changing the constitute of the circulation share that the shareholders hold, introducing a treatment capac- ity of institutional investors, one hand it is helpful of in- troducing and making use of foreign capital, the other hand it is helpful of introducing the advanced experience of foreign country. It is better for our country to optimize the combination of capital ,and to drive the fund flow to HERF10 Line Fit Plot 0.00 50.00 100.00 0.00 2000.00 4000.00 6000.00 HERF10 S S predict S F1 Line Fit Plot 0.00 50.00 100.00 0.00 20.00 40.00 60.00 80.00 F1 S 9 predict S  The Relation Analysis of Equity Structure and Its Performance on Chinese Listed Bank 171 Copyright © 2008 SciRes JSSM the shareholders more reasonable, to improve the unsuit- able structure of equity , further to improve corporate governance structure of China's listed companies and also it is helpful to enhance China's listed banks operating performance. In conclusion because the banks in China is special, and in some state-owned commercial banks, the special performance is even more obvious, the interest rate is still controlled by the government, information disclosure is not entirely, but because the stock market is a bull market in 2007, Listed bank's annual report data generally higher, so the data’s reliability remains to be improved. It can be said that the relationship between shareholding structure and listed banks’ performance cannot be fully reflected from data of the listed banks’ e annual report, but we can get some e enlightenments from this research, as a refer- ence for the just listed and the forthcoming listed com- mercial banks in China. REFERENCES [1] Berle & Means, Modern, “Corporation and Private Property”, The Macmillan Company, 1944, pp.69-70. [2] Fama, E. &Jensen, M., “Seperation of ownership and control”,Journal of Law and Economy, Vo1.26, 1983 pp.301-325. [3] Jensen, M.C.and Meckling, W.H."Theory of the Firm: Managerial Behavior, Agency Costs and Ownership Structure”, Journal of Financial Economics, vol.3, 1976, pp. 305-360. [4] McConnell and Servaes, “Additional Evidence on Equity Ownership and Corporate Value”, Journal of Financial Economics, Vol.27, 1990, pp.596-612. [5] John Pound; Richard J Zeckhauser 1988: “The market for corporate control :the economics of corporate takeovers and the New Zealand takeover code : an analysis and proposals for reform ” [Auckland, N.Z.] : New Zealand Centre for Independent Studies. [6] Qian Sun and Wilson H. S. Tong,“China share issue privatization: the extent of its success”,Journal of Financial Economics, Volume 70, Issue 2, Nov., 2003, pp.183-222. [7] Demsetz and Lehn, “The Structure of Ownership : Causes and Consequences”, Journal of Political Economy , Vol.93, 1985, pp.11155-11771. [8] Morck, Shleifer and Vishny ,“Management Ownership and Market Valuation: An Empirical Analysis”, Journal of Financial Economics,Vol.20, 1988, pp.293-315. [9] Sanford J Grossman; Oliver D Hart; Hayne E Leland 1980: “Corporate financial structure and managerial incentives, Cambridge, Mass. : National Bureau of Economic Research,”. [10] Thomsen, Steen, “Ownership structure and economic performance in the largest European companies” Strategic Management Journal, vol.21, no.6, 2000, pp.689-705. [11] Holdemess, C. and Sheehan, D., "The Role of Majority Shareholders in Publicly Held Corporations", Journal of Financial Economics, 1988, pp.20. [12] Xu Xiaonian 1997: “Building a company governance mechanism and capital market on the base of corporation structure”, reform ,vol 5, 1997. [13] Chen xiaoyue, Xu xiaodong, “equity structure, corporate performance and protection of investors’ interests” Economic Research, no.11, 2001. [14] Zhou Ye an 1999: “The empirical research on influence of financial repression to enterprise financing ability ” Economic Research Journal, issue 2, 1999. [15] Yu Zhidong 2002: “The corporate governance of listed company in a changing economic environment” publishing house of Renmin University of China, 2002. [16] Xu Xiaonian, Wang Yan, 2000: “The Structure of Ownership and corporate governance on Chinese listed company”, publishing house of Renmin University of China. [17] Zhang zongyi, Song zengji, “Empirical Study in equity structure and corporate performance of listed companies”, Quantity economical technical economy research, no.1, 2003. [18] Wu Shu-kun 2002: “Ownership structure and firm performance: an empirical research on Chinese public companies”, China Industrial Economy, issue 1, 2002. [19] Xu xiaodong, Chen xiaoyue, “analysis of the first major shareholders’ impact on corporate governance and performance”, Economic Research, no.2, 2003. [20] Bai chongen, etc. Empirical Study in governance structure of Chinese listed companies Economic Research, no.2, 2005. [21] Li hanjun, Zhang junxi, 2006, “The endogenetic degree of Listed corporate governance and performance.” , Management World, no.5. [22] Xu liping, etc. “Equity Concentration & Multi-shares Balance and impact in corporate performance”, Economic Research, no.1, 2006. [23] Yang deyong, Cao yongxia, “Empirical Study of equity structure and performance about Chinese listed banks”, Financial Research, no5, 2007. [24] Li hanjun, Zhang junxi, “The endogenetic degree of Listed corporate governance and performance.” , Management World, no5, 2006. |