Journal of Water Resource and Protection
Vol.5 No.1(2013), Article ID:27114,9 pages DOI:10.4236/jwarp.2013.51010
Bioadsorption of Cd (II) from Contaminated Water on Treated Sawdust: Adsorption Mechanism and Optimization
1Faculty of Science and Arts at Shaqra, Shaqra University, Shaqra, KSA
2National Research Centre, Textile Research Division, Cairo, Egypt
3Department of Chemistry, Faculty of Science, Sebha University, Sebha, Libya
4Department of Basic Sciences, Faculty of Engineering in Benha, Benha University, Benha, Egypt
5Department of Computer Science, Community College, Tabuk University, Tabuk, KSA
Email: *alihashem2000@yahoo.com
Received October 30, 2012; revised December 1, 2012; accepted December 10, 2012
Keywords: Sawdust; Methylolation; Adsorption Isotherm; Cd (II) Ion Removal
ABSTRACT
Sawdust (SD) a very low cost material has been utilized as adsorbent material for the removal of Cd (II) from aqueous solutions after treatment with mono methylol urea (MMU) in the presence of zinc chloride as a catalyst to form MMU-SD. The reaction of MMU-SD was carried out under different conditions including MMU/SD molar ratio, catalyst concentration, and reaction time and temperature. Adsorption studies have been carried out to determine the effect of agitation time, pH, adsorbent and adsorbate concentrations on the adsorption capacity of Cd (II) ions onto MMU-SD. Langmuir, Freundlich and Redlich-Peterson isotherm models were applied in the adsorption studies. The experimental data were analyzed using various sorption kinetic models. The removal processes of Cd (II) onto MMU-SD particles could be well described by the pseudo-second order model. The maximum adsorption capacity of Cd (II) onto MMUSD was 909 mg/g. Similarly, the Freundlich constant 1/n value was 0.45.
1. Introduction
The removal of toxic and polluting metal ions from industrial effluents, water supplies, as well as mine water is an important challenge to avoid one of the major causes of water and soil pollution. Cadmium is attracting wide attention of environmentalist as one of the most toxic heavy metals. Ionic cadmium, an exceedingly toxic metal, is released into the environment by wastewater from electroplating, pigments, plastic, battery and zinc refining industries [1,2]. Cadmium accumulates readily in living systems [3]. In humans it has been implicated as the cause of rental disturbances, lung insufficiency, bone lesions, cancer and hypertension [4]. Various methods [5] are proposed to remove heavy metal ions from industrial effluents using ion exchange, reverse osmosis and electro dialysis technique, which are efficient but expensive. Chemical precipitation can be envisaged, but the generation of precipitated bulky hydroxides and colloidal particles is often a major disadvantage. Adsorption provides one of the most effective methods for removing heavy metal ions from aqueous solution [6]. Activated carbon is a very efficient solid sorbent in many different applications.
However, it is expensive and the need for an alternative low-cost sorbent has encouraged the search for new sorption processes. Lignocellulosic materials have been used in order to obtain a cheaper adsorbent. Agricultural byproducts [7-11] have received attention for these types of applications. Some chemical modifications can improve the adsorbent behavior of these materials. Thus, modification reactions, including cross-linking, etherification, esterification and graft copolymerization, have been attempted as a means of enhancing the stability of the adsorbent and increasing its adsorption capacity. The previous work focused on preparation and application of MMTU-sawdust in water treatment [10]. The present work aims at improving the ability of sawdust for removal of Cd (II) ions from aqueous solutions. To achieve the goal, the work comprises the following studies: 1) Preparation of MMU; 2) Treatment of SD with MMU at high temperature to form MMU-SD; 3) Ability of the MMU-SD to adsorb Cd (II) from aqueous solutions and to what extent the experimental data obey some of adsorption theories; 4) a study of the adsorption kinetics of Cd (II) ions onto MMU-SD in order to establish the adsorption mechanism; 5) fitting the experimental data to the Freundlich, Langmuir and Redlich-Peterson isotherm models to determine the best-fit isotherm model; and 7) comparison of different error functions in minimizing the error distribution between the experimental and predicted isotherms.
2. Experimental
2.1. Materials
Adsorbent: Sawdust (SD) was kindly supplied from ElEkhlas Company for Wood Manufacturing Company, Sebha, Libya, and passed through 150 - 200 µm and used directly without any treatment. The adsorbent was characterized by FT-IR spectroscopy and by estimation of its nitrogen content.
Reagents: Urea, formaldehyde, triethanolamine, zinc chloride, cadmium acetate, EDTA, sodium carbonate, nitric acid and ethanol were of pure analytical grade and supplied by Merck Company, Germany.
2.2. Methods
2.2.1. Preparation of Mono Methylol Urea (MMU)
The MMU was prepared by mixing urea with formaldehyde using the ratios 1:1.1 (urea: formaldehyde) as follows

MMU (1)
The pH was adjusted to pH 9 using triethanolamine, and the mixture was kept at room temperature for 24 h.
2.2.2. Preparation of MMU-SD
Sawdust (4 g) was added to different amounts of MMU and zinc chloride and mixed well for 10 min using a mechanical stirrer. The mixture was kept in an electric oven at 150˚C for 2 h. The reaction product was Soxhlet extracted for 12 h using a 80:20 mixture of EtOH and water. The crude material was then dried and analyzed for nitrogen content.
2.2.3. Adsorption Studies
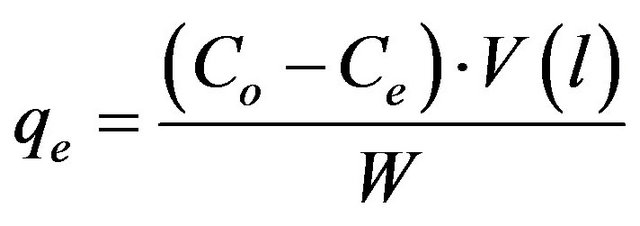
The adsorbate solutions of 100 - 1000 mg/l were prepared by dissolving certain weights of cadmium acetate in certain volumes of distill water. Different pH values of the solutions were used, ranging from (2 - 6) and were adjusted with nitric acid or sodium carbonate solutions. Batch experiments were carried out by adding 100 ml of metal ion solution to 0.05 g of the adsorbent and the whole flasks were shaken at 30˚C in a thermostatic waterbath at 150 rpm for 2 h. At the end of agitation time, the metal ion solutions were separated by filtration. The blank experiments were simultaneously carried out without the adsorbent. The extent of metal ion adsorption onto adsorbent was calculated mathematically by measuring the metal ion concentration before and after the adsorption through direct titration against the standard EDTA solution. The amount of Cd (II) adsorbed on MMU-SD at equilibrium, qe (mg/g) and percent removal of cadmium were calculated according to the following equations:
 (2)
(2)
 (3)
(3)
where Co and Ce are the initial and final concentrations of metal ion, mg/l. V is the volume of metal ion (l), W is the weight of MMU-SD (g).
2.2.4. Determination of Nitrogen Content (%)
The nitrogen content of MMU-SD was determined using the micro-Kjeldahl method [12].
2.2.5. Error Analysis
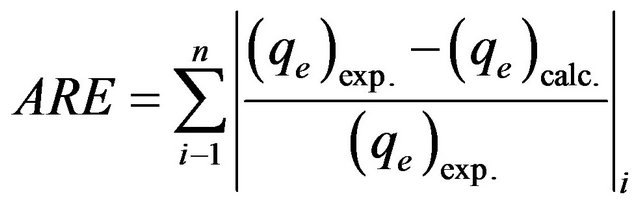
In the single-component isotherm studies, the optimization procedure requires an error function to be defined to evaluate the fit of the isotherm to the experimental equilibrium data. The common error functions for determineing the optimum isotherm parameters were, average relative error (ARE), the sum of the squares of the errors (ERRSQ), hybrid fractional error function (HYBRID), Marquardt’s percent standard deviation (MPSD) and sum of absolute errors (EABS) [13]. In the present study, the average relative error (ARE) was used to determine the best fit in isotherm model as:
 (4)
(4)
3. Results and Discussion
MMU-SD was prepared by reacting SD with MMU. Different factors affecting this reaction were studied. These factors include, MMU:SD molar ratio, catalyst concentration and curing time and temperature.
The MMU reacts with the cellulose SD at high temperature in the presence of catalyst catalyst according to Equation (5):
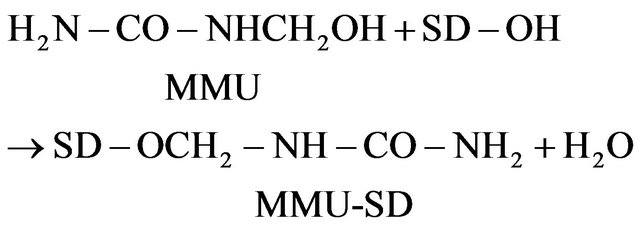 (5)
(5)
3.1. Factors Affecting Modification of SD
3.1.1. Effect of Resin (MMU):SD Molar Ratio
The dependence of the degree of modification of SD, expressed as percent nitrogen on MMU:SD molar ratio was shown in Figure 1. SD was reacted with MMU using different MMU:SD molar ratios (0.5 - 5.0) in the presence of zinc chloride at 150˚C for 2 h. The data in Figure 1 show that the percent nitrogen of the MMU-SD depends on MMU:SD molar ratio. The nitrogen percent increases from 1.83 to 7.96 by increasing the molar ratio from 0.5 - 4.0 and then remained at approximately the same level for higher MMU:SD ratios. The increase in the nitrogen % by increasing MMU:SD molar ratio shows the favorable effect of resin on the modification reaction of SD within this range.
3.1.2. Effect of Catalyst Concentration
Figure 2 shows the effect of catalyst concentration on the nitrogen percent of MMU-SD. Sawdust was reacted with MMU at 150˚C for 2 h using different zinc chloride concentrations (0 - 4.41 mmole/l). The data show that the nitrogen content of prepared samples increases with increasing catalyst concentration to reach a maximum value and decreases on using higher catalyst concentration.
This maximum nitrogen occurs upon using 2.94 mmole/l. This can be explained on the basis of the liberated acidity, i.e., on using zinc chloride up to 2.94 mmole/l. The acidity thus generated is quite enough to catalyze the reaction between SD and MMU, while using higher concentrations of catalyst produces higher amounts of acidity that favor the hydrolytic reaction, which leads to lower nitrogen content.
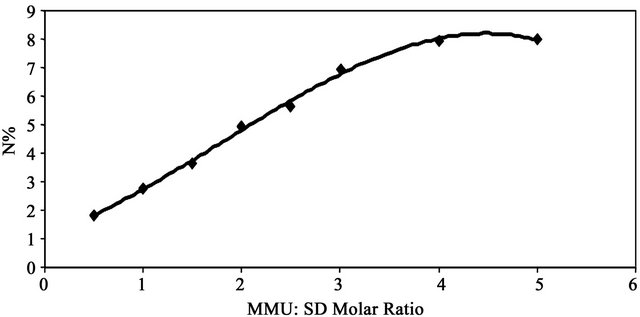
Figure 1. Effect of molar ratio on %N of MMU-SD at 150˚C.
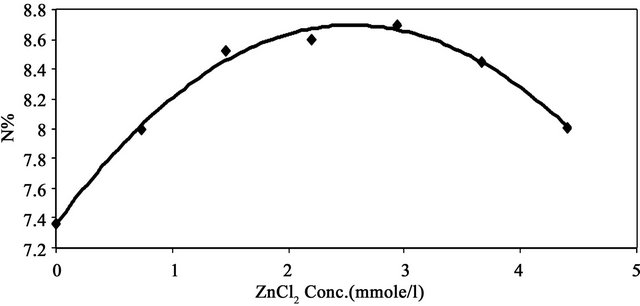
Figure 2. Effect of catalyst concentration on %N of MMUSD at 150˚C.
3.1.3. Effect of Reaction Time
Figure 3 shows the effect of reaction time on the nitrogen percent of MMU-SD. The data show that the percent nitrogen of MMU-SD increases by increasing the reaction time from 15 to 120 min. A further increase in the reaction time led to decrease the nitrogen percent. The enhancement in nitrogen percent during the first stage by increasing the reaction time is a direct consequence of the favorable effect of reaction time on swelling and accessibility of the cellulose component of the SD and mobility of the MMU molecules and their collision with the cellulose hydroxyls. The decrement in the nitrogen % by increasing the reaction time above 120 min could be attributed to the catalytic effect of reaction time above 120 min on the modification reaction.
3.1.4. Effect of Reaction Temperature
Figure 4 shows the effect of reaction temperature on the nitrogen percent of MMU-SD. The data show that the percent nitrogen of MMU-SD increases by increasing the temperature within the range (110˚C - 150˚C). A further increase in the reaction temperature led to decrease the nitrogen percent. The enhancement in nitrogen percent by increasing the temperature in the range (110˚C - 150˚C) is a direct consequence of the favorable effect of temperature on swelling and accessibility of the cellulose component of the SD and mobility of the MMU molecules and their collision with the cellulose hydroxyls. The decrement in the nitrogen % by increasing the temperature above 150˚C could be attributed to the catalytic effect of temperature on the modification reaction.
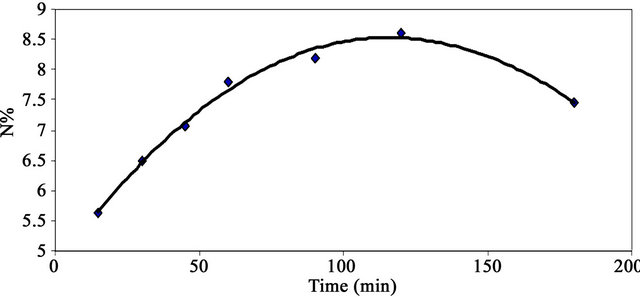
Figure 3. Effect of reaction time on %N of MMU-SD at 150˚C.
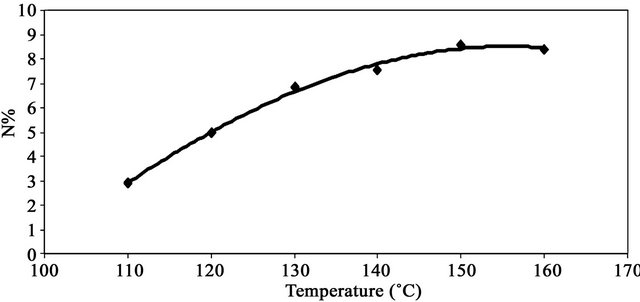
Figure 4. Effect of reaction temperature on %N of MMUSD.
3.2. Factors Affecting Adsorption of Cd (II) onto MMU-SD
3.2.1. Effect of pH
Earlier studies have indicated that the pH of adsorbate is an important parameter affecting adsorption of heavy metals. Figure 5 shows the adsorption capacity of Cd (II) as a function of pH (2 - 6) at fixed adsorbent concentration, fixed agitation time, fixed adsorbate concentration at 30˚C. It is clear from this figure that the adsorption capacity of Cd (II) onto SD-MMU increases from zero to 306.5 mg/g by increasing the pH from 2 to 6. Under highly acidic conditions (pH 2) the adsorption capacity of Cd (II) is the lowest (=zero mg/g) because metal binding sites on the adsorbent were closely associated with H3O+ and restrict the approach of metal cations as a result of the repulsive forces. However, adsorption capacity increased with increasing the pH of solution since the adsorbent surface could be exposed with negative charge with subsequent attraction with positive charge occurring onto the adsorbent surface. At a pH value higher than 6, the adsorption studied could not be carried out due to precipitation of Cd (II) as Cd (OH)2.
3.2.2. Effect of Adsorbent Concentration (Adsorbent Dose)
The effect of adsorbent concentration on the adsorption capacity of cadmium is shown in Figure 5. It is clear from this figure that the adsorption capacity (qe), or the amount of Cd (II) adsorbed per unit mass of adsorbent (mg/g), decreases with increasing the concentration of adsorbent. The decrease in adsorption capacity with increasing the adsorbent concentration is mainly due to overlapping of the adsorption sites as a result of overcrowding of the adsorbent particles and is also due to the competition among Cd (II) ions to the surface sites [7].
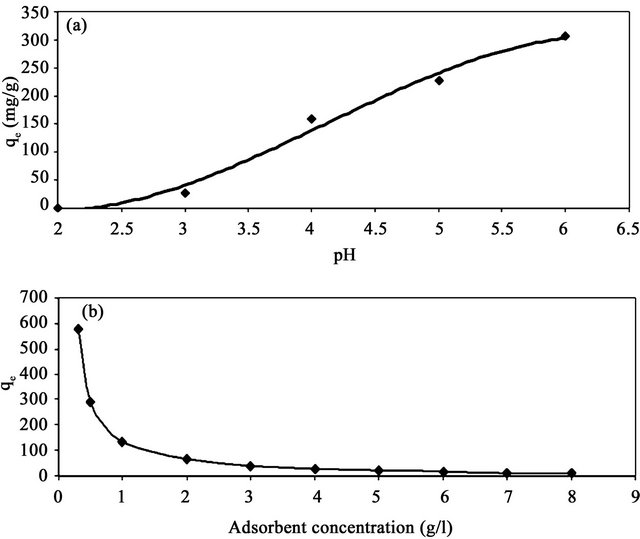
Figure 5. Effect of pH (a) and adsorbent concentration (b) on the adsorption capacities of Cd (II) onto SD-MMU at 30˚C.
3.2.3. Adsorption Isotherm (Effect of Adsorbate Concentration)
In order to optimize the design of an adsorption system to remove heavy metal ions from effluents, it is important to establish the most appropriate correlation for the equilibration curve. Adsorption isotherms are important for the description of how adsorbates will interact with an adsorbent and are critical in optimizing the use of adsorbent. Four mathematical models can be used to describe experimental data of adsorption isotherms, Langmuir, Freundlich and Redlich-Peterson were employed for further interpretation of the obtained adsorption data.
3.2.3.1. Langmuir Isotherm The Langmuir approach is based on the assumption that maximum adsorption corresponds to the formation of a saturated monolayer of adsorbate molecules on the adsorbent surface, that the adsorption energy is constant and there is no transmigration of the adsorbate in the surface plane. The Langmuir model [14] may be represented mathematically as follows:
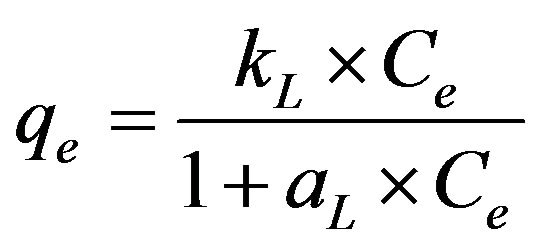 (6)
(6)
where Ce is the equilibrium concentration of Cd (II) ions (mg/l) and qe is the amount of cadmium adsorbed (mg/g), while the constants kL and aL are the Langmuir constant (l/g) and Langmuir isotherm constant (l/mg), respectively. It is possible to represent Equation (6) in a linearized form as shown in Equation (7):
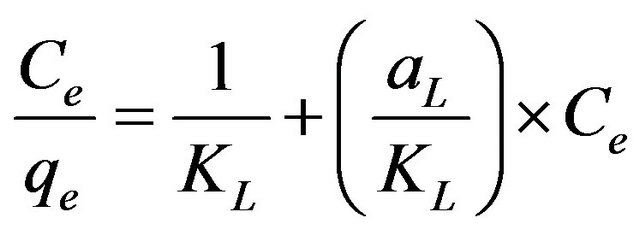 . (7)
. (7)
This equation predicts that a plot of  versus Ce should give a straight line at 30˚C with a slope of
  and an intercept of 1/KL. From the application of the linearized Langmuir model to the experimental data arising from the adsorption of Cd (II) ions onto MMUSD, it was possible to calculate the Langmuir adsorption constants and these are listed in Table 1. The relationship between KL and Qmax is given by the equation:
 (8)
(8)
where b is the Langmuir constant (l/mg) which is related to the energy of adsorption. According to Hall et al. [15], the essential characteristics of the Langmuir isotherm can be expressed in terms of a dimensionless constant separation factor or equilibrium parameter, RL, which is defined by Equation (9):
 (9)
(9)
where C0 is the initial concentration of Cd (II) ions (mg/g) employed. The value of RL obtained at the temperature employed in the present study is listed in Table 1. It is clear from the data listed that the values of RL obtained in the present study lay in the range 0 < RL < 1, thereby indicating that the adsorption of Cd (II) ions onto MMUSD was favorable. The value of the correlation coefficient, R2, which is over 0.99 at 30˚C, indicates that the adsorption of Cd (II) by MMU-SD fits well on the Langmuir isotherm (obeys the Langmuir isotherm).
3.2.3.2. Freundlich Isotherm The Freundlich model [16] has also been applied to the equilibrium data arising from the adsorption of Cd (II) ions onto MMU-SD at 30˚C. This model can be used for non-deal heterogeneous adsorption processes. The Freundlich equation is basically empirical and can be written as:
 (10)
(10)
while this equation, in turn, can be linearized to give:
 (11)
(11)
where qe is the amount of Cd (II) ions adsorbed onto the surface of MMU-SD (mg/g), Ce is the equilibrium concentration of Cd (II) ions (mg/l) and KF is a system constant related to the bonding energy which represents the quantity of Cd (II) ions adsorbed onto the surface of the adsorbent (i.e., the adsorption capacity). The slope of the equation, 1/n, is a measure of the adsorption intensity or surface heterogeneity. The system becomes more heterogeneous as the value of 1/n approaches zero [17], with a value of 1/n < 1 indicating that adsorption is favored in the system. The Freundlich plot derived from the experimental data obtained in the present work for the adsorption of Cd (II) ions onto MMU-SD at 30˚C, while the corresponding values of the Freundlich constants are listed in Table 1. The values of 1/n obtained at 30˚C indicate the favorable adsorption of Cd (II) ions onto MMUSD. The plots of logqe versus logCe were reasonably linear (R2 > 0.98), indicating that the equilibrium data obtained were also well fitted by the Freundlich isotherm.
3.2.3.3. Tempkin Isotherm The Temkin isotherm [18] has been used in the following form:
 (12)
(12)
where R is the universal gas constant (8.31441 J–1·mol–1·K–1), T is the absolute temperature (K), AT is the Temkin isotherm constant (g/mg) and bT is Temkin constant. The sorption data were analyzed according to the linear form of the Temkin isotherm as:
 (13)
(13)
Linear plots of qe vs ln Ce at 30˚C suggest the applicability of adsorption process of Cd (II) onto MMU-SD on Temkin isotherm. The values of AT and bT were evaluated from the intercept and the slope of the plots and their numerical values along with R2 are listed in Table 1. R2 value (Table 1) of Cd (II) by MMU-SD was over 0.99 indicating that the adsorption of Cd (II) ions on MMUSD at 30˚C are fitted well also on Temkin isotherm (obey the Temkin isotherm).
3.2.3.4. Redlich-Peterson Redlich-Peterson isotherm [19] contains three parameters and incorporates the features of the Langmuir and the Freundlich isotherms. It can be described as follows:
 (14)
(14)
where qe is the amount of cadmium adsorbed (mg/g) at equilibrium, Ce (mg/l) is the concentration of adsorbate at equilibrium, A (l/g) and B (l/mg1-1/g) are the Redlich constants and g is the exponent, which lies between 1 and 0. Equation (14) can be converted to a linear form by taking natural logarithms:
 (15)
(15)
The three isotherm constants A, B and g can be evaluated from the linear plot presented by Equation (15) using a trial and error optimization method. A general trial and error procedure which is applicable to computer operation was developed to determine the correlation coefficient, R2, for a series of values of A for the linear regression of ln [(A·Ce/qe) – 1] versus ln Ce at 30˚C to obtain the best values of A which yields a maximum value of R2. R2 value (Table 1) of Cd (II) by MMU-SD was over 0.99 indicating that the adsorption of CD (II) ions on MMU-SD is fitted well also on Redlich-Peterson n isotherm (obey the Redlich-Peterson ).
Table 1. Constants and ARE of different adsorption models for Cd (II) onto MMU-SD at 30˚C.
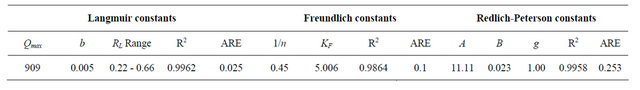
The comparison between the experimental data and the theoretical data obtained from isotherm models of Cd (II) onto MMU-SD are shown in Figure 6 which illustrates that the Langmuir isotherm fitted the experimental data better than other isotherms.
3.2.3.5. Error Analysis The use of R2 is limited to solving linear forms of isotherm equation, which measures the difference between experimental and theoretical data in linearized plots only, but not the errors in non –linear form of isotherm curved. For this reason we use average relative error (ARE) to determine the best fit in isotherm models. For all isotherm models, the value of ARE for adsorption of Cd (II) onto MMU-SD is calculated and presented in Table 1. The most obvious conclusions from these results are that the Langmuir isotherm model has the lowest values for ARE and therefore fits the data better than the rest of isotherm models.
3.2.4. Effect of Contact Time
The effect of contact time on the adsorption capacity of Cd (II) onto MMU-SD was investigated by using the concentration of 286.5 and 493 mg/l at fixed adsorbent concentration and at 30˚C. The amount of Cd (II) adsorbed (mg/g) increases with the increase in contact time and reached the equilibrium after 30 min for the two concentrations. It is clear that the adsorption capacity depends on the concentration of the Cd (II) ions. The adsorption curves (figure not shown) are singles and continuous indicating monolayer coverage of Cd (II) onto the adsorbent surface.
3.2.4.1. Adsorption Kinetic In order to investigate the adsorption processes of Cd(II) on the adsorbent, pseudo-first-order, pseudo-second-order, Bangham’s equation, intra-particle diffusion and Elovich and kinetic models were used.
1) Pseudo-first-order model The pseudo-first-order equation [20] is:
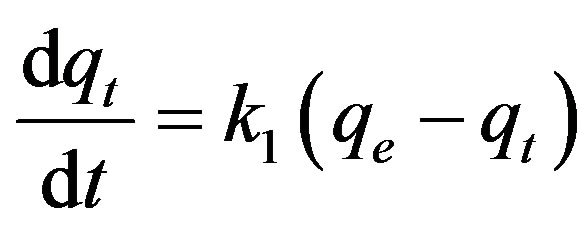 (16)
(16)
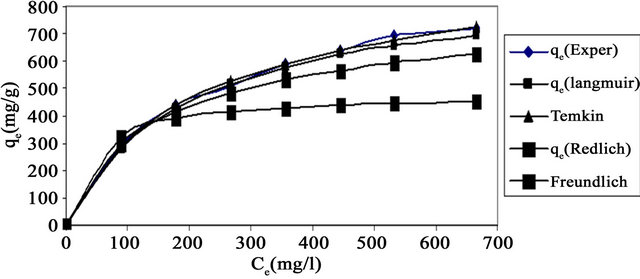
Figure 6. Comparison between different isotherm models of Cd(II) onto MMU-SD at 30˚C.
where qt is the amount of adsorbate adsorbed at time t (mg/g), qe is the adsorption capacity at equilibrium (mg/g), k1 is the pseudo-first-order rate constant (min–1), and t is the contact time (min). The integration of Equation (16) with the initial condition, qt = 0 at t = 0, the following equation is obtained:
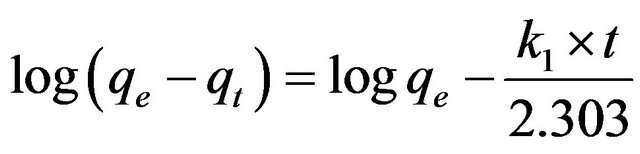 (17)
(17)
In order to obtain the rate constants, the straight line plots of log (qe – qt) against t for Cd (II) onto MMU-SD have been tested. The intercept of this plot should give log qe. However, if the intercept does not equal to the loq qe, the reaction is not likely to be first order even if this plot has a high correlation coefficient (R2) with the experimental data [21]. The plots of log(qe – qt) versus t derived from Equation (17) for initial Cd (II) ion concentrations of 286 and 493 mg/l (figure not shown) had very low correlation coefficient (R2) values. This indicates that the adsorption of Cd (II) onto MMU-SD is not acceptable for this model.
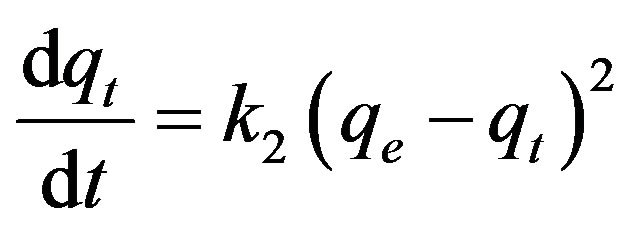 (18)
(18)
where k2 is the pseudo-second-order rate constant (g/mg·min). Integrating Equation (18) with the initial condition, qt = 0 at t = 0, the following equation is obtained:
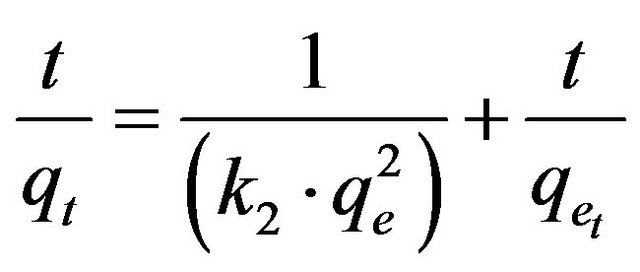 (19)
(19)
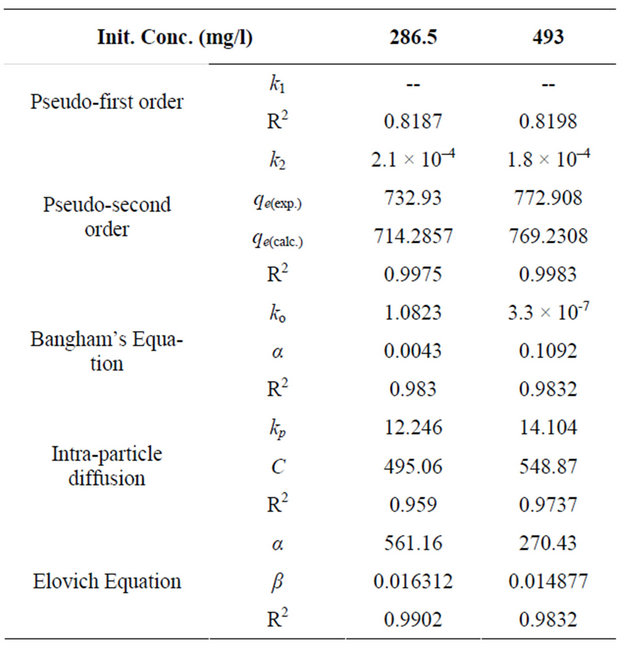
where k2 is the pseudo-second-order adsorption rate constant. This equation predicts that if the system follows the pseudo-second-order kinetics, the plot of t/qe versus t should be linear. Plotting the experimental data obtained for the adsorption Cd (II) ions at initial concentrations of 286.5 and 493 mg/l onto MMU-SD according to the relationship given in Equation (19) gave linear plots with correlation coefficients, R2 over 0.99 for both concentrations of Cd (II) onto MMU-SD (Table 2), thereby indicating the applicability of the pseudo-second-order kinetic equation to the experimental data. The experimental and calculated adsorption capacities for the two CD (II) concentrations as well as the values of k2, and R2 are presented in Table 2. The first-order and pseudo-secondorder models cannot identify the diffusion mechanism and the kinetic results were then subjected to analyze by the intra-particle diffusion model.
2) Bangham’s equation Bangham’s equation [22] was employed for applicability of adsorption of Cd (II) onto MMU-SD, whether the adsorption process is diffusion controlled as:
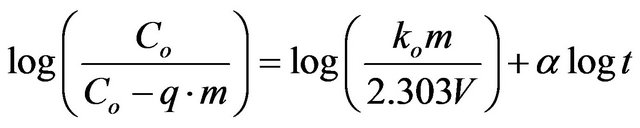 (20)
(20)
where Co is initial concentration of adsorbate (mg/l), V is the volume of solution (ml), m is weight of adsorbent used, q is the amount of adsorbate retained at time t (mg/g),  (
( ) and ko are constants.
The double logarithmic plots, according to Equation (20) yield satisfactory linear curves for the adsorption of Cd (II) by MMU-SD. The correlation coefficient values, R2 (Table 2) for the two concentrations of 286.5 and 493 mg/l onto MMU-SD were 0.983 and 0.9832 for the concentrations of 286.5 and 493 mg/l, respectively. This indicates that the adsorption of Cd (II) onto MMU-SD is acceptable for this model and shows that the diffusion of adsorbate into the pores of the adsorbent was the ratecontrolling step 22.
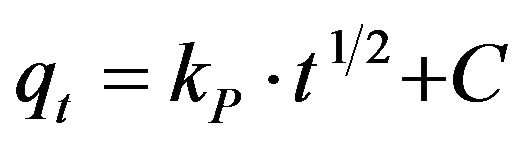 (21)
(21)
where kp is the intra-particle diffusion rate constant (mg·g–1·min–1/2) and qt is the amount of solute adsorbed per unit mass of adsorbent. The data of qt against time t at the initial concentrations of 286.5 and 493 mg/l of Cd (II) were further processed for testing the rate of diffusion in the adsorption process. The adsorption process incorporates the transport of adsorbate from the bulk solution to the interior surface of the pores in MMU-SD. The rate parameter for intra-particle diffusion, kp for the two concentrations of CD (II) are measured according to Equation (21). The plots for two concentrations of metal ions have the same features, the initial portion (curved) followed by linear portion and plateau (fig not shown). The initial curved portion is attributed to the bulk diffusion and the linear portion to the intra-particle diffusion, while the plateau corresponding to equilibrium. The deviation of straight lines from the origin (figure not shown) may be because of the difference between the rate of mass transfer in the initial and final stages of adsorption. Further, such deviation of straight line from the origin indicates that the pore diffusion is not the rate-controlling step [23]. The values of kp (mg·g–1·min–1) obtained from the slope of the straight lines are listed in Table 2. The values of R2 for the two plots are listed also in Table 2. The values of intercept, C (Table 2) give an idea about the boundary layer thickness, i.e., the larger the intercept, is the greater the boundary layer effect [24]. These values indicate that the adsorption of Cd (II) onto MMU-SD may follow the intra-particle diffusion mechanism.
3) Elovich Equation The Elovich model equation is generally expressed as [25]:
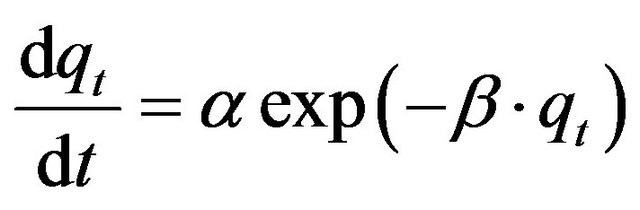 (22)
(22)
where  is the initial adsorption rate (mg/g·min) and
  is the adsorption constant (g/mg) during the experiment.
Table 2. Kinetic parameters for adsorption of Cd (II) onto MMU-SD at 30˚C.
To simplify the Elovich equation, Chien and Clayton [24] assumed  and by applying the boundary conditions q = 0 at t = 0 and qt = qt at t = t, Equation (22) becomes:
 (22)
(22)
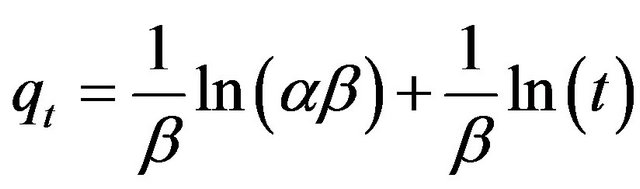
If the Cd (II) adsorption onto MMU-SD fits the Elovih model, a plot of qe versus ln t should yield a linear relationship with a slope of  and an intercept of
 . The slopes and intercepts of plots (Figure not shown) of qt versus ln t were used to determine the constant
  and the initial adsorption rate
 . The correlation coefficients, R2 for the two plots are listed in Table 2. The correlation coefficients for the Elovich kinetic model obtained at the Cd (II) concentrations of 286.5 and 493 mg/l were over 0.98. This indicates that the adsorption of Cd (II) onto MMU-SD is acceptable for this model.
3.3. Adsorption Mechanism
The MMU-SD can be considered to be microporous biopolymer; therefore, pores are large enough to let Cd (II) ions through. The mechanism of Cd (II) adsorption on porous adsorbents may involve four steps: 1) diffusion of ions to the external surface of the adsorbent; 2) diffusion of ions into the pores of the adsorbent; 3) adsorption of the ion on the internal surface of the adsorbent; 4) chelation between the electrondonating nature of Oand Ncontaining groups in the MMU-SD and electron-accepting nature in Cd (II) as shown in Figure 7.
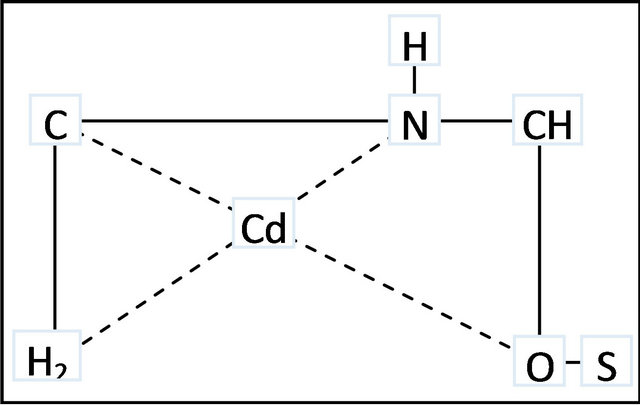
Figure 7. Schematic representation of proposed complex structure between MMU-SD and Cd (II) ions.
3.4. Conclusion
Sawdust (SD), a very low-cost material was modified by treatment with urea in the presence of ZnCl2 as catalyst at elevated temperatures to MMTU-SD. Factors affecting the modification of the SD were investigated. These were MMU:SD molar ratio, catalyst concentration, and reaction time and temperature. The MMU-SD samples thus prepared were characterized by the estimation of their nitrogen content. Utilization of MMU-SD for the removal of Cd (II) ions from aqueous solution was examined. Adsorption studies have been carried out to determine the effect of agitation time, pH, adsorbent concentration, and adsorbate concentration on the adsorption capacity of Cd (II) ions onto MMU-SD. Langmuir, Freundlich and Redlich-Peterson models were applied in the adsorption studies. The maximum adsorption capacity, Qmax of the MMU-SD towards Cd (II) ions was found to be 909 mg/g at 30˚C. Similarly, the Freundlich constant, 1/n was found to be 0.45 at 30˚C.
REFERENCES
- Z. R. Holan, B. Volesky and I. Prasetyo, “Bio-Sorption of Cadmium by Biomass of Marine Algae,” Biotechnology and Bioengineering, Vol. 41, No. 8, 1993, pp. 819-825. doi:10.1002/bit.260410808
- K. H. Chong and B. Volesky, “Description of Two Metal Biosorption Equilibria by Langmuir-Type Models,” Biotechnology and Bioengineering, Vol. 47, No. 4, 1995, pp. 451-460. doi:10.1002/bit.260470406
- Y. C. Sharma, “Economic Treatment of Cd (II)-Rich Hazardous Waste by Indigenous Material,” Journal of Applied Interface Science, Vol. 173, No. 1, 1995, pp. 66-70. doi:10.1006/jcis.1995.1297
- B. Volesky and I. Prasetyo, “Cadmium Removal in Biosorption Column,” Biotechnology and Bioengineering, Vol. 43, No. 11, 1994, pp. 1010-1015. doi:10.1002/bit.260431103
- J. Barcicki, L. Pawlowski, A. Cichcki and L. Zagulski, “Physicochemical Methods for Water and Wastewater Treatment,” Pergamon, London, 1980, pp. 237-400.
- M. M. Nassar and M. S. El-Geundi, “Comparative Cost of Color Removal from Textile Effluents Using Natural Adsorbents,” Journal of Chemical Technology and Biotechnology, Vol. 50, No. 2, 1991, pp. 257-264. doi:10.1002/jctb.280500210
- A. Hashem, A. Abou-Okeil, A. El-Shafie and M. El-Sakhawy, “Grafting of High ά-Cellulose Pulp Extracted from Sunflower Stalks for Removal of Hg (II) from Aqueous Solution,” Polymer Plastics Technology and Engineering, Vol. 45, 2006, pp. 135-141.
- A. Hashem, A. Abdel-Lateff, S. Farag and D. M. Hussein, “Treatment of Alhagi Residues with Tartaric Acid for the Removal of Zn (II) Ions from Aqueous Solution,” Adsorption Science & Technology, Vol. 26, No. 9, 2008, pp. 661-678. doi:10.1260/026361708788251376
- A. Hashem, A. M. Azzeer and A. Ayoub, “Removal of Hg (II) Ions from Laboratory Wastewater onto Phosphorylated Haloxylon Ammodendron: Kinetic and Equilibrium Studies,” Polymer Plastics Technology and Engineering, Vol. 49, No. 14, 2010, pp. 1395-1404. doi:10.1080/03602559.2010.496423
- A. Hashem, H. A. Hussein, M. A. Sanousy, E. Adam and E. E. Saad, “Modified Monomethylolated Thiourea: Sawdust as a New Adsorbent for Removal of Hg (II) from Contaminated Water: Equilibrium Kinetic and Thermodynamic Studies,” Polymer Plastics Technology and Engineering, Vol. 50, No. 12, 2011, pp. 1220-1230. doi:10.1080/03602559.2011.566301
- A. A. Khalil, H. H. Sokker, A. Al-Anwar, A. Abd ElZaher and A. Hashem, “Preparation, Characterization and Utilization of Amidoximated Poly (AN/MAA)-Grafted Alhagi Residues for the Removal of Zn (II) from Aqueous Solution,” Adsorption Science and Technology, Vol. 27, No. 4, 2009, pp. 363-383. doi:10.1260/026361709790252669
- A. I. Vogel, “A Text-Book of Quantitative Inorganic Analysis including Elementary Instrumental Analysis,” 3rd Edition, Longman Group Limited, London, 1972, pp. 402- 404.
- S. C. Tsai and K. W. Juang, “Comparison of Linear and Non-Linear Forms of Isotherm Models for Strontium Sorption on a Sodium Bentonite,” Radioanalytical and Nuclear Chemistry, Vol. 243, No. 3, 2000, pp. 741-746. doi:10.1023/A:1010694910170
- I. Langmuir, “The Constitution and Fundamental Properties of Solids and Liquids,” Journal of American Chemical Society, Vol. 38, No. 11, 1916, pp. 2221-2295. doi:10.1021/ja02268a002
- K. R. Hall, L. C. Eagleton, A. Acrivos and T. Vermevlem, “Pore and Solid Diffusion Kinetics in Fixed Bed Adsorption under Constant Pattern Conditions,” Indian Engineering Chemistry Fundamentals, Vol. 5, No. 2, 1966, pp. 212-223. doi:10.1021/i160018a011
- H. Freundlish, “Over the Adsorption in Solution,” Journal of Physical Chemistry, Vol. 57, 1906, pp. 385-470.
- F. Haghseressht and G. Lu, “Sorption Studies onto Activated Carbon,” Energy Fuels, Vol. 12, 1998, pp. 1100- 1107.
- M. J. Tempkin and V. Pyzhev, “Kinetics of Ammonia Synthesis on Promoted Iron Catalysts,” Acta Physicochimica URSS, Vol. 12, 1940, pp. 217-222.
- O. Redlich and D. L. Peterson, “A Useful Adsorption Isotherm,” Journal of Physical Chemistry, Vol. 63, No. 6, 1959, pp. 1024-1026. doi:10.1021/j150576a611
- H. C. Trivedi, V. M. Patel and R. D. Patel, “Adsorption of Cellulose Triacetate on Calcium Silicate,” European Polymer Journal, Vol. 9, No. 6, 1973, pp. 525-533. doi:10.1016/0014-3057(73)90036-0
- Y. S. Ho and G. McKay, “Sorption of Dye from Aqueous Solution by Peat,” Chemical Engineering Journal, Vol. 70, 1998, pp. 115-124.
- E. Tutem, R. Apak and C. F. Unal, “Adsorptive Removal of Chlorophenols from Water by Bituminous Shale,” Water Research, Vol. 32, No. 8, 1998, pp. 2315-2324. doi:10.1016/S0043-1354(97)00476-4
- V. J. P. Poots, G. McKay and J. J. Healy, “Removal of Basic Dye from Effluent Using Wood as an Adsorbent,” Journal of the Water Pollution Control Federation, Vol. 50, 1978, pp. 926-939.
- K. Nagarethinam and M. S. Mariappan, “Kinetics and Mechanism of Removal of Methylene Blue by Adsorption on Various Carbons: A Comparative Study,” Dyes and Pigments, Vol. 51, No. 1, 2001, pp. 25-40. doi:10.1016/S0143-7208(01)00056-0
- S. H. Chien and W. R. Clayton, “Application of Elovich Equation to the Kinetics of Phosphate Release and Sorption on Soils,” Soil Science Society of America Journal, Vol. 44, No. 2, 1980, pp. 265-268. doi:10.2136/sssaj1980.03615995004400020013x
NOTES
*Corresponding author.