Journal of Water Resource and Protection
Vol.3 No.12(2011), Article ID:16405,5 pages DOI:10.4236/jwarp.2011.312103
Hydrochemical Evaluation of Groundwater Quality in Michael Okpara University of Agriculture, Umudike and Its Environs, Southeastern Nigeria
Department of Physics, Michael Okpara University of Agriculture, Umudike, Nigeria
E-mail: akankpo@yahoo.com
Received September 24, 2011; revised October 26, 2011; accepted November 27, 2011
Keywords: Groundwater Quality, Umudike, Pollution, pH, Turbidity, Conductivity, TDS
ABSTRACT
This article presents results of groundwater quality assessment based on some pollution indicators (pH, conductivity, total dissolved solids, total suspended solids and turbidity) carried out in Michael Okpara University of Agriculture, Umudike, Abia State, Nigeria. Twelve functional boreholes within the university campus and its environs were sampled and analyzed using the standard laboratory techniques. The results showed that the groundwater in the area was acidic with an average pH value of 5.47, which falls below the World Health Organization (WHO) standard for drinking water. The results also showed high turbidity values ranging from 86.10 to 90. 17 NTU which exceeds the WHO standard. The waters have moderate to high values of total dissolved solids, TDS (100.00 to 900.00 mg/L), total suspended solids, TSS (100.00 to 1200.00 mg/L) and conductivity (66.67 to 600.03 µs/cm). Recommendations include periodic groundwater monitoring and treatment.
1. Introduction
Water is no doubt one of the most essential needs of human beings, for drinking and other domestic purposes. It is a landscape element and a chemically active mobile substance, always on continuous move through the surface and subsurface [1]. Groundwater constitutes over 90% of the world’s readily available freshwater resources with remaining 10% in lakes, reservoirs, rivers and wetlands [2,3]. Freshwater quality and availability remains one of the most critical environmental and sustainable issues of the 21st century [4].
Groundwater is never really chemically pure as water invariably dissolves some of the minerals it comes in contact with, at any given time [5]. These dissolved minerals are contained in the groundwater which influences its hydrogeochemistry and ultimate quality [6]. Poor management of solid waste materials has resulted to a lot of disastrous effects such as aesthetics, environmental hazards and pollution. Groundwater pollution may also occur due to the contamination potential of leachate from waste. Various methods by which waste can be disposed are open dumps, sanitary landfill, inceineration on-site disposalanimal feeding composting [1].
Meteorological events and pollution are a few of the external factors, which affect physico-chemical parameters such as pH and turbidity of the water. They have a major influence on biochemical reactions that occur within the water. Sudden changes of these parameters may be indicative of changing conditions in the water. Internal factors, on the other hand, include events which occur between and within bacterial and plankton population in the water body [6,7].
This study is aimed at determining the groundwater quality in Michael Okpara University of Agriculture, Umudike and its environs using some pollution indicators. Twelve functional boreholes samples located in Michael Okpara University of Agriculture, Umudike and its environs were assessed for quality checks by physicochemical analysis of the samples in the laboratory. The physicochemical parameters used were conductivity (CN), turbidity, total dissolved solids (TDS), total suspended solids (TSS) and pH. The values of the phsicochemical parameters were correlated with the World Health Organization(WHO) values [6,8].
2. Geology and Hydrogeology of the Study Area
Michael Okpara University of Agriculture, Umudike (MOUAU) is located in Ikwuano Local Government Area of Abia State, Southeastern Nigeria. It is located within the deltaic marine sediments of Cretaceous to recent age, between latitude 5˚28'N and 5˚30'N and between longitude 7˚31'E and 7˚33'E and an elevation range of 60 to 180 m above mean sea level (Figure 1).
The Geology of the area is the deltaic marine sediment of Cretaceous to Recent age. There are two principal Formations in the area namely: the Bende-Ameki and the coastal plain sands otherwise known as the Benin Formation. The Bende-Amaki Formation of Eocene to Oligocene age consists of medium to coarse-grained white sandstone, which may contain pebbles, gray-green sandstone, bluish calcareous silt, with mottled clays and thin limestone. Considerable lateral variation in lithology has also been observed. The lower part of the Formation consists of fine-coarse-grained lenses of sandstone with abundant calcarceous shales and thin shelly limestone. The Bende-Ameki Formation overlies the impervious Imo shale group of Paleocene age, which is characterized by lateral and vertical variations in lithology. The coastal plain sand otherwise known as the Benin Formation overlies the Bende-Ameki Formation and dips southwestward. The Formation sediments were deposited during the late Tertiary-early Quaternary period. The Formation is shallow and has an expected thickness of about 200 m [9]. The lithology consists of unconsolidated loosely medium to coarse-grained cross-bedded sands occasionally pebbly with localized clays and shales. Umudike soil is acidic with average pH range of 4.5 - 5.7.
The two principal geological formations: the BendeAmeki and the coastal plain sands otherwise known as the Benin Formation have comparative groundwater regime. They both have reliable groundwater that can sustain regional borehole production. The Bende-Ameki Formation has little groundwater when compared to the Benin Formation. The high permeability of the Benin Formation, the lateritic overburden earth and the weathered top of this formation as well as the underlying clay-shale member of the Bende-Ameki series provide the hydrologic conditions favouring aquifer formation in the area. The study area has aquifer thickness of about 88.00 m, hydraulic conductivity of about 8.00 m/day and a transmissivity of about 704.00 m2/day [9].
3. Methodology
Twelve groundwater samples were collected from wells located within Michael Okpara University of Agriculture, Umudike and its environs. The samples were stored in a sterilized 250 ml bottles and transferred to the laboratory for analyses. The conductivity, total suspended solids and total dissolved solids were determined using a HACH 44600-00 Conductivity/TDS meter at a temperature of 20˚C. The pH was determined using a HACH sension 3 pH meter. The turbidity was determined using a spectrophotometer. The results are presented in a tabular form (Table 1).
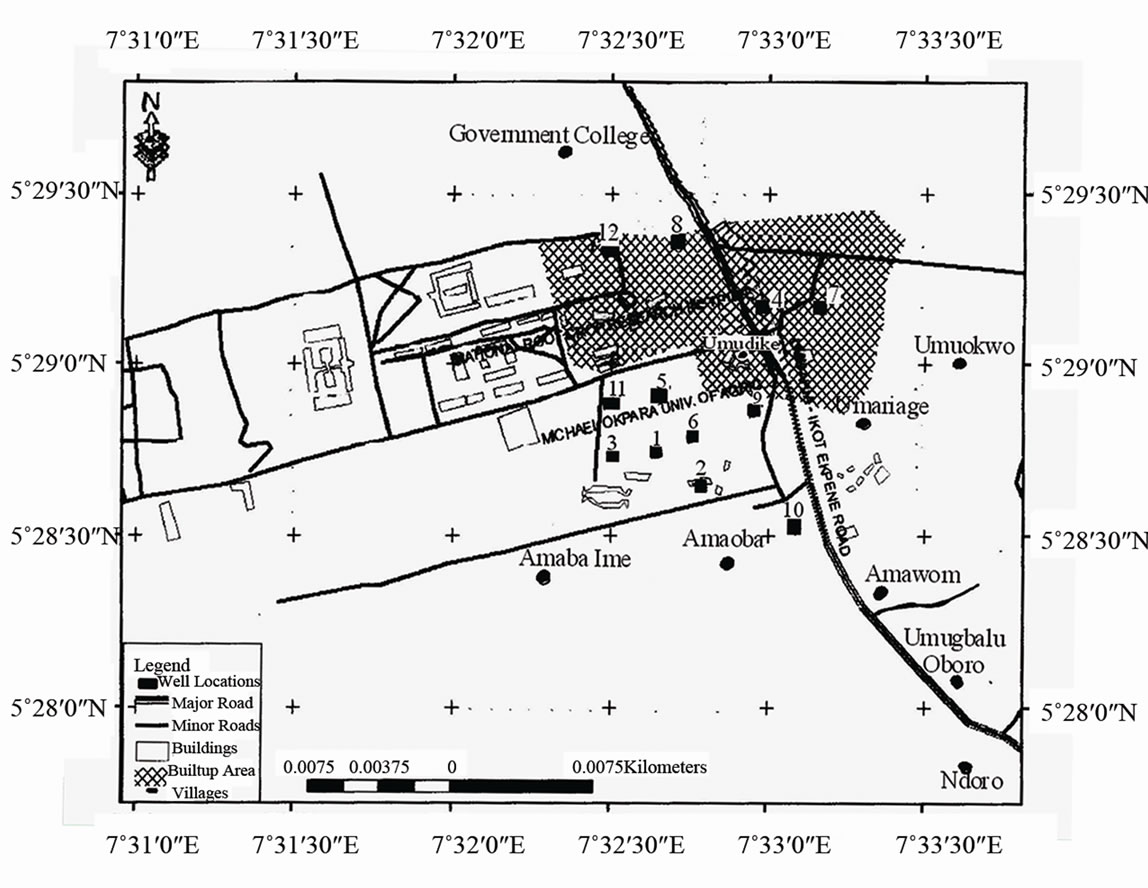
Figure 1. Map of the study area showing sampling locations.
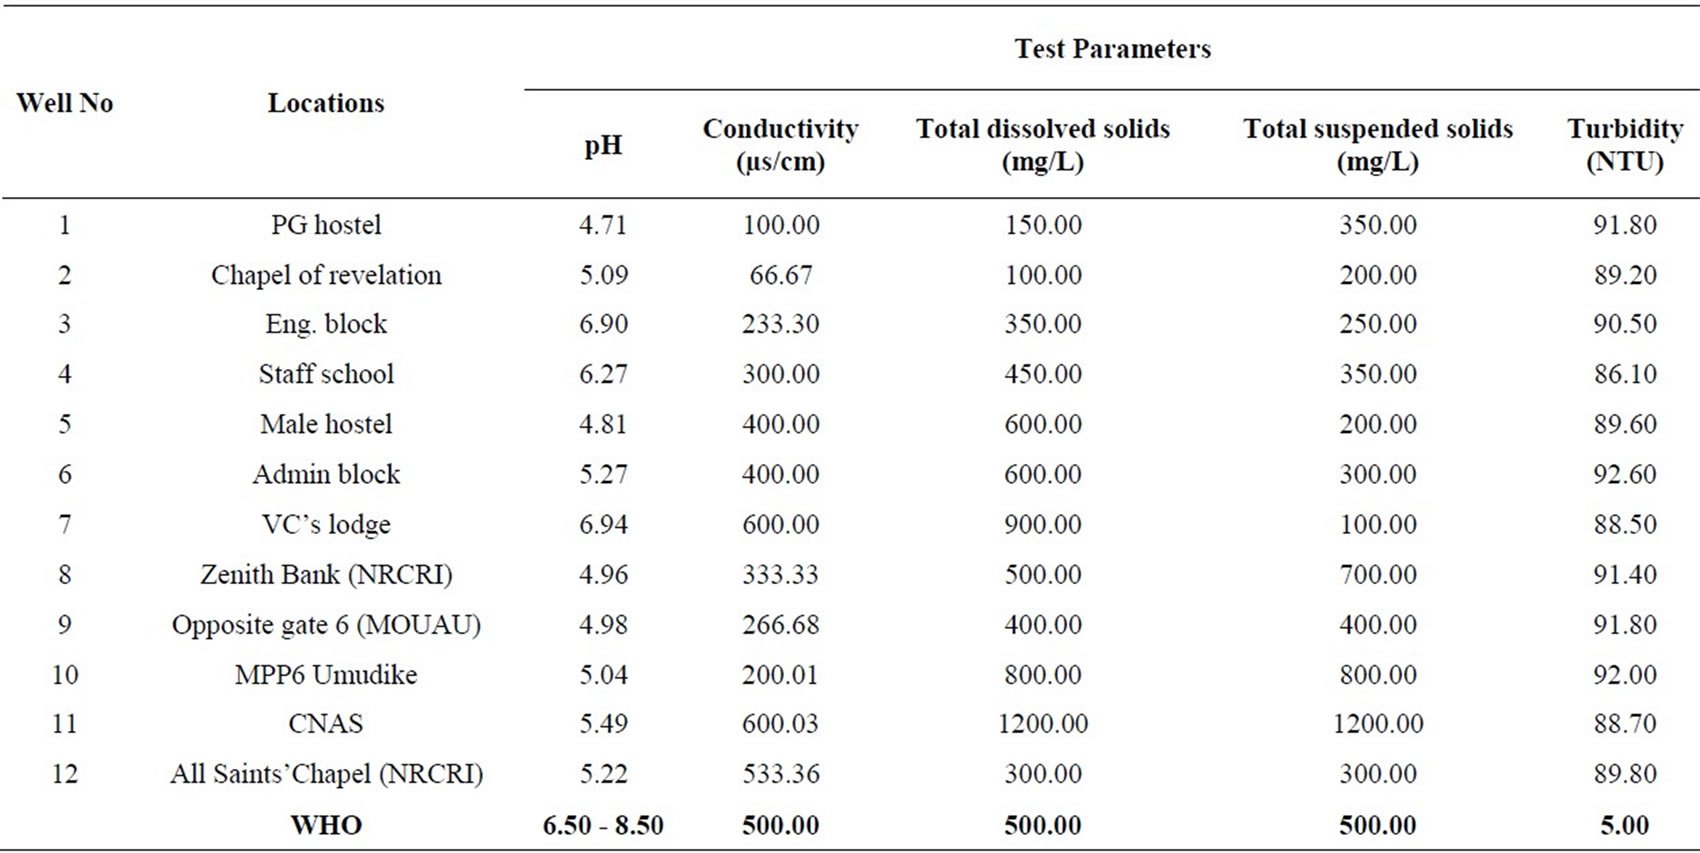
Table 1. Physicochemical results from the study area compared with WHO limits.
4. Results and Discussion
4.1. pH, Conductivity and Turbidity
The pH values in the area varied from 4.71 at location 1 to 6.94 at location 7 which reveals acidic groundwater (Table 1). The mean value of pH for the entire area is 5.47. The pH values at locations 3 and 7 fall within the WHO standard. The mean pH value of 5.47 does not fall within the WHO limit (Table 2). Figure 2 is a two dimensional line chart of pH variations for the area.
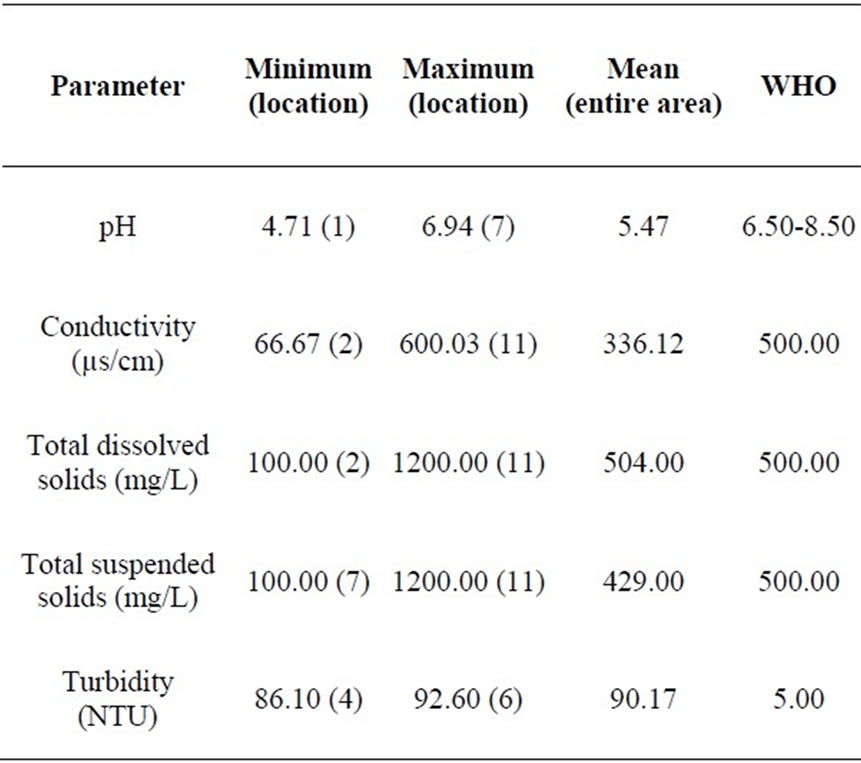
Table 2. Summary of parameter concentrations.
According to Zamxaka [7], pH values ranging from 3.00 to 10.00 could favour both indicator and pathogenic micro-organism growth. Physical parameters such as pH and temperature have a major influence on bacteria population growth [7]. The acidity of the area may have resulted from landfill gases arising from the decomposition of waste materials from agricultural activities into the subsurface. According to Nwankwo and Igboekwe [6], the low pH (high acidity values) could also be as a result of the amount of dissolved carbondioxides and biocarbonates present in the aquiferous rocks. The pH values of the groundwater samples fall within the pH values of the soil, which ranges from 4.50 to 5.70 [10].
The conductivity values in the area ranges from 66.67 µs/cm to 600.03 µs/cm at locations 2 and 11 respectively (Table 1). The mean value of conductivity for the area is
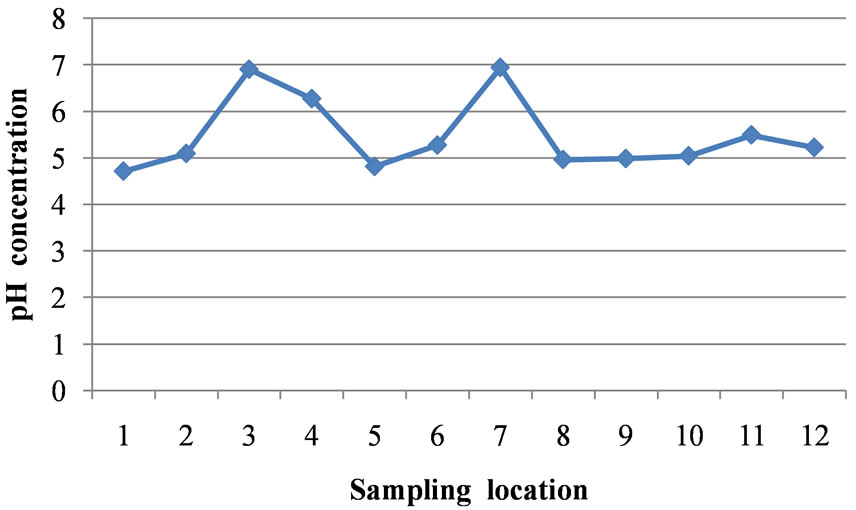
Figure 2. A two dimensional (2-D) line chart of pH variation.
336.12 µs/cm (Table 2). Locations 7, 11 and 12 have conductivity values higher than the WHO limit of 500.00 µs/cm. The mean value for the area is however lower than the WHO limit (see Figure 3). Conductivity of the water can be related to the total dissolved solids concentration, but the relationship may not be a constant [11].
The turbidity values ranged from 86.10 NTU to 92.60 NTU with a mean value of 90.17 NTU. The turbidity values recorded for all the samples were above the WHO acceptable limit of 5.00 NTU (see Figure 4). High turbidity values correspond to rainy season [7]. Turbidity is always typically high during a heavy rain and a storm as a consequence of rapid erosion of surface soils into rivers and groundwater. Water turbidity varies from 1.00 NTU in clear springs or deep groundwater, to 160 ± 60 NTU in mud-laden surface waters [12].
4.2. Total Dissolved Solids and Total Suspended Solids
Total dissolved solids (TDS) values ranged from 100.00 to 1200.00 mg/L for the area. The average value of TDS for the area is 504.00 mg/L, which is fairly above the WHO limit of 500.00 mg/L. TDS values at locations 1, 2,
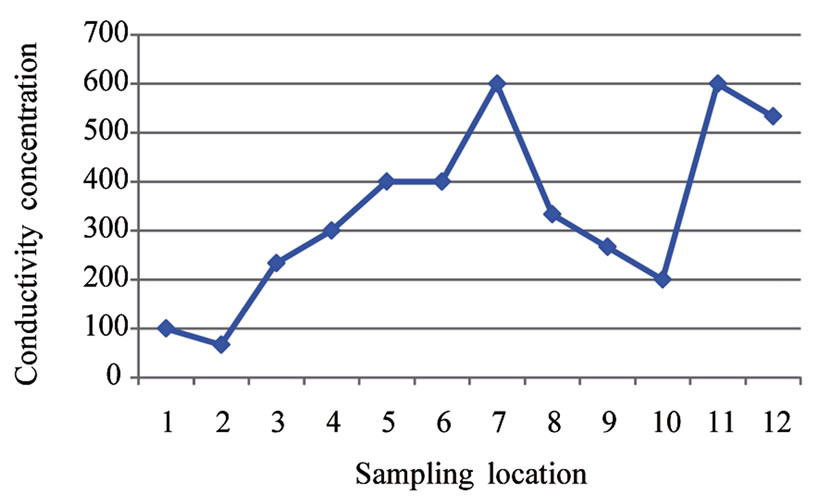
Figure 3. A two dimensional (2-D) line chart of conductivity variation.
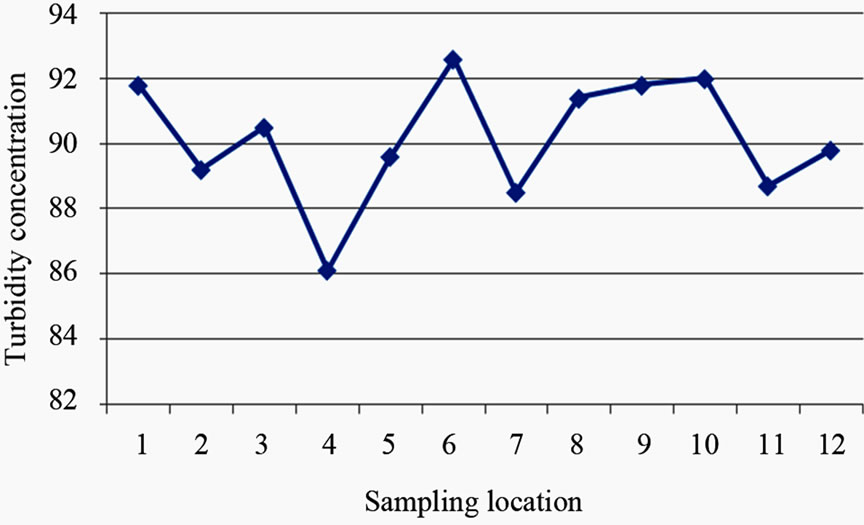
Figure 4. A two dimensional (2-D) line chart of turbidity variation.
3, 4, 9 and10 falls below the WHO standard, while TDS values at locations 5, 6, 7, 11 and 12 fall above the WHO standard. Location 8 has TDS value exactly that of the WHO limit (see Figure 5). Dissolved solids comprise of inorganic salts and some small amounts of organic that are dissolved in water. TDS originates from natural source, sewage, urban-runoff, industrial wastewater, and the nature of the piping or hardware used to convey the water [11]. TDS test provides a qualitative measure of the amount of dissolved ions in water, and cab be used as an indicator test to determine the general quality of water.
Values of total suspended solids (TSS) ranged from 100.00 to 1200.00 mg/L for the area. The area has a mean TSS value of 429.99 mg/L, slightly below the WHO standard of 500.00 mg/L. TSS values at locations 1, 2, 3, 4, 5, 6, 7, 9 and 12 fall below the WHO limit, while TSS values at locations 8, 10 and 11 are above the WHO recommended limit. Generally therefore, Umudike has low TSS (see Figure 6).
5. Conclusions
Hydrochemical assessment of groundwater quality in Michael Okpara University of agriculture and its environs
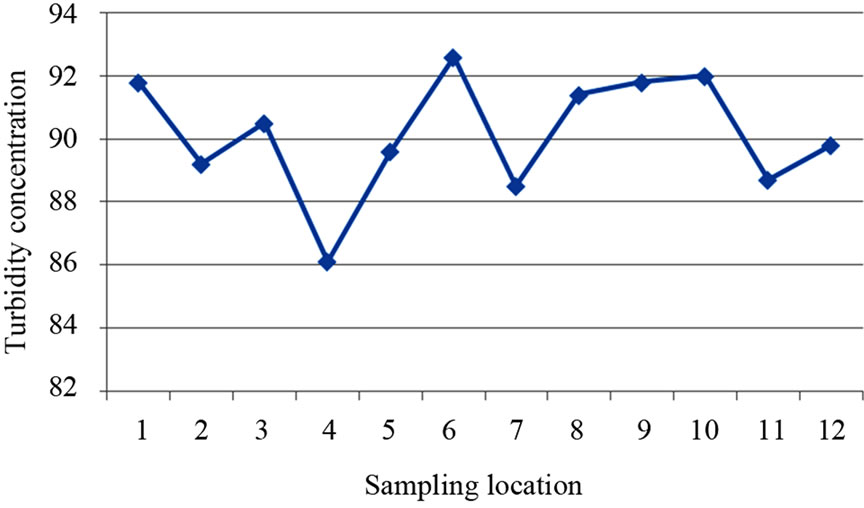
Figure 5. A two dimensional (2-D) line chart of total dissolved solids variation.

Figure 6. A two dimensional (2-D) line chart of total suspended solids variation.
was carried out based on some pollution indicators. The water quality parameters of concern were pH and turbidity because they had marked departure from WHO standard. The groundwater in the area is acidic and of high turbidity values. This is connected with the low pH range of the soil in the area, which has great influence on the groundwater quality. The low pH values of the boreholes water may also be due to the agricultural activities in the area. These solutions diffuse through the sandy permeable layers of the formation to form weakly acidic solutions which are washed down into the aquifer containing the groundwater. The waters have moderate to high values of total dissolved solids (100.00 to 1200.00 mg/L), total suspended solids (100.00 to 1200.00 mg/L) and conductivity (66.67 to 600.03 µs/cm). Recommendations include periodic groundwater monitoring and treatment.
REFERENCES
- A. O. Akankpo and M. U. Igboekwe, “Monitoring Groundwater Contamination Using Surface Electrical Resistivity and Geochemical Methods,” Journal of Water Resource and Protection, Vol. 3, No. 5, 2011, pp. 318-324. doi:10.4236/jwarp.2011.35040
- J. A. Baswinkel, “Information Note,” International Groundwater Resources Assessment Center (IGRAC), Netherlands Institute of Applied Geosciences, Netherlands, 2000.
- C. C. Asonye, N. P. Okolie, E. E. Okenwa and U. G. Iwuanyawu, “Some Physio-Chemical Characteristics and Heavy Metal Profiles of Nigerian Rivers, Streams and Wetlands,” African Journal of Biotechnology, Vol. 6, No. 5, 2000, pp. 617-624.
- United Nations Environmental Program (UNEP), “Global Environmental Outlook (GEO-3),” Nairobi, 2002, p. 43.
- J. O. Etu-Efeotor, “Hydrochemical Analysis Surface and Groundwater of Gwagwalada Area of Central Nigeria,” Global Journal of Pure and Applied Sciences, Vol. 4, No. 2, 1998, pp. 153-162.
- C. N. Nwankwo and M. U. Igboekwe, “The Mineral Effects of Sedimentary Layers on Groundwater in Choba, Rivers State, Nigeria,” The IUP Journal of Environmental Sciences, Vol. 5, No. 2, 2011, pp. 20-27.
- M. Zamxaka, G. Pironcheva and N. Muyima, “Microbiological and Physico-Chemical Assessment of the Quality of Domestic Water Sources in Selected Rural Communities of the Eastern Cape Province, South Africa,” Water SA, Vol. 30, No. 30, 2004, pp. 333-339.
- World Health Organization (WHO), “International Drinking Water Standards,” 3rd Edition, WHO, Geneva, 2007.
- M. U. Igboekwe, E. E. Okwueze and C. S. Okereke, “Delineation of Potential Aquifer Zones from Geoelectric Soundings I KWAIBO River Watershed, Southeastern, Nigeria,” Journal of Engineering and Applied Sciences, Vol.1, No. 4, 2006, pp. 410-421.
- B. O. Nuga and G. E. Akinmola, “Soil Survey Information for Sustainable Agriculture in Ikwuanu Local Government Area Abia State S64th East Nigeria,” Second RUFORUM Biennial Meeting, Entebbe, 20-24 September 2010, pp. 555-557.
- R. E. White, “Spatial Variability of Shallow Groundwater Levels, Electrical Conductivity and Nitrate Concentration and Risk Assessment of Nitrate Contamination in North China Plain,” Environmental International Journal, Vol. 31, No. 16, 2005, pp. 896-903.
- Department of Water Affairs and Forestry (DWAF), “Quality of Domestic Water Supplies—Vol. 1 Assessment Guide,” Department of Water Affairs and Forestry, Pretoria, 1998.