Journal of Water Resource and Protection
Vol.2 No.9(2010), Article ID:2729,9 pages DOI:10.4236/jwarp.2010.29099
Assessment of Flood Hazard of Jeddah Area 2009, Saudi Arabia
Space Research Institute, King Abdel Aziz City for Science and Technology,
Riyadh, Kingdom of Saudi Arabia
E-mail: geomm5.mashael@gmail.com
Received June 13, 2010; revised July 7, 2010; accepted July 15, 2010
Keywords: Disaster, Flooded Areas, Space Tools, Saudi Arabia
ABSTRACT
Due climatic variability and anthropogenic changes, floods have been raised lately in several regions worldwide. The resulting impact from floods is often harmful. This can be applied to Saudi Arabia, the country which is known by dry climatic conditions, and it became lately a typical region for such natural hazard. Hence, floods are observed as a yearly disaster with high magnitude of influence. Jeddah, a coastal Saudi city on the Red Sea to the west, has witnessed severe event in November 2009, when flooded water and sediments (torrents) invaded the urban areas and resulted decease of many people and destroyed the infrastructure and civilized zones. The lack of mitigation implements exacerbated the problem. This study implies an assessment of flood hazard risk in Jeddah region. It aims to identify the zones subjected to flood and then inducing the influencing factors at different levels of effect. For this purpose space techniques were utilized, with a focus on IKONOS satellite images, which are characterized by high resolution in identifying terrain features. In addition Geographic Information System (GIS) was also used to support space techniques. Thus, damaged areas and the mechanism of flooding process were recognized. This helps avoiding further urban expansion in areas under flood risk and will aid decision maker to put new strategies for hazard management.
1. Introduction
Natural hazards occupy the essential concern on the national and regional levels, hence, they are raised as a priority issues in many geo-environmental assemblies. The frequency of these catastrophic events has been recently increased in different regions worldwide, but focuses are often on regions which haven’t been known as an environment for such events. Saudi Arabia is an ideal example of natural hazards, and lately it has become a region under natural risk. This is well pronounced since the region is anticipated to witness changes in its climatic condition, and especially the increase in the amount of rainfall [1-3].
The most common ones are dust storms, floods and mass movement, whilst the region is also vulnerable to many other aspects of natural risk, such as erosion, drought, earthquake, volcanoes, etc. These hazardous events are physically-controlled and their impact increased where dense human activities are developed.
A statistical overview has been made for natural hazards in Saudi Arabia for the period between 1982 and 2005 [4]. It shows that the most frequent hazard belongs to floods, which has an average recurrence of about 7 times/year; then the epidemic hazard with 4 times/year, and lastly the dust storms with 1 time event/year. It reveals that the average economic damage value may exceed 19 million UD dollars per year.
Recently, floods occupy the most frequent natural disasters in the region and exist several times per year where they result severe conditions. Their impact appeared to be harmful due to the intensity of rainfall, as well as the lack of mitigation implements. Hence, large areas of urbane settlements are distributed regardless to any natural risk that may occur. This is accompanied with a clear lack in studies done on this concern. Obviously, it was the result when a flood event has been occurred in November 2009 in Jeddah, the costal Saudi city on the Red Sea (Figure 1). In this flood, catastrophic consequences were resulted and more than one hundred people were deceased and a large number of villages were totally drifted by the effect of huge amounts of running water and sediments.
Identifying the hydrologic regime of a flood process can be done by identifying the mechanism of water flow along different drainage networks, which is essential to determine the sources of flooded water. This requires a comprehensive assessment, and it needs mainly considering the whole drainage system. However, monitoring water flow among this system can be done effectively by using space techniques. This study was carried out, in a broad sense, to: 1) identify the extent of denudated region, 2) delineate the flow mechanism of sediments-bearing water among different drainage systems and 3) to propose implications for flood control system in the region.
For this purpose, IKONOS satellite images were used, since they are characterized by high spatial resolution and enable identifying objects on terrain surface up to 1m2 area from space, with a comprehensive vision. The used images were for the flooded region before and after the flooding event that taken place in Jeddah in November 2009. This helps comparing the existed changes and thus recognizing a detailed impact assessment. The utilized satellite images were processed using ERDAS Imagine and ENVI-4.3 software, which is dedicated for this purpose. In addition, the extracted data from these images were manipulated and analyzed in the Geographic Information System (GIS), and more certainly Arc GIS 9.3. It was utilized to produce different maps in digital form, and thus inducing the morphometric properties of the drainage system as well as the catchment areas. Moreover, GIS played a role in the cartography of different categories of catastrophic regions, followed by numerical measures.
Therefore, a map showing flooded areas was produced covering the entire region. It was characterized by five categories showing different levels of impact, starting from very high to very low impact. The higher levels were found to be located almost in regions where thick sediments exist among valleys’ courses.
The technical part of this work was accompanied with field verification to assure the reliability of data obtained by remote sensing techniques and applying volumetric measures. Therefore, 63 sites were selected for this verification.
The area of concern was selected according to the geographic distribution of the flooded zones in Jeddah city and its surrounding region. It is a coastal plain, where Jeddah city is located, and extends to mountain chains in the east. It was selected in coincidence with the existing water basins, with a total area of approximately 688 km2. It is located between the geographic coordinates 21°17′, 21°47′ N& 39°05′, 39°39 E′.
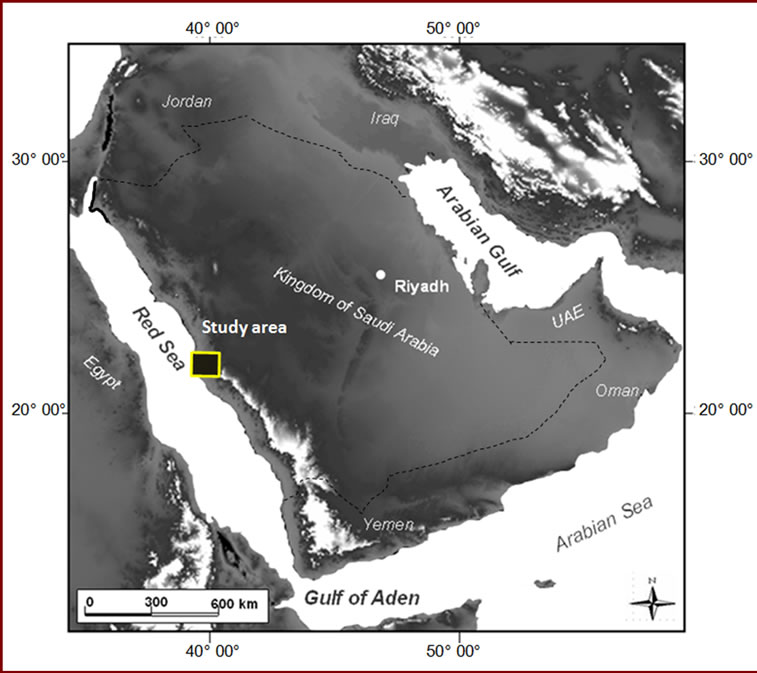
Figure 1. Location map of the study area.
The aim of this study is to determine the spatial distribution of the damaged zones by flooded water. This will help identifying the mechanism of water flow and the major influencing factors, which is useful for future panning and flood risk management.
2. Methods
Floods along mountain valleys may be generated by various types of precipitation aspects. The magnitude frequency difference between the largest floods and more frequent floods will be a function of the mechanisms that produce the floods [5], which is almost controlled by several physical and anthropogenic factors. Thus, there are several factors influencing flood process and they either act on high degree of impact or sometimes they act partially on this hydrologic process. However, these factors differ from one region to another depending mainly on the physical setting of the area under study. According to Al Saud 2010 [6], these factors, as existed in the area of concern, were found to attribute to: basin width /outlet ratio, drainage density, slope, valleys intersection, valley cross-section, depressions, lithology, and fracture systems and sediments accumulation in valleys.
The application of coincidence approach between the geographic distribution of flooded regions in November 2009 and the dominant factors; however, these factors were found to exist at different levels of influence. Therefore, the most influencing factors are: sediments accumulation in valleys, valley cross-section, depressions and valleys intersection, which have a coincidence of 50.58%, 36.31%, 30.73% and 22.75%; respectively. Nevertheless, this is not the case for all regions worldwide, therefore each region has its own characteristics and these factors may act or not and at different magnitude and scale. For example, the influence of sediments accumulation in the studied region of Jeddah may be replaced by diverse acting agent in another region, such as terrain instability and mass movement. Also, rainfall regime may differ and some regions subjected to floods at lower rainfall intensity than other region.
In order to select the required tools for analysis; however, the scheme of the proposed approach must be primarily identified in the light of the major objectives of the study. Thus, the three tasks are sought. These are: 1) the delineation of catchment areas (watersheds) where the flood has taken place, 2) identifying the geographic distribution of flooded zones, and 3) identifying the hydrologic and geomorphologic characteristics that controlled the flow regime of flooded water and transported sediments.
To achieve tasks, a number of products are needed. These are, in a broad sense, thematic maps and satellite images, indicating the physical characteristics of the region and the spatial distribution of the flood and destroyed regions.
Table 1 shows the used tools and documentation in the current research. The selection of these tools and documents depends mainly on their availability as well as their convenience to the subject matter.
The applied method in this study followed three major phases of work. They were applied in a time sequence, even though some applications in satellite images processing and GIS were overlapped when it was necessary. These phases are following:
2.1. Delineation of Drainage System
It is essential to identify the drainage system where flood may take place, since this hydrologic process (i.e., flood) is merely related to surface water regime. The delineation of drainage system includes the cartography of the outer limit of each catchment area (i.e. watershed), as well as the included streams network within this area. This will help identifying the characteristics of surface water basin and its influence in surface run-off behaviour. Also, the morphometry of the stream has an essential role in controlling water flow regime among these streams and their impact on flood process.
Among the delineation of drainage system; however, many other hydrologic parameters can be identified and calculated, such channel slope, relief ratio and gradient, shape, etc. [7-10]. These parameters can be used for detailed analysis of drainage system characteristics whether for flood assessment/ or prediction.
The approach of drainage system delineation was obtained by direct tracing of streams from topographic
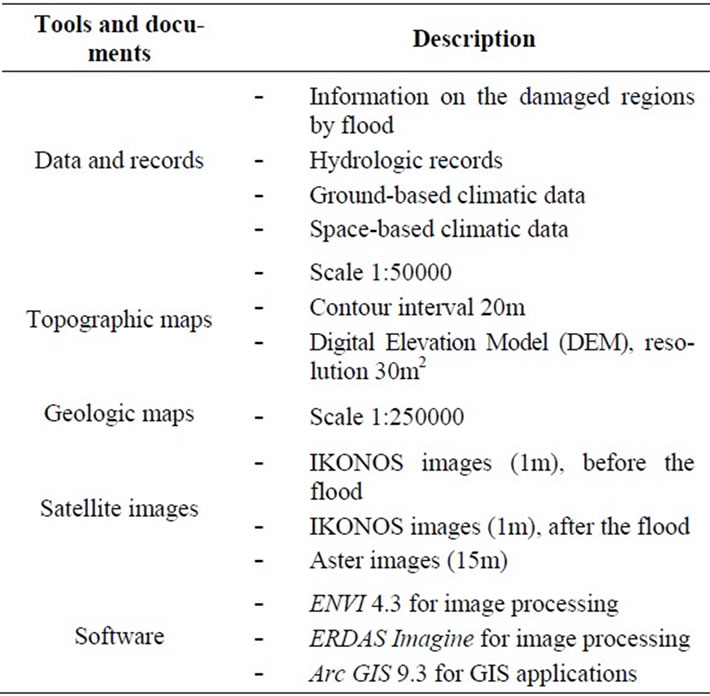
Table 1. Major used tools and documents in the study.
maps (1:50000 scale) and contour interval 20m, which enables drawing streams with high precession. Thus, from the same maps water divides were also identified considering the close heights around the existing streams. In coincidence with manual delineation, GIS digital applications were directly carried out using Arc GIS 9.3. The production of drainage network and catchments area in GIS form help in applying different measuring procedures and data integration, as well as it can help in modifying geo-spatial data whenever it is needed.
In addition to the topographic map, Digital Elevation Model was also utilized, since it is able to apply automated tracing of streams and water basins. Therefore, it was applied to support the resulted cartography obtained from topographic maps.
2.2. Images Processing
It is not a feasible task to identify the comprehensive figure of areas subjected to floods directly from ground investigation. Therefore, utilization of space techniques has been successfully used in this respect [9-11]. However, the method of analysis and specifications of the used tools are different.
This study was accomplished in the frame of several applied approaches worldwide, but the entire characterization of the studied area was given a specific concern, since the area of study is known by its unique geomorphologic and geologic characteristics. Hence, IKONOS satellite images of the region before and after the flood were processed. Nine images scenes (image sheet) were used in order to cover the whole region. Thus they were primarily linked with each other (i.e. mosaicking) after applying they were geo-referenced. The processing of satellite images was done using ENVI 4.3 and ERDAS Imagine, which are known software types with high facility of application and ability to distinguished terrain features.
Accordingly, digital data was subjected to preprocessing procedures first, including a series of sequential operations, including but not limited t, atmospheric correction or normalization, image registration, geometric and radiometric corrections. Another pre-processing phase is the linking of the available image scenes. This is essential to get a unique scene for all images and would facilitate further image treatment approaches.
In this study, the major applied digital procedures are: Band combination, which is applied for better discrimination of terrain features. Thus, the Enhancement procedures were undertaken. There are a variety of images enhancement tools available in ENVI-4.3 and ERDAS Imagine. These are: filtering, and different levels of linear stretching, Gaussian, equalization and square root. Each has different effect on the appearance of the scene after the newly assigned Digital Numbers (DNs) are substituted for the original data values. In this study, Gaussian, equalization was the most suitable tools for image enhancement. In addition to these digital advantages, Interactive stretching, density slicing and thermal band interpretation were also applied.
2.3. GIS Application
Geographic Information System (GIS) was considered as an integral tool in all procedures applied in this study. It played a major role in producing geo-spatial data in digital form, as well as in storing digital data, thus accessibility of data modification and manipulation. Arc GIS 9.3 was the used software for these procedures.
It was primarily used for drainage delineation and analysis, thus it helped in diagnosing the drainage system morphometry and related measures in order to induce hydrological and geomorphological characteristics of the existing basins and streams. Therefore, several floodgoverned characteristics were identified, such as basin areas, slope gradient, width/length ratio, drainage density, etc.
GIS application was also used in producing thematic maps (as thematic layers) extracted from available topographic and geologic maps as well as those geo-spatial data derived from satellite images processing. It is also severed in the integration of different thematic layers by superimposing these layers with each other to induce a comprehensive figure of different geo-spatial data.
3. Results
3.1. Physical Setting
Jeddah is located along a coastal plain, which ranges in width from 5 to 10 km, thus limited from east by a number of mountain chains with average altitude of about 200 m. A number of valleys exist in the mountainous region and extend to the slopes into the surrounding flat regions. In the area of study, there are 24 basins (i.e., watersheds) in the context of the flooded area in Jeddah (November 2009) and it surrounding (Figure 2). Most of these basins form a funnel-like shape, and sometimes with an obvious elongation as a result of tectonic activities in the area.
Sixteen of these basins open towards Jeddah city in the west and the rest open in the southwest direction and almost towards Wadi Fatima, a large rift valley. The total area of these basins is about 688 km2. Among these basins, there are seven basins (number 6, 10, 13, 15, 16, 17 and 23) that characterized with incomplete configuration, which have no specified shape, and thus unidentified outlet, notably when they open into urban areas (Figure 2).
The identified basins are considered as small-scale ones, since all of them are less than 100 km2 in area except Wadi Elasla, the biggest one, with approximately 299 km2 and it joins seven sub-basins. However, these basins together compose a unique geomorphologic feature appears as a huge rocky basin surrounded by mountain chains. These chains are geologically-controlled and forming a triangular orientation. This geomorphic feature is almost closed, except some channeling systems towards Jeddah city to the west and Wadi Fatima to the south (Figure 3). Therefore, rainfall water accumulates in this basin, whose valleys are filled by thick sediments, and when these sediments are oversaturated with water they tend to move downward along valleys to outlet into the adjacent hill slopes of Jeddah city and Wadi Fatima.
The principal hydrologic and geomorphic specifications of the existing drainage basins were studied using GIS and utilized from DEM applications. Therefore, different measures were obtained, including length, area, basin width/outlet ratio, drainage density and slope (Table 2). This will help characterizing these basins and find out the relationship between these specifications and the regions where flood has taken place.
The geology of the study area was analyzed depending mainly on the existing geological maps (1:250000) [13, 14]. The dominant rock types are attributed to the Precambrian rocks, which are widely distributed in mountainous region where granite syenite and granodiorite are exposed. These rocks are appear in massive and thick bedded aspects that characterized by high fractures. In addition, Quaternary rocks also exist, but almost in the coastal plain and valleys. In this respect Aster images were useful in fracture identification and terrain analysis.
The area of study is known by wide and deep valleys, which are mostly fault-controlled geomorphologic features. These valleys are usually filled with friable sediments derived by Aeolian erosion. The thickness of these deposits reaches up to several meters, such as the thick sediments of Wadi El-Hefna.
3.2. Flooded Zones
Identifying the geographic distribution of flooded zones
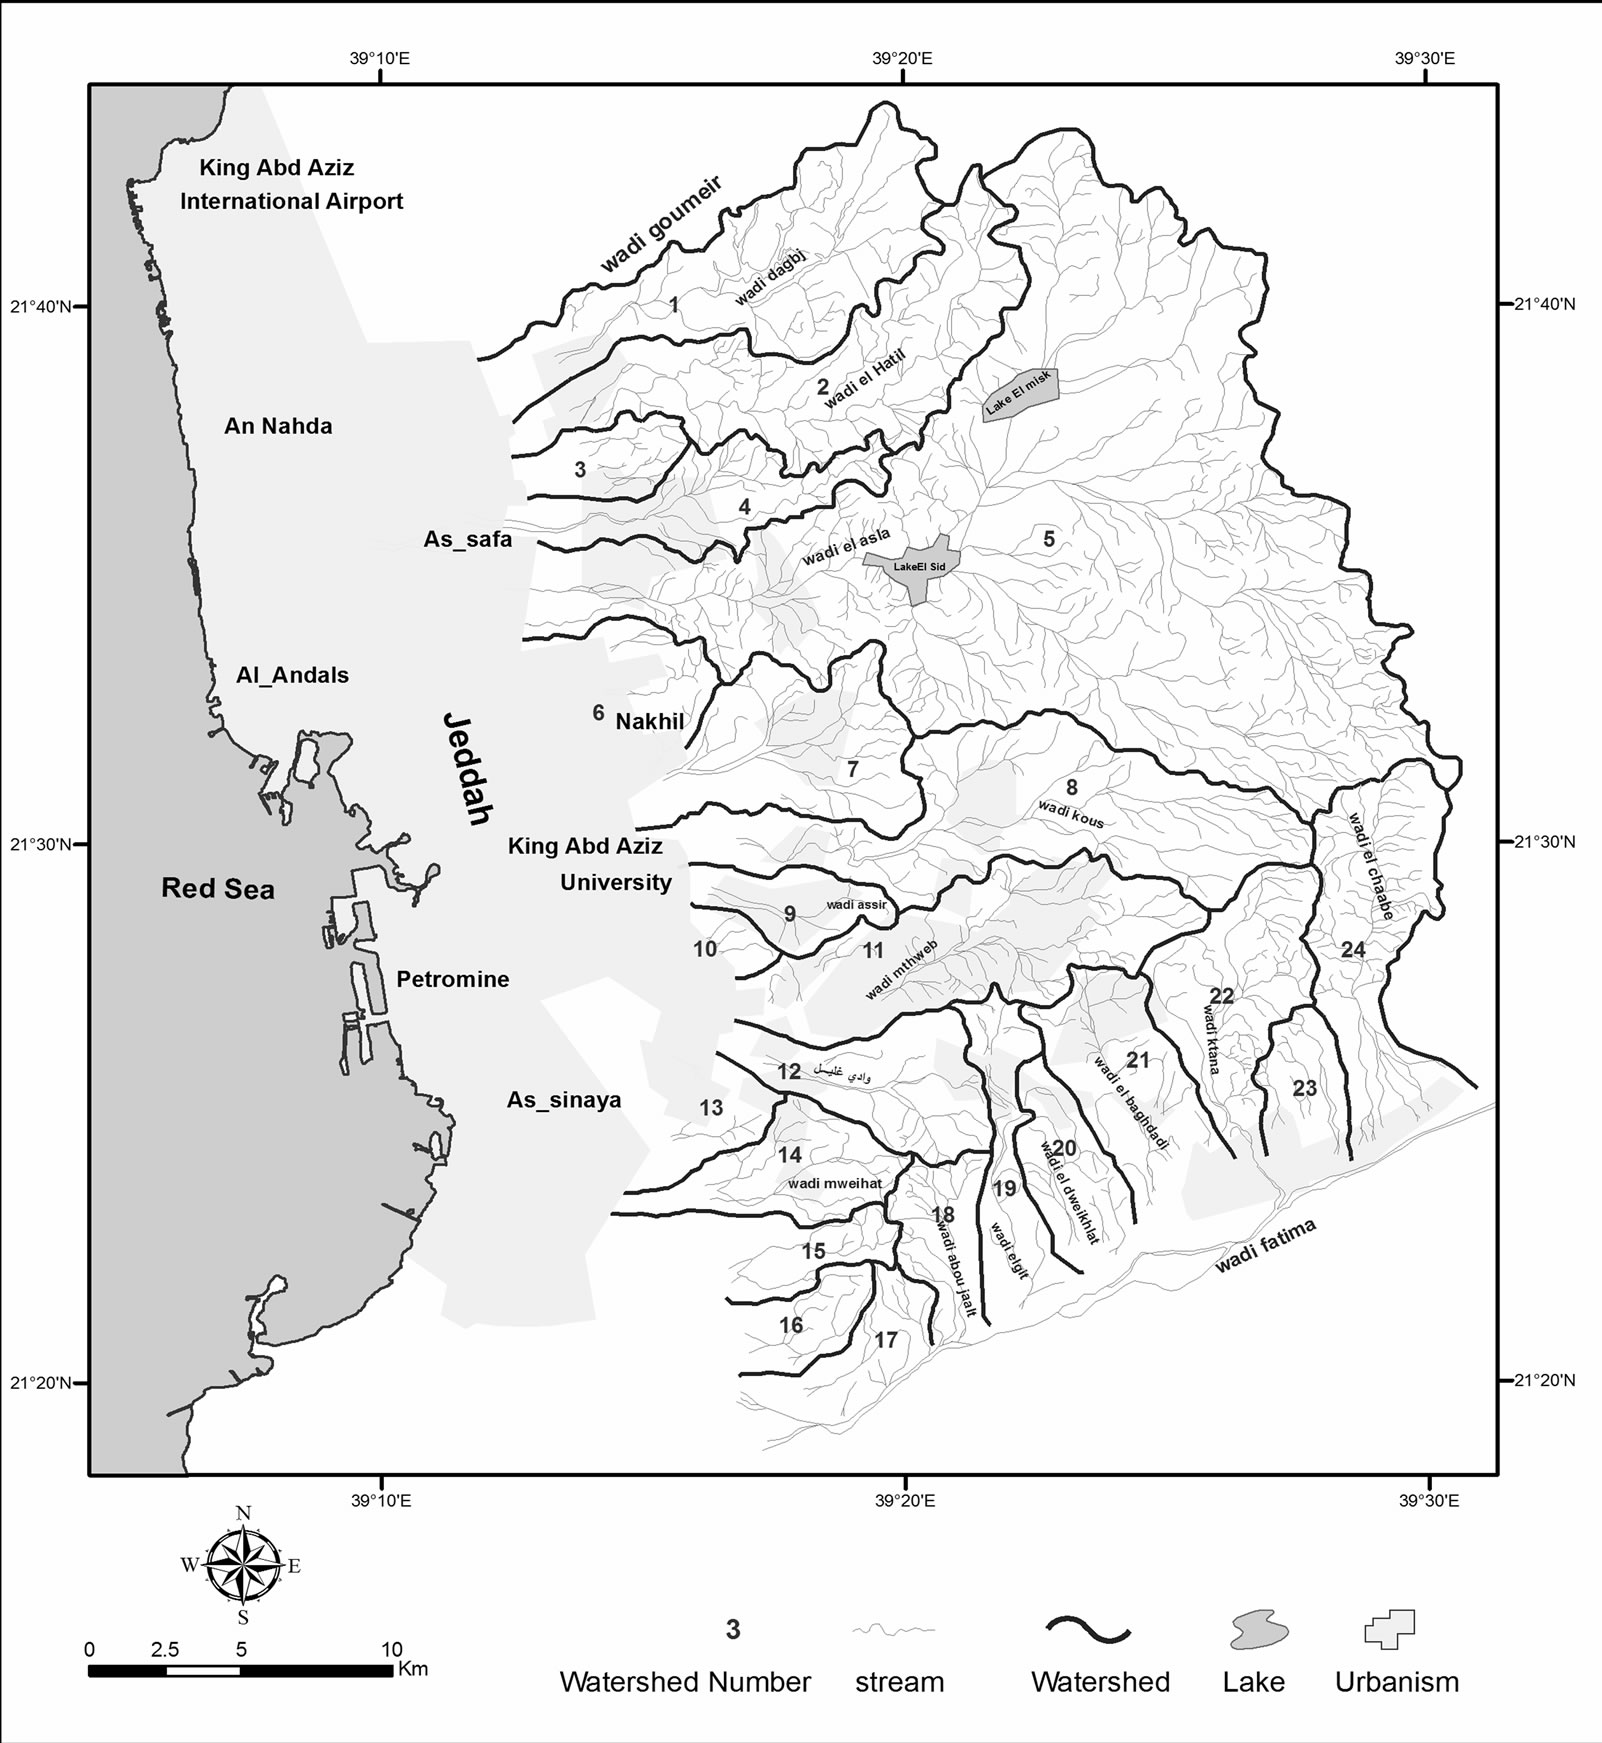
Figure 2. Watersheds map of Jeddah region.
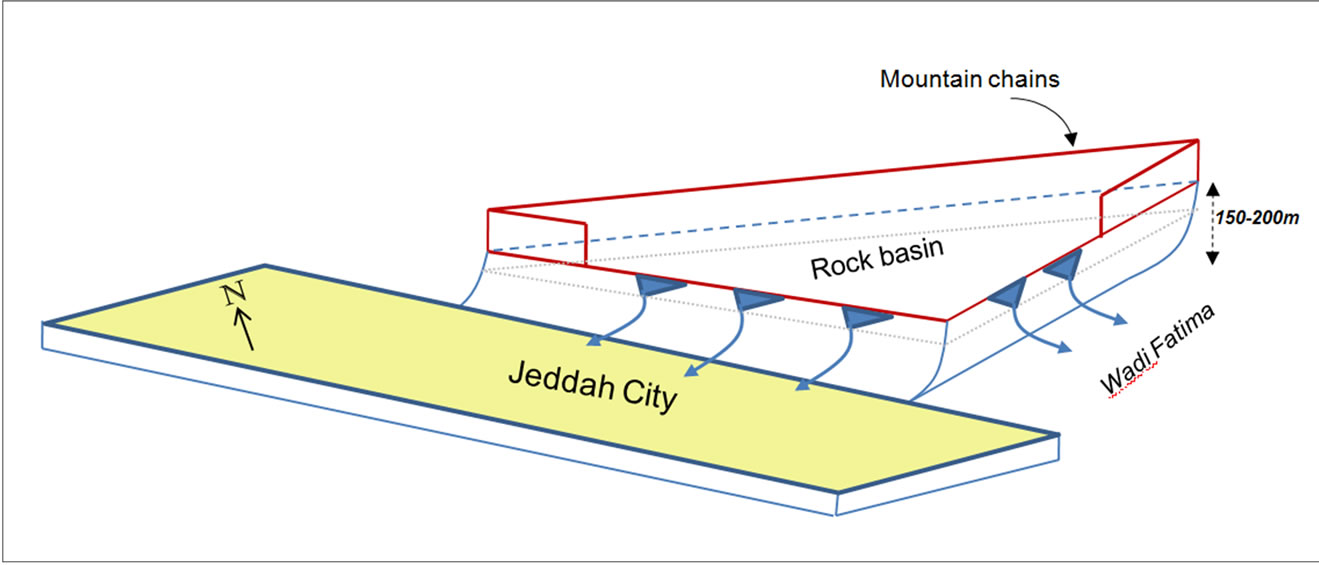
Figure 3. Schematic figure showing the rock basin.
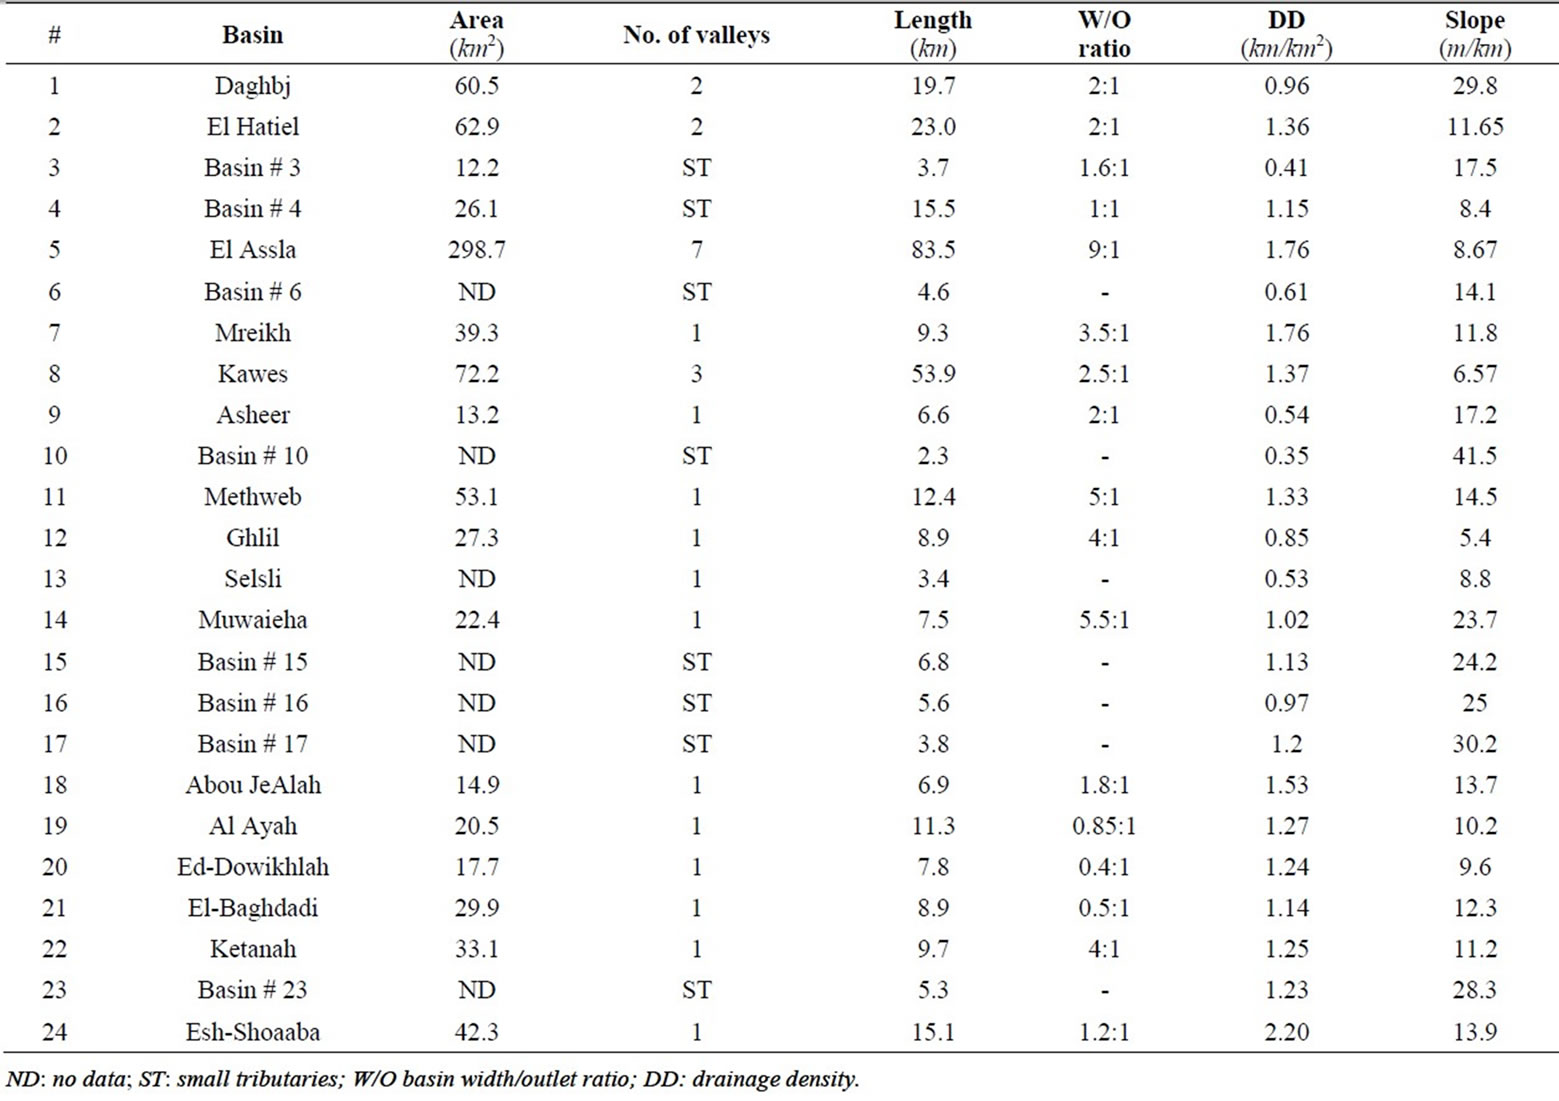
Table 2. Major hydrologic and geomorphologic specifications of existing basins in the study area.
in November 2009 was carried out primarily from satellite images, as mentioned in previous sections. The analysis of IKONOS images was essential in this respect. Thus, IKONOS images for the flooded area before and after the flood were used. This enabled applying a comparative analysis on the basis of before-and after process. Hence, digital and optical advantages, mentioned in previous sections, were applied to reach the most obvious discrimination of terrain features and more certainly the flooded zones.
The identification approach from satellite images based primarily on direct visual interpretation (example in Figure 4), and then it was combined with digital and optical analysis. Thus, the recognized flooded zones were directly digitized and put as a separate layer.
Therefore, a map showing flooded zones with different levels of damage was produced (Figure 5). However, the identification procedure from satellite images was followed by field verification to confirm the reliability of the extracted data, and more certainly to figure out the degree of impact on natural features. Field verification utilized different ground assessment approaches and spatial measures were also applied whenever it was needed. For this purpose GPS was used to rectify the information observed on satellite images with ground observations. The obtained map was classified into five damage categories depending mainly on the observations from satellite images and on-situ investigation. Hence, the resulted categories were described as: very high, high, moderate, low and very low (Figure 5).
Analyzing the produced map, in combination with field verification, resulted a number of findings related to the mechanism of flood process, as well as it helped inducing the influencing factors of impact. The major findings are:
1) The geographic distribution of flooded zones within a certain domain reflects the location where rainfall has taken place.
2) There is an obvious coincidence between the geographic distribution of flooded zones and the existing valleys courses.
3) The entire figure of the flooded zones composes a funnel-like shape with a maximum width of about 32 km and an outlet of about 8 km (i.e., 4:1).
4) There is abrupt discontinuity along some flooded zones, which is almost attributed to human influence, such as the presence of a dam along Wadi El-Assla, and existing of a concrete channels in Kilo-8 region.
5) Even though, some valley systems are vulnerable to floods; however, they did not witness a flooding process, and this is due mainly to the low rainfall rate.
In order to induce the hydrologic characteristic of the flooded zones and the controlling factors and geographic distribution, they were attributed to their location among different drainages systems, which were previously determined. Hence, Table 3 shows the fundamental measures of the flooded zones according their drainage systems.
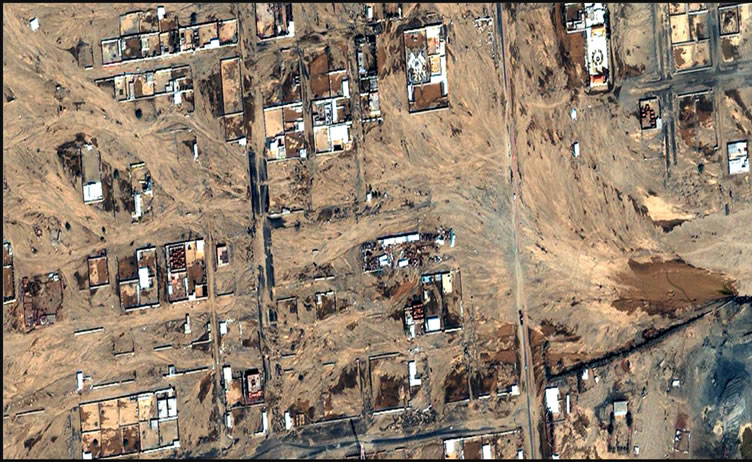
Figure 4. Example showing flooded zone as identified from IKONOS image.
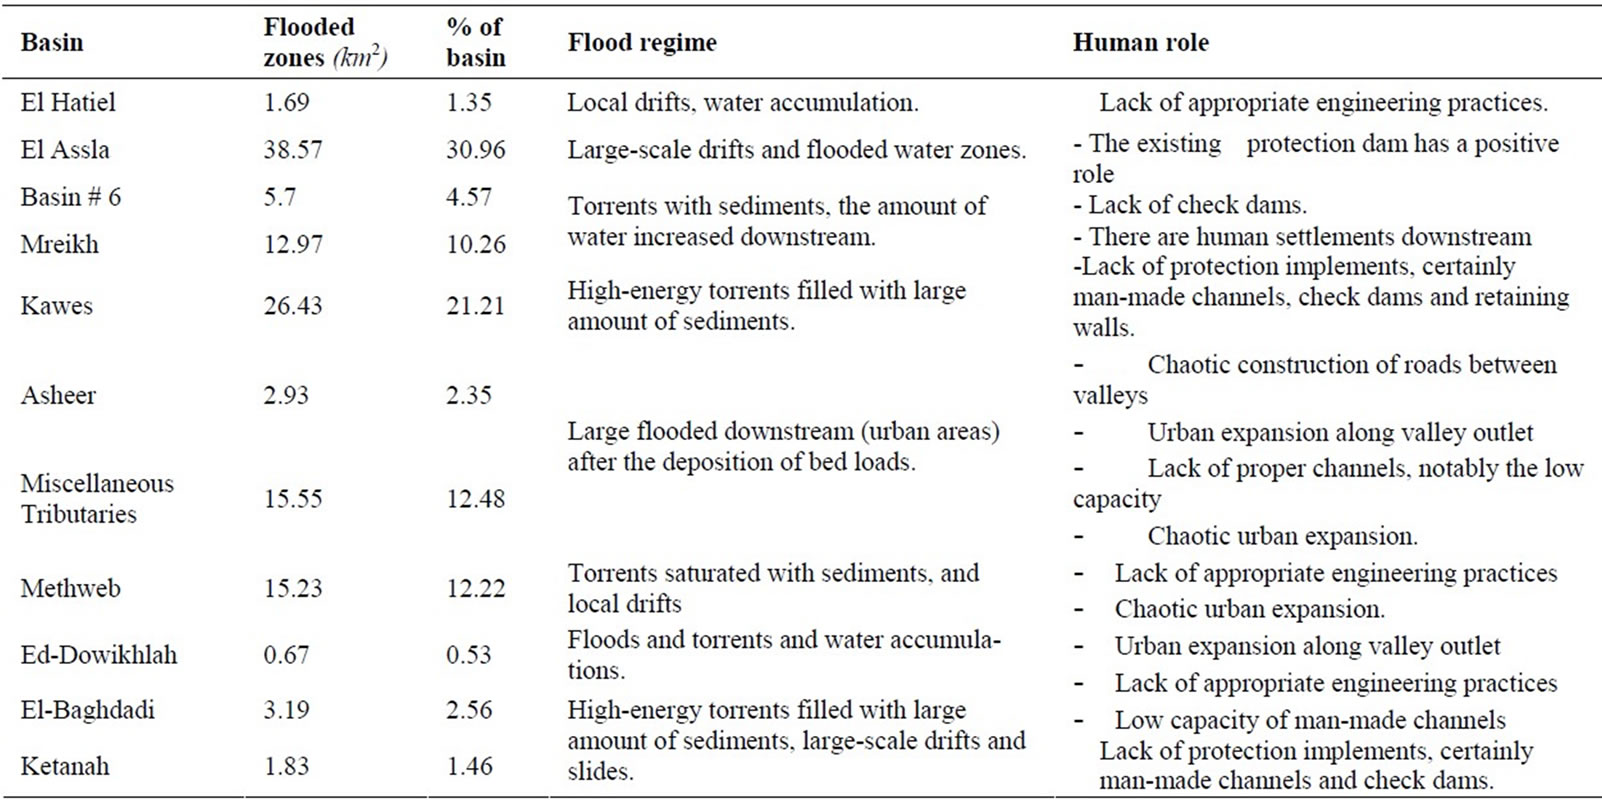
Table 3. Fundamental measures of flooded zones.
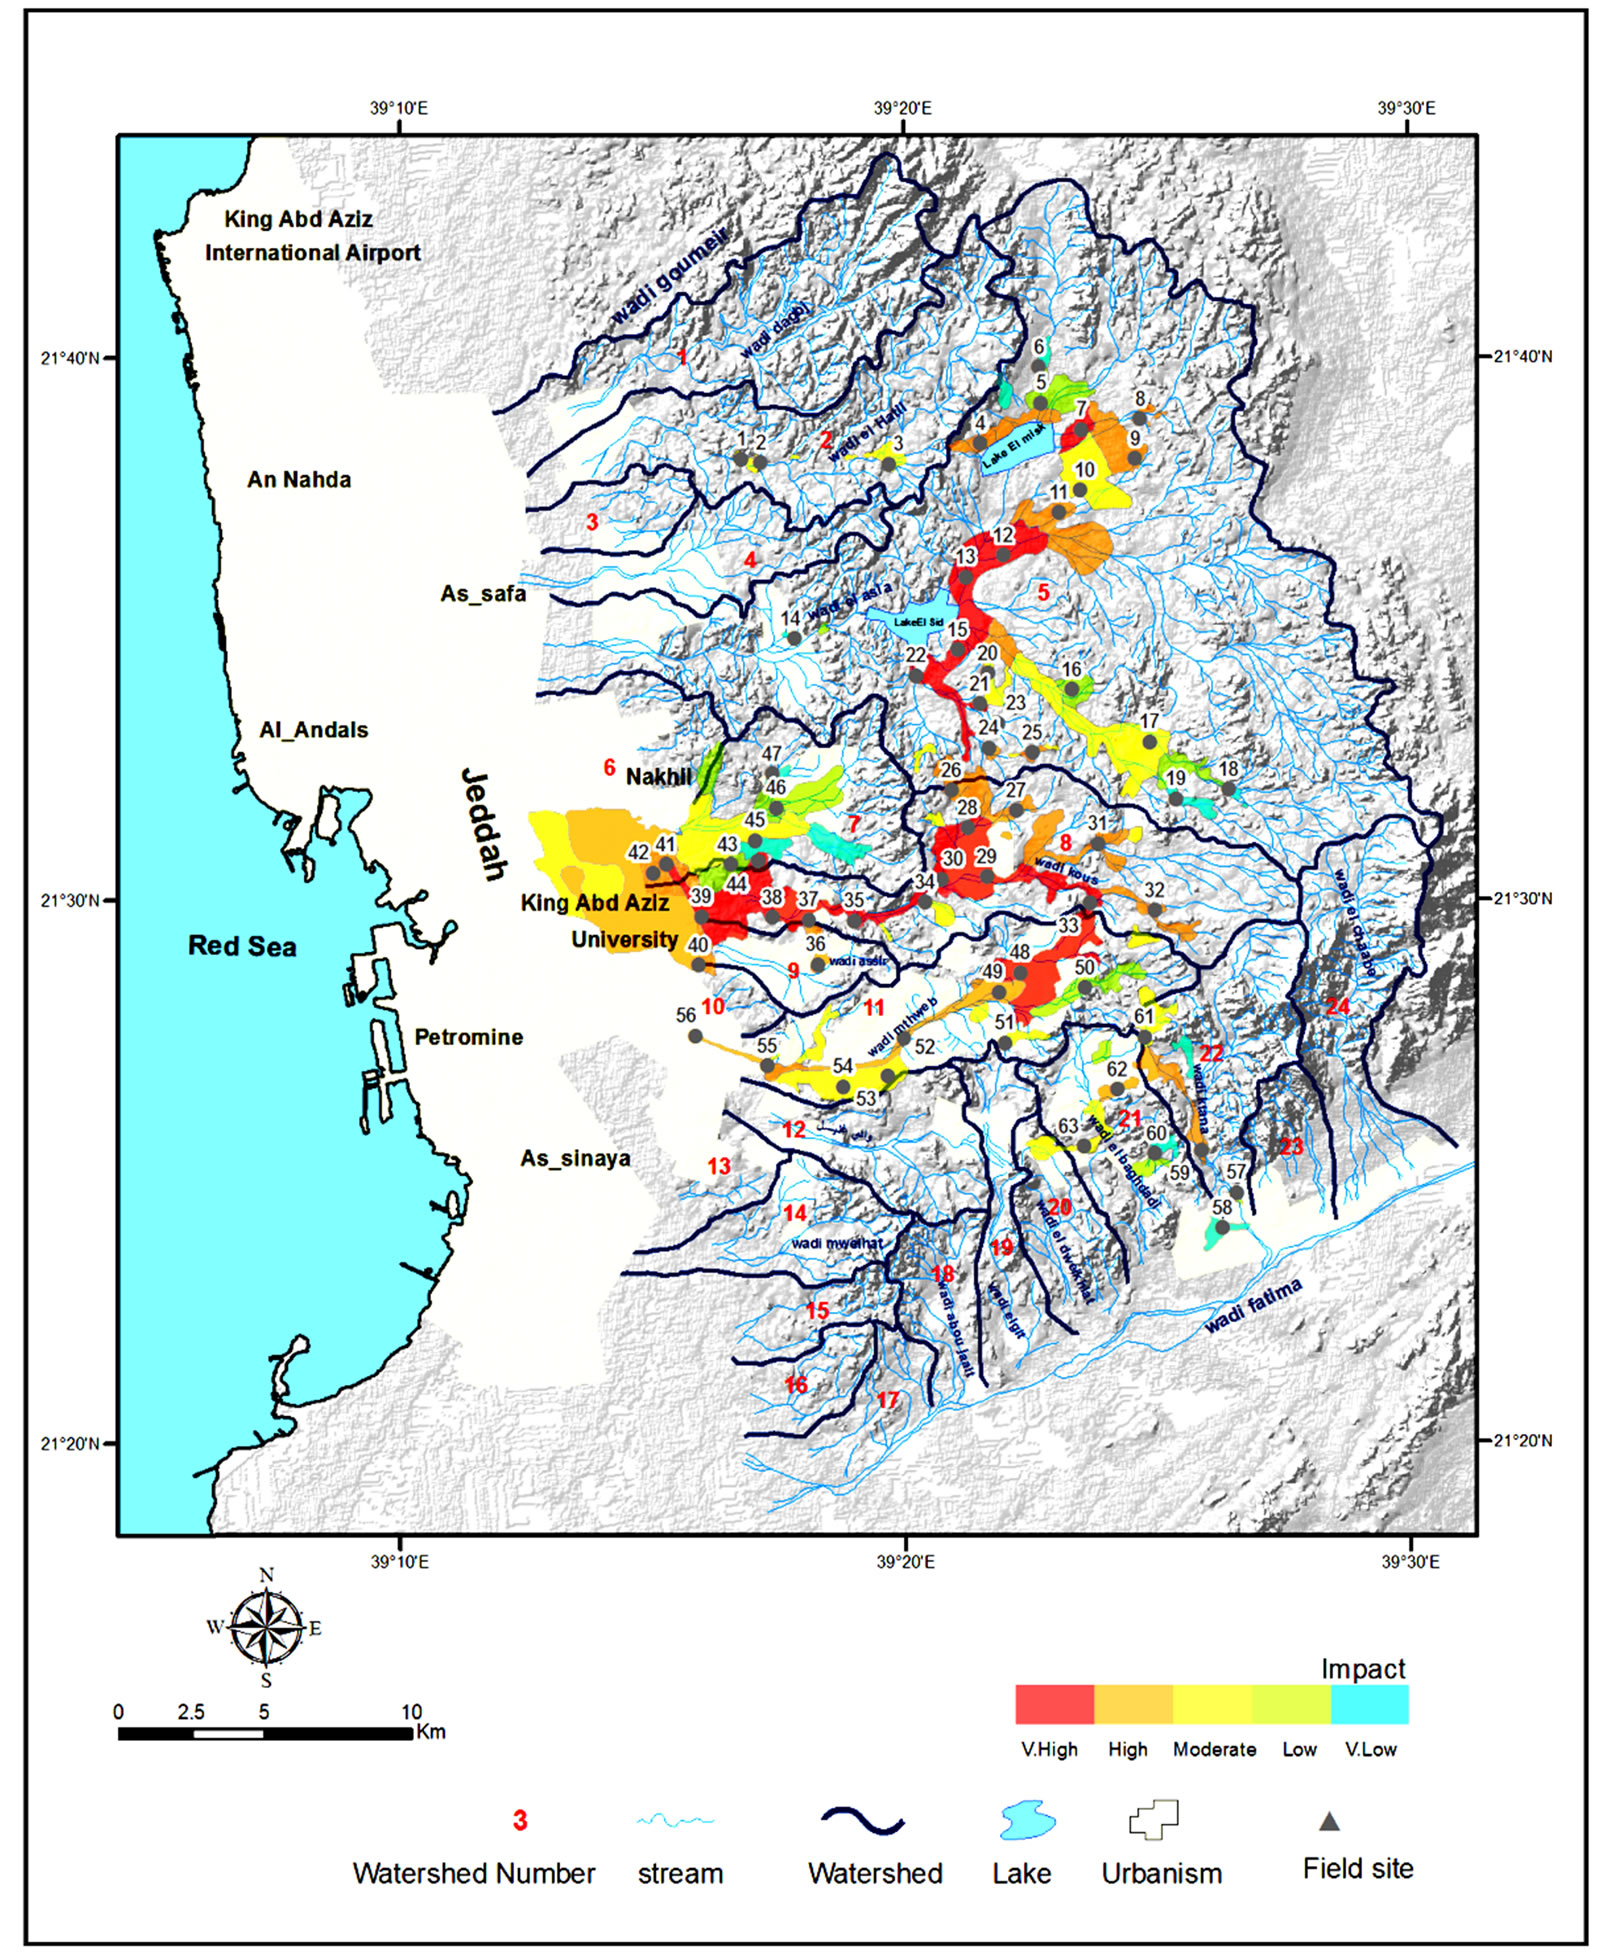
Figure 5. Flooded zones in Jeddah region (November 2009) with five damage categories.
The total area of the flooded zones was measured as 124.58 km2, where the distribution of this spatial area were: 30.59 km2, 40.79 km2, 32.89 km2, 13.54 km2 and 6.77 km2 to the impact levels of very high, high, moderate, low and very low; respectively. This means that approximately 57% (71.38 km2) of the flooded zones were subjected to high magnitude of catastrophism due to floods and torrents.
4. Conclusions
It is clearly appeared that the Arabian Peninsula is being located under new climatic conditions, represented mainly by torrential rainfall. This was obviously noticed from the frequent natural disaster events and more certainly from intensive rainfall over different parts of the region. The degree of impact is found to be high and rarely such events pass by without negative consequences in human being and nature [15].
The physical setting of study area exhibits its vulnerability to flooding process, notably the dense drainage systems, with almost a gentle sloping terrain and narrow valley cross-section in along some valleys. Added to these physical properties in the area, the accumulation of variable and thick deposits of sand and alluviums along valley courses has an essential role in catalyzing the flood hydrologic process.
Anthropogenic influence raised the negative consequence to the maximum; especially the chaotic urban expansion along watercourses and at the outlet downstream where human settlements have been recently constructed without considering any prior vulnerability assessment for natural hazards. This was obvious from the lack of comprehensive and appropriate engineering practices, which are sometime totally absent in different parts in the area of concern.
The study proved the useful applications of new techniques of space tools and GIS, which are capable to extract data and information in comprehensive vision, thus the ability to analyzed this data and manipulating it for easier approach of understanding. This was confirmed from the results obtained in field verification, which was compared with data extracted from satellite images, with a correlation coefficient (R2) of 0.87. Therefore, relying on the resulting outputs from this study, it is recommended to apply similar studies for flood hazard assessment on different parts of the Saudi Arabia by following the same approach applied in this study.
REFERENCES
- IPCC Report. The Fourth Assessment Report (AR4), 2008. http://www.ipcc.ch/
- V. Sing, “Environmental Hydrology,” Kluwer Academic Publishers, Dordreccht, 1995.
- Y. Tardy, “Le cicle de l’eau, Climates, Paleoclimats et Geochemie Global,” Masson, Paris, 1986.
- EM-DAT: The OFDA/CRED International Disaster Database, Université catholique de Louvain, Brussels, Bel. Data version: v11.08, 2010. http://www.emdat.be/
- E. Wohl, “Mountain Rivers,” American Geophysical Union, Washington DC, 2000, p. 321.
- M. Al Saud, “Mapping Flood-Prone Areas in Jeddah and Its Surroundings,” Unpublished Technical Report, 2010.
- D. Gorden, A. McMahon and L. Finalson, “Stream Hydrology,” John Wiley & Sons Ltd, Chichester, 1992.
- P. Black, “Watershed Hydrology,” Prentice Hall Advanced Reference Series, New Jersey, 1991, p. 324.
- R. Chorley, S. Schumm and D. Sugden, “Geomorphology,” Methuen and Co., London, 1984, p. 607.
- I. Diadoveski, M. Antanassova and V. Simeonov, “Risk Assessment of Extreme Events along River Flow,” Journal of Water and Research and Protection, Vol. 2, No. 5, 2010, pp.455-461.
- W. Kates and X. Kasperson, “Comparative Risk Analysis of Technological Hazards (a review),” Proceedings of National Academy of Science, USA, 1983, pp. 7027-7038.
- J. Linsley, M. Kohler and J. Paulhus, “Hydrology for Engineers,” Mc Graw-Hill, Singapore (SI Metric Edition), 1988, p. 492.
- W. Skiba and C. Gilboy, “Geology of the RabighKhulyas Quadrangle, 22/39, Kingdom of Saudi Arabia,” Unpublished manuscript in General Directory of Mineral Resources, 1975, p. 597.
- A. Moor and M. AL-Rehaili, “Geological Map of Makka Quadrangle Sheet 21D,” Ministry of Petroleum and Mineral Resources, Kingdom of Saudi Arabia, 1989.
- M. Al Saud, “Use of Space Techniques and GIS to Study Jeddah Flood,” Unpublished Technical Report, 2009, p. 52.