Journal of Water Resource and Protection
Vol. 2 No. 6 (2010) , Article ID: 2085 , 9 pages DOI:10.4236/jwarp.2010.26066
Statistical Analysis of Groundwater Table Depths in Upper Swarnamukhi River Basin
1Department of Civil Engineering, Sri Venkateswara University College of Engineering,
Tirupati, India
2Department of Civil Engineering, N.B.K.R. Institute of Science and Technology, Vidyanagar, India
E-mail: jasmin_i@rediffmail.com
Received January 17, 2010; revised March 3, 2010; accepted April 20, 2010
Keywords: Multiple Linear Correlation, Partial Correlation Coefficient, Root Mean Square Error, Efficiency Coefficient
ABSTRACT
Development and effective utilization of groundwater resources is essential in semi-arid regions for activities such as water supply and irrigation. The present study aims to analyze statistically the groundwater data at the Chinnagottigallu, Yerravaripalem, Chandragiri, Sriramapuram, Tirupati, Renigunta, Karvetinagaram and Yerpedu piezometric stations of upper Swarnamukhi river basin in the drought prone Rayalaseema region of Andhra Pradesh, India and to develop models through multiple linear correlation and regression analysis. The monthly rainfall and groundwater data at the raingauge and piezometric stations of the basin for the period 2001-2006 were collected from the Groundwater and Irrigation Departments of the region. It is observed from the analysis that the groundwater table depth in any period is influenced by the rainfall in the period and, the rainfall and groundwater table depth in the previous period. The study also reveals that the effect of antecedent groundwater table depth is more pronounced than that of rainfall and antecedent rainfall. The models proposed may be adopted for the estimation of groundwater table depths to effectively plan and efficiently manage groundwater resources of the basin.
1. Introduction
Groundwater constitutes the largest available source of water for water supply and irrigation in semi-arid regions and therefore the development and utilization of groundwater resources is of great interest to meet these requirements. As rainfall is the primary source of recharge for many aquifers, variations of rainfall and groundwater table depth are closely related. However, the correlation may sometimes be imperfect because differences in rainfall intensity and distribution produce different amounts of recharge for the same amount of rainfall. Therefore proper understanding of the groundwater status is important in order to meet the increasing demand due to growing population and urbanization, and to formulate future development and management strategies.
Satistical analysis of water table data carried out at Powarkheda in Hoshangabad District of Madhya Pradesh, India [1] suggested the optimum utilization of open wells, putting the area to high water requiring crops and minimizing canal seepage and other losses to prevent water logging. A water balance and groundwater flow model [2] was proposed to develop groundwater draft/recharge maps for planning groundwater development of Ponnaiyar river basin of Karnataka state, India. The studies [3,4] carried out on the rejuvenation of Swarnamukhi basin suggested the construction of rainwater harvesting structures for improving the groundwater potential of the basin. The groundwater development studies in the Koyna river basin in Maharashtra, India [5] suggested artificial recharge measures for water scarce areas. The pattern of water level fluctuations in different physiographic regions of Nileshwar river basin in Kasargod District of Kerala state, India was studied [6] and concluded that the Nileshwar basin is ‘SAFE’ for future groundwater development. The study conducted on the groundwater status in Dhund river basin in Jaipur District of Rajasthan, India [7] recommended proper groundwater management strategies to stabilize the declining trend of water levels.
2. Study Area and Data
The Swarnamukhi, an ephemeral river, spreading over a catchment area of 3092 km2 is bounded by latitudes 13025'30" N and 14008'30" N and longitudes 79007'39"E and 80011'E in Chittoor and Nellore Districts of Andhra Pradesh, India as shown in Figure 1. It originates at the Pakala Mandal of Chittoor District, flows in a northeasterly direction and finally joins the Bay of Bengal. The upper Swarnamukhi basin covering an area of 2217 km2 lying in Chittoor District has been selected for the present groundwater study. The area falls under semi-arid climate. The maximum, minimum and mean temperatures are 440.18C, 120.48C and 270.49C respectively. The maximum, minimum and mean wind speeds at 3 m height are 18.15 kmph, 5.14 kmph and 9.72 kmph respectively. The average annual rainfall is about 920 mm. The drainage pattern is dendritic to subdendritic.
The area under irrigation in Chittoor District, drought prone area of Rayalaseema region of Andhra Pradesh, is about 2.02 lakh hectares which mainly depends on groundwater as there are no major irrigation projects. The groundwater in the basin over a period of time has been overexploited leading to water scarcity and deterioration of its quality. Degradation of catchment area, indiscriminate groundwater use, erratic rainfall and sand quarrying are some of the causes for the present status. The present study aims to analyze the groundwater table depths statistically and develop models through multiple linear correlation and regression analysis to estimate the groundwater table depths for better planning and management of groundwater resources.
The monthly groundwater table depth and rainfall data at Chinnagottigallu (Cgg), Yerravaripalem (Yvp), Chandragiri (Cgr), Sriramapuram (Srp), Tirupati (Tpt), Renigunta (Rng), Karvetinagaram (Kvt) and Yerpedu (Ypd) piezometric and rainguage stations located in the basin as shown in Figure 1 for the period 2001-2006 were collected from the Groundwater and Irrigation Departments respectively, and used for the model development. Tables 1 and 2 present the rainfall and groundwater table depths at the raingauge and piezometric stations respectively. The groundwater table depth data showed that there is no systematic trend with rainfall as the processes are complex exhibiting high degree of both spatial and temporal variability. The model coefficients, however, may be updated to obtain the refined models for better forecasting accuracy.
3. Model Development
An association of three or more variables is best investigated by multiple regression and correlation analysis. Since linear equations are easier to treat than nonlinear equations, variables of nonlinear relations in hydrology are often transformed to linear relations for the purpose of development of a multiple regression model. If there are m variables to correlate, including one dependent and (m-1) independent variables, the multiple linear regression model is generally expressed as (1).
X1 = b1 +b2 X2 + b3X3 + …+ biXi + … + bmXm(1)
in which b1 is the intercept and bi (i = 2,3, …, m) are the multiple regression coefficients of the dependent variable X1 on the independent variable Xi (I = 2,3, …, m) with all other variables kept constant.
Applying the least squares method of the sum of residuals, the m partial differential equations in b1, b2, …, and bm yield m linear equations. The solution of these equations facilitates determination of m parameters.
3.1. Linear Regression Model
In the present study, the monthly groundwater table depth model at a piezometric station is developed using the rainfall, antecedent rainfall and antecedent ground water table depth data of the piezometric station under consideration and also the piezometric stations upstream. The steps in the modeling include 1) identification of influencing parameters 2) development of a model and 3) performance evaluation of the model developed.
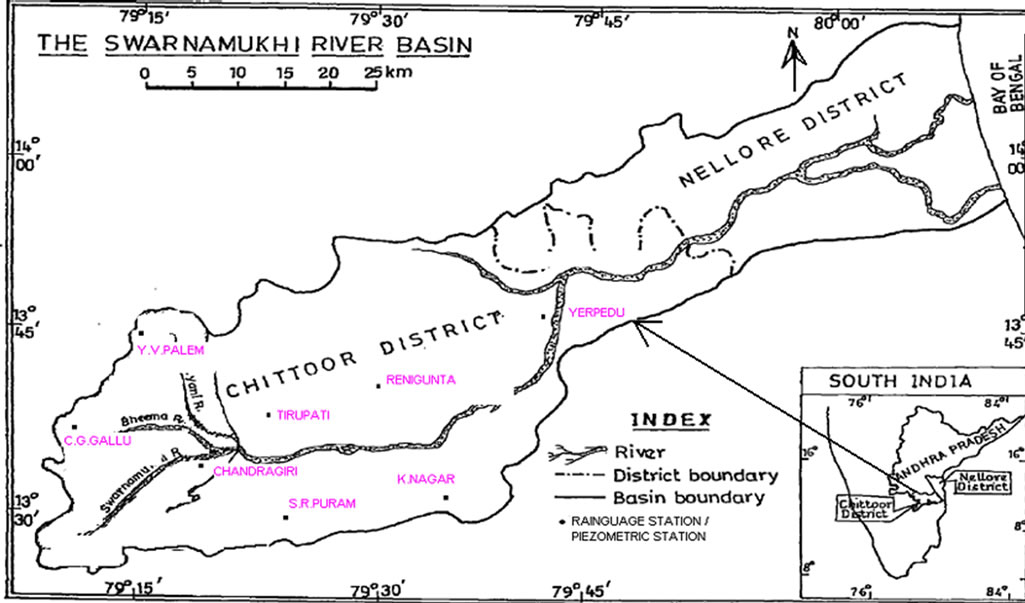
Figure 1. Location map of Swarnamukhi river basin.
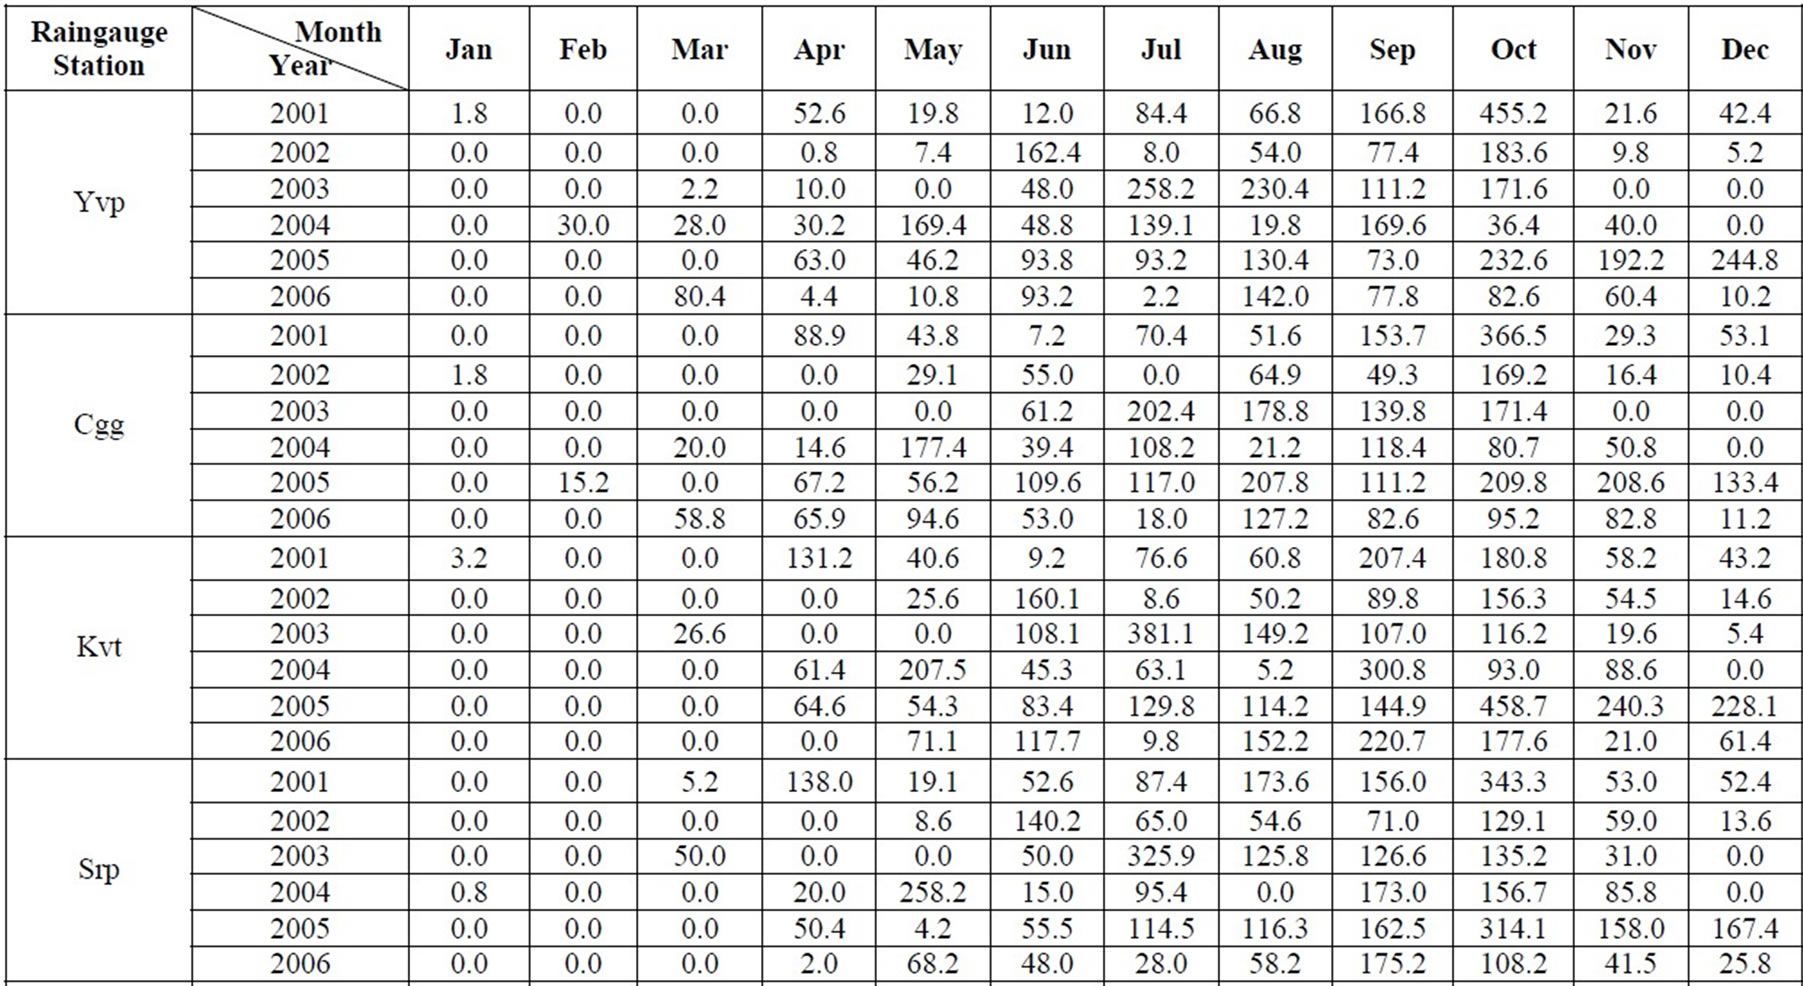
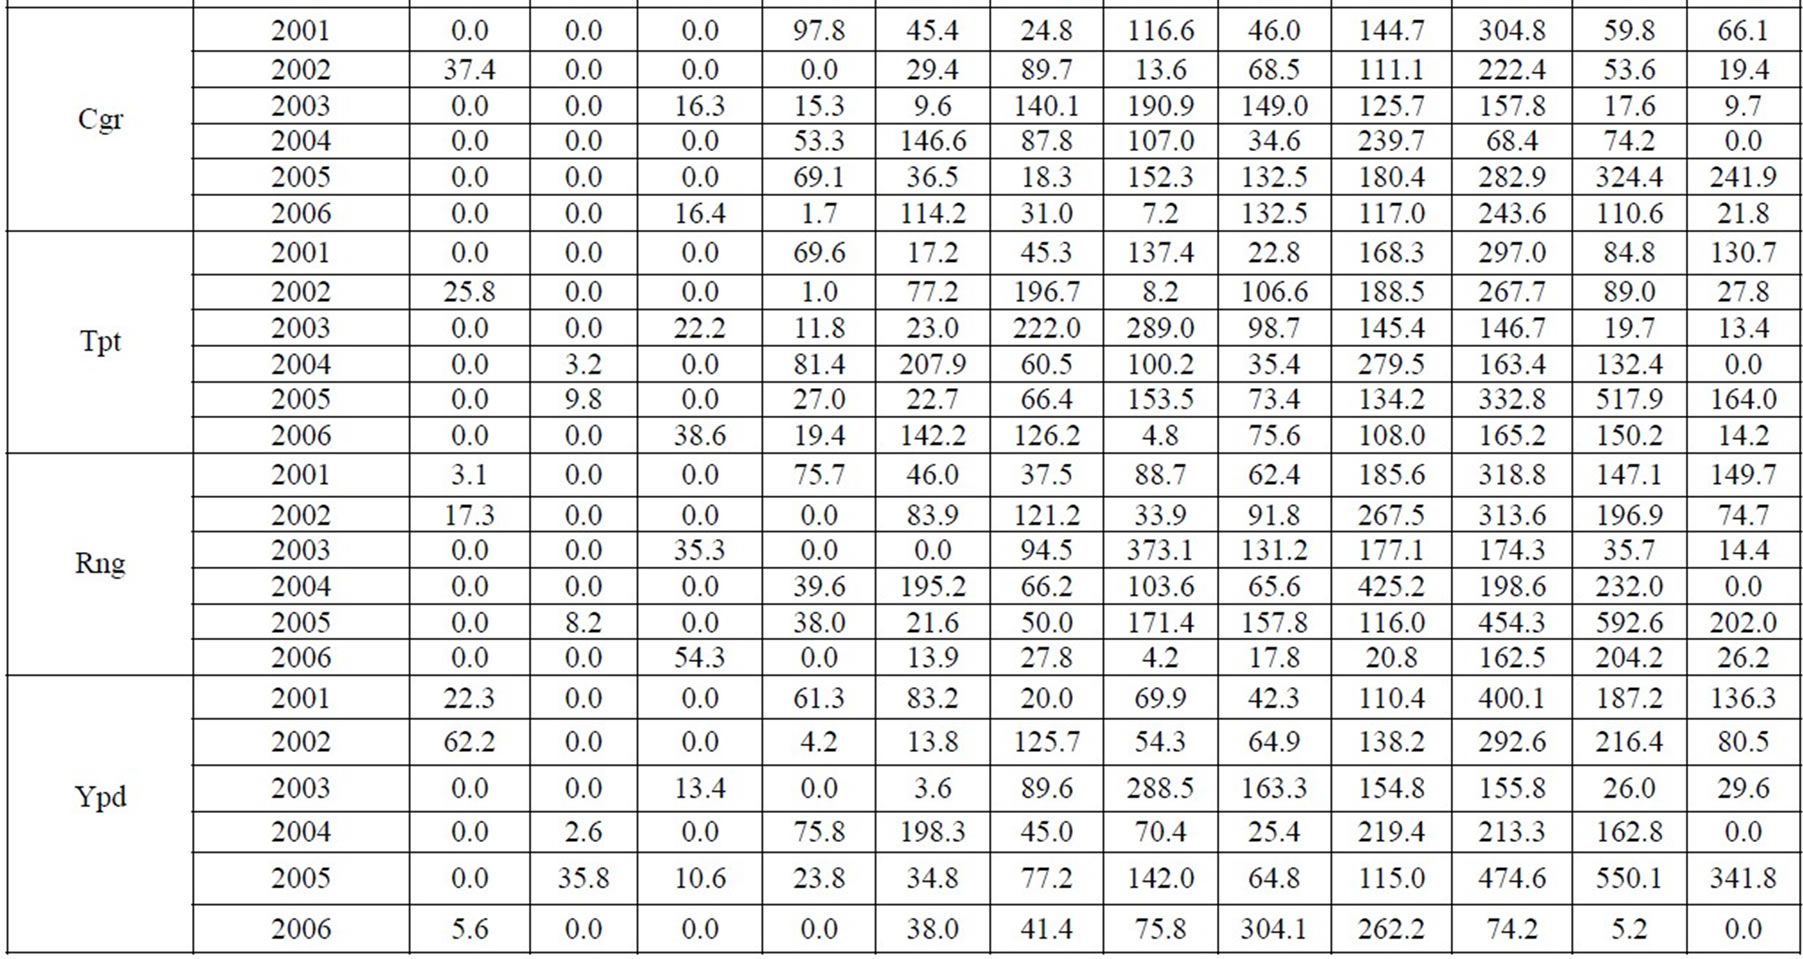
Table 1. Monthly rainfall in mm at piezometric stations.
3.1.1. Identification of Influencing Parameters
The identification of influencing parameters is based on multiple correlation analysis. The values of multiple and partial correlation coefficients indicate the degree of influence of independent variables on the dependent one.
3.1.2. Development of Model
The linear regression model in terms of influencing parameters is expressed as a simple linear model as (2).
Gt = b1 +b2Rt + b3Rt-1 + b4Gt-1 + b5Gt-1(us1) + b6Gt-1(us2) +…(2)
where Gt is the groundwater depth in m in the tth month, b1, b2, … are empirical constants, Rt is the rainfall in mm in the tth month, Rt-1 is the antecedent rainfall in mm and Gt-1 is the antecedent groundwater depth in m at the stations. Gt-1(us1), Gt-1(us2), … are the groundwater table depths at the piezometric stations on the upstream of the
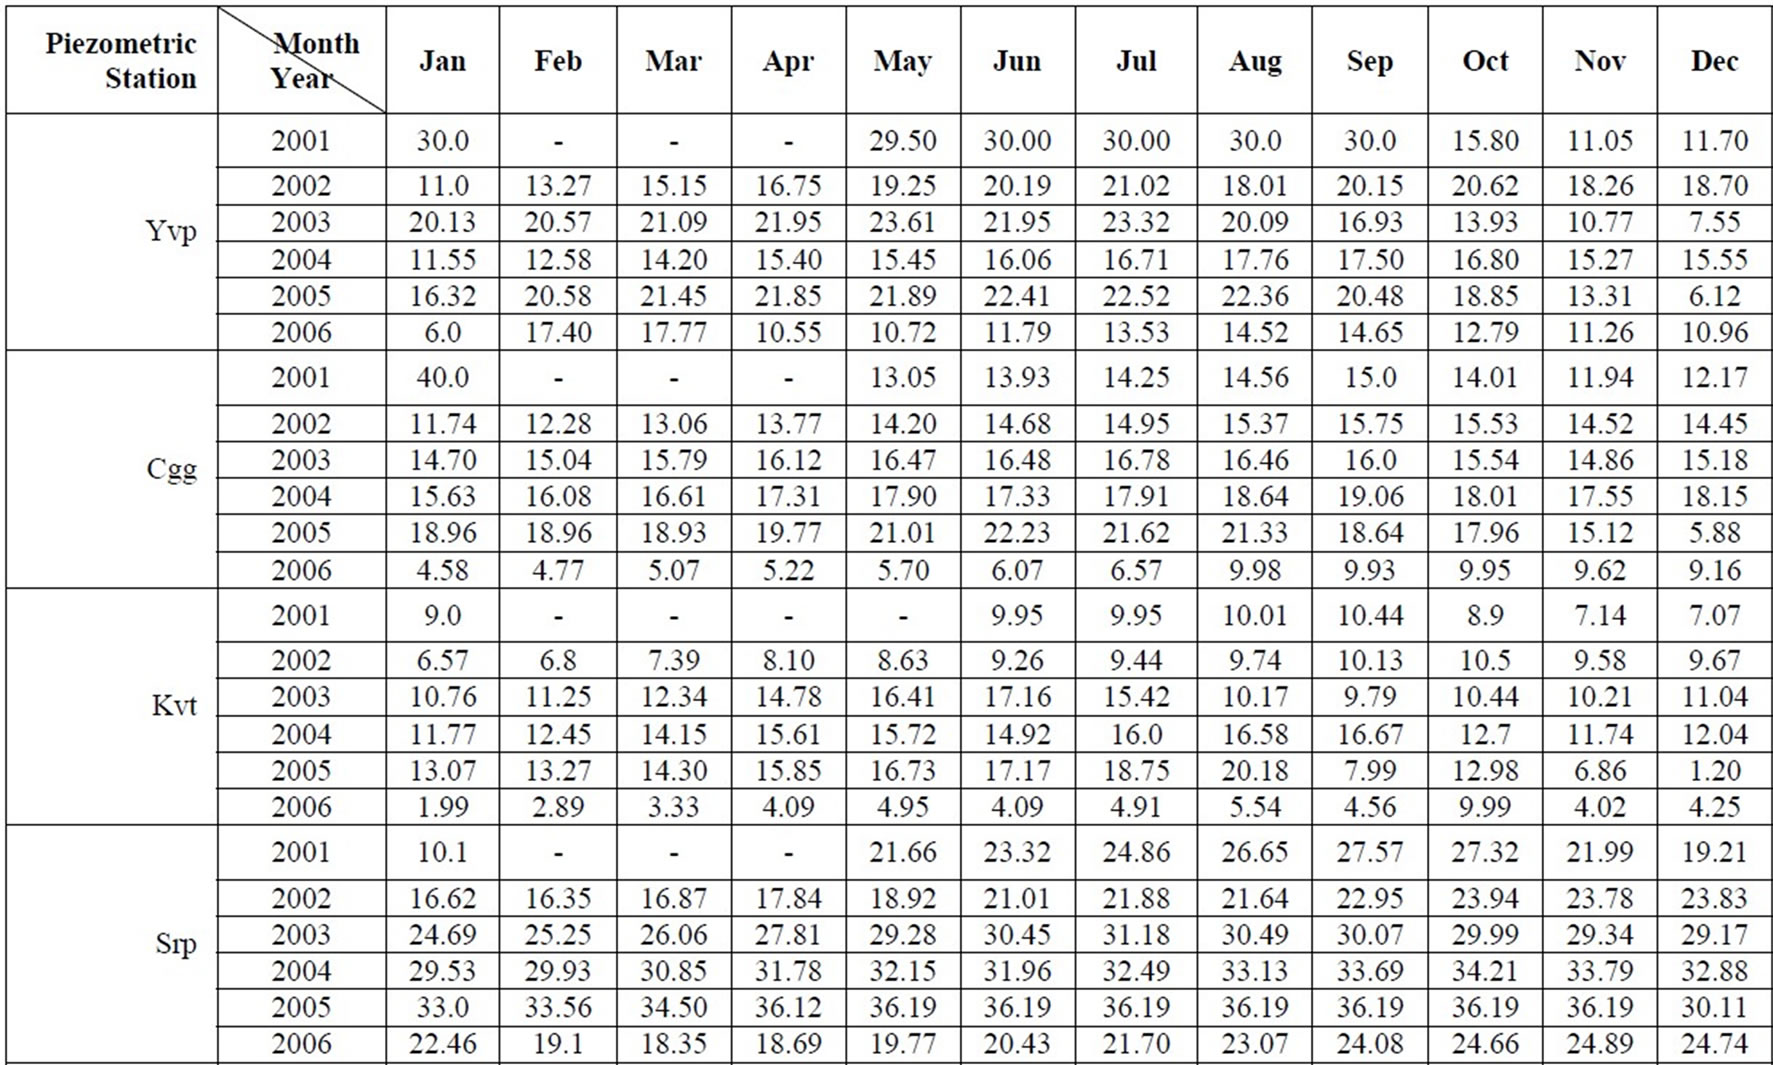
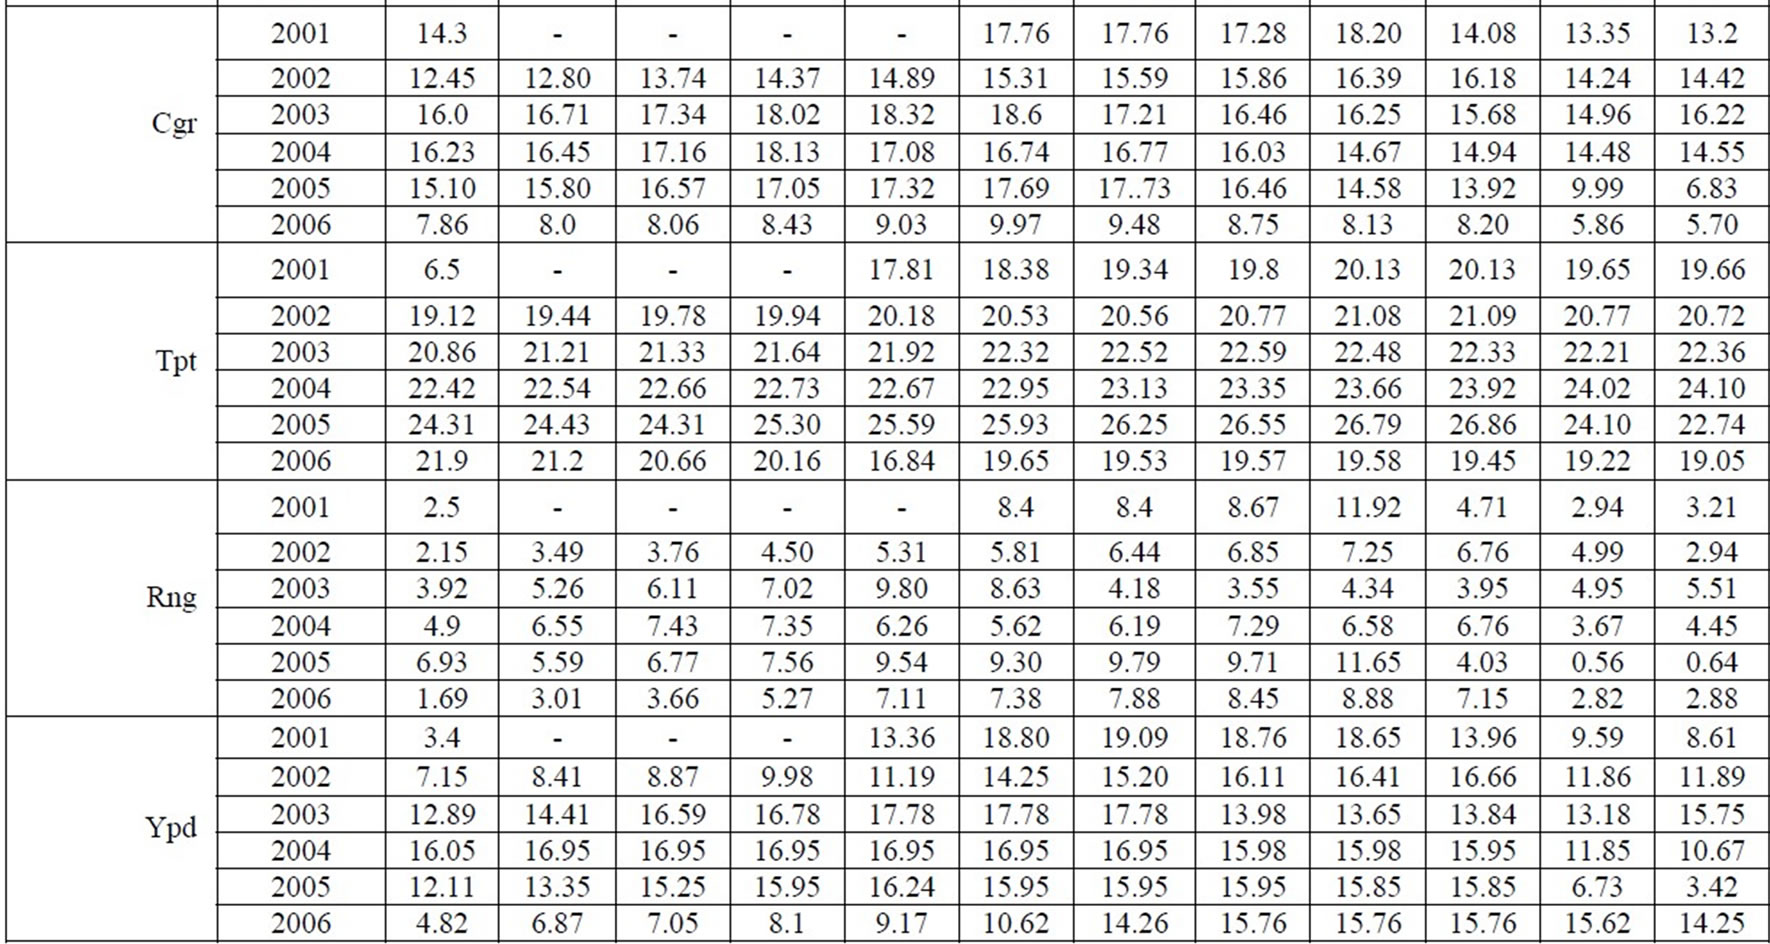
Table 2. Monthly groundwater table depth in m at piezometric stations.
piezometric station under consideration.
3.1.3 Performance Evaluation Criteria
The performance of the model is verified through selected performance evaluation criteria as explained below. Out of the several numerical model performance indicators, the coefficient of determination (R2), root mean square error (RMSE) and efficiency coefficient (EC) are chosen for the present study. The scatter plot of the observed versus estimated groundwater table depths is selected as a graphical indicator.
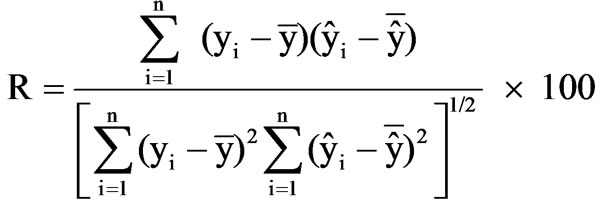
Coefficient of Determination (R2): It is the square of the correlation coefficient (R) and the correlation coefficient is expressed as (3).
 (3)
(3)
where yi and  are the observed and estimated values respectively and,
  and
and  are the means of observed and estimated values.
Root Mean Square Error (RMSE): It yields the residual error in terms of the mean square error and is expressed as (4).
RMSE = 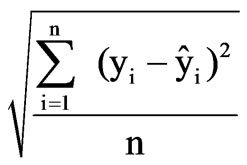 (4)
(4)
where n = number of observations.
Efficiency Coefficient (EC): It is used to assess the performance of the models and is given by (5).
EC = 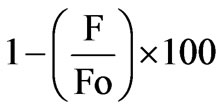 (5)
(5)
where F0 =  and F =
A value of EC of 90% generally indicates a very satisfactory model performance while a value in the range 80-90%, a fairly good model. Values in the range 60-80% would indicate an unsatisfactory model fit.
4. Results and Discussion
The groundwater table depth in any month at a piezometric station of upper Swarnamukhi basin is correlated with the rainfall of the month, antecedent rainfall and antecedent groundwater table depth at the station and also at the stations upstream. The measures of correlation such as multiple correlation coefficients and partial correlation coefficients have been computed and presented in Table 3. The high multiple correlation coefficients (Tables 3 and 4) indicate that the monthly groundwater table depth at any station can better be correlated with rainfall, antecedent rainfall and groundwater table depths of the station and the upstream stations. The partial correlation coefficients, which measure the extent of association of independent variable with the dependent one indicate that the effect of antecedent groundwater table depth at the station is more pronounced than that of rainfall and antecedent rainfall. This may be due to the fact that the groundwater in the basin may be overexploited at the rates of withdrawal more than critical, because of scanty rainfall and degradation of catchment during the period. It may also be observed from Table 4 that there is only marginal improvement in the correlation when the effect of groundwater table depths at the piezometric stations upstream of the station under investigation is also included in the analysis due to local dyke formations.
The linear regression models in terms of influencing parameters are presented in Table 5. The scatter plots of observed versus estimated groundwater table depths are shown in Figure 2.
The results of the study have been evaluated through R2, RMSE and EC as presented in Table 6. The higher values of R2 and EC and, low values of RMSE indicate that the regression models developed are fairly good and yield satisfactory results. Therefore the regression models developed may be adopted for the reasonable estimation of groundwater table depths at the piezometric station based on rainfall, antecedent rainfall and antecedent groundwater table depth for effective planning and management of groundwater resources of the basin.
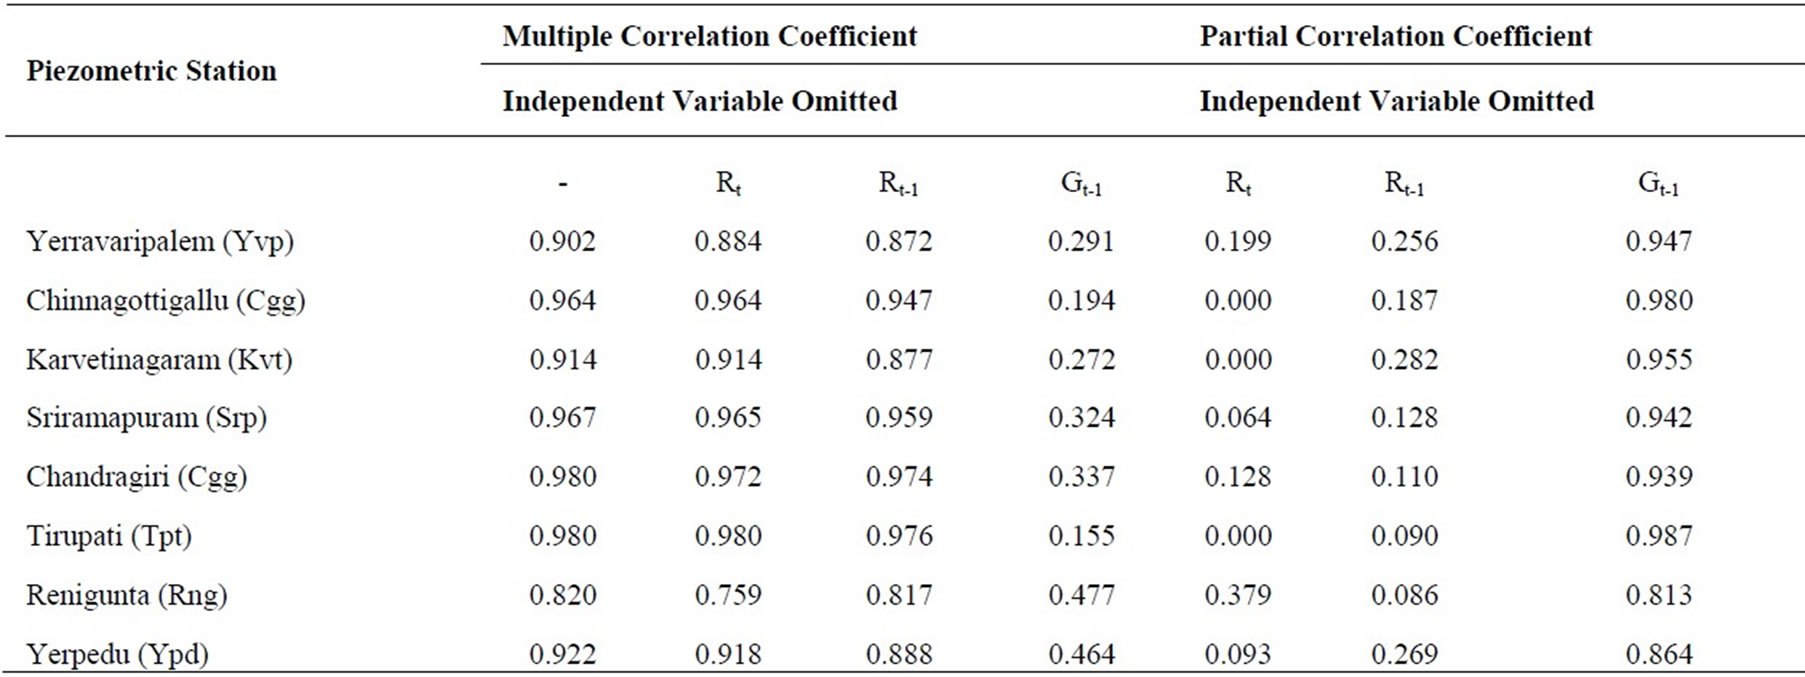
Table 3. Measures of multiple linear correlation.
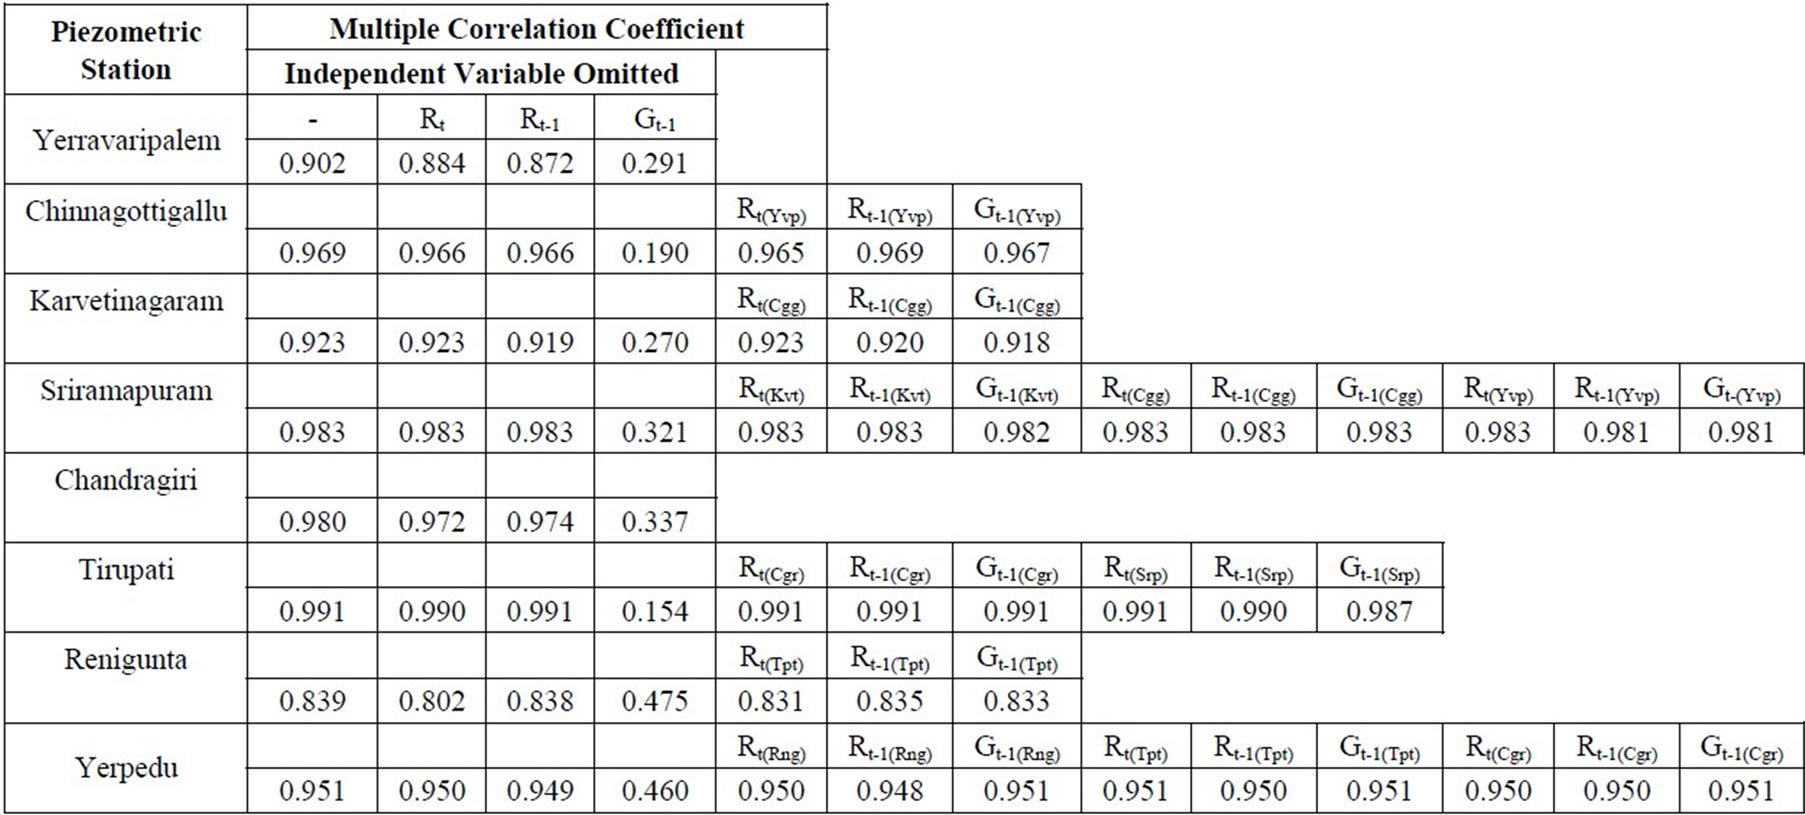
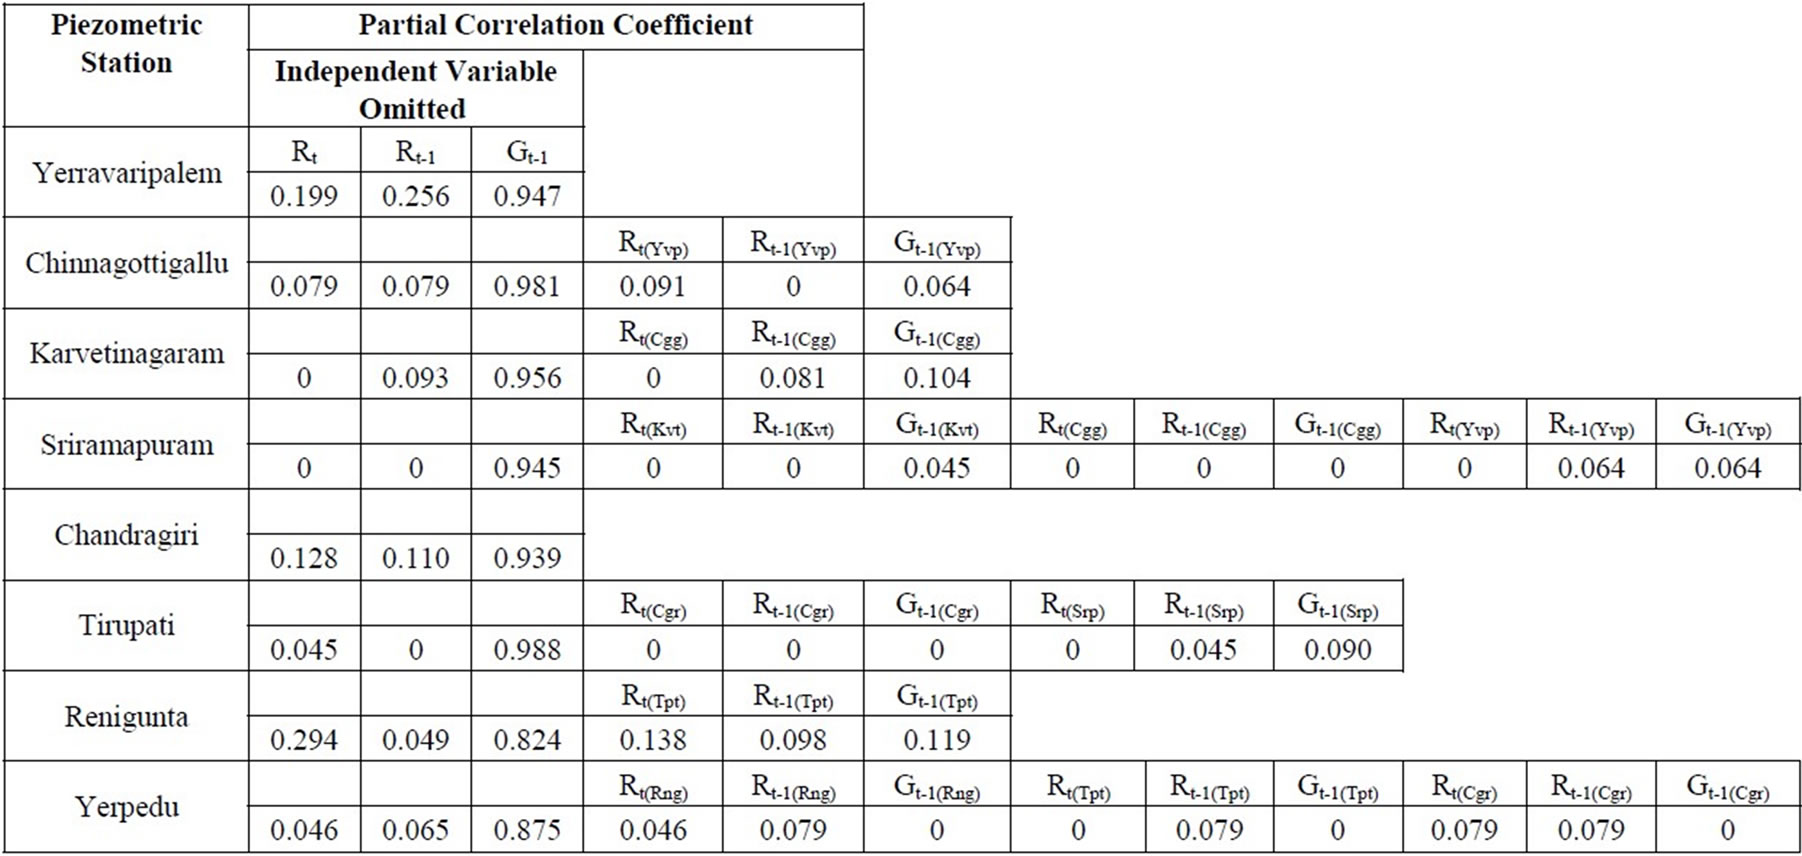
Table 4. Measures of multiple linear correlation (Effect of groundwater table depths of upstream piezometric stations also considered).
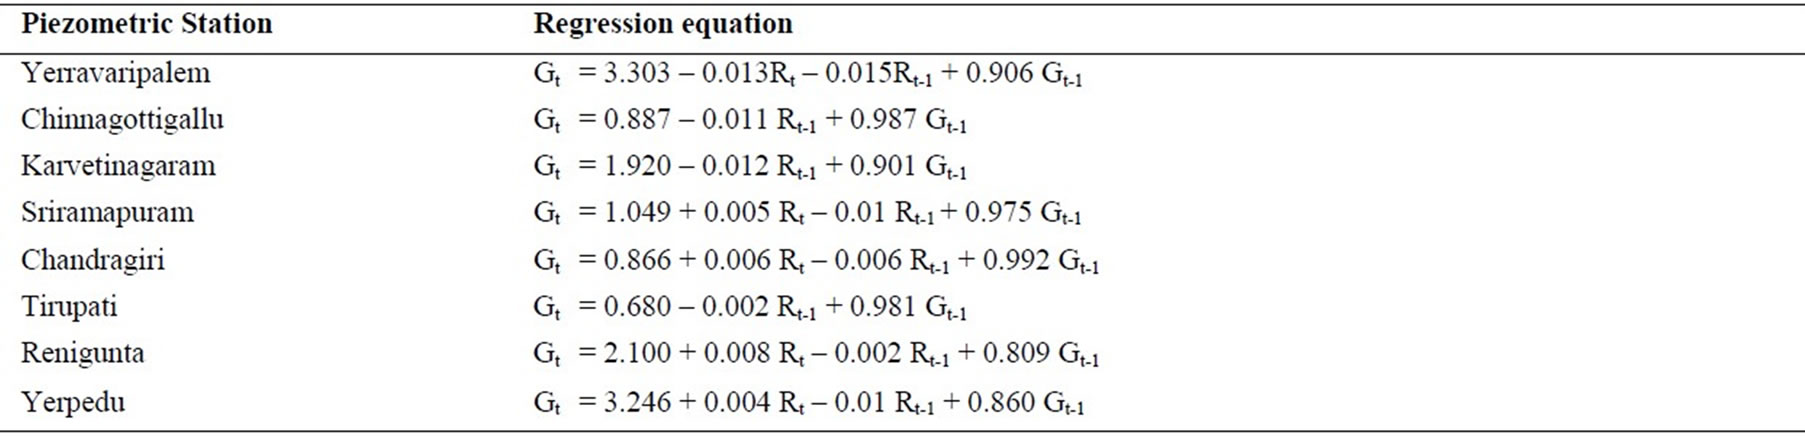
Table 5. Regression equations.
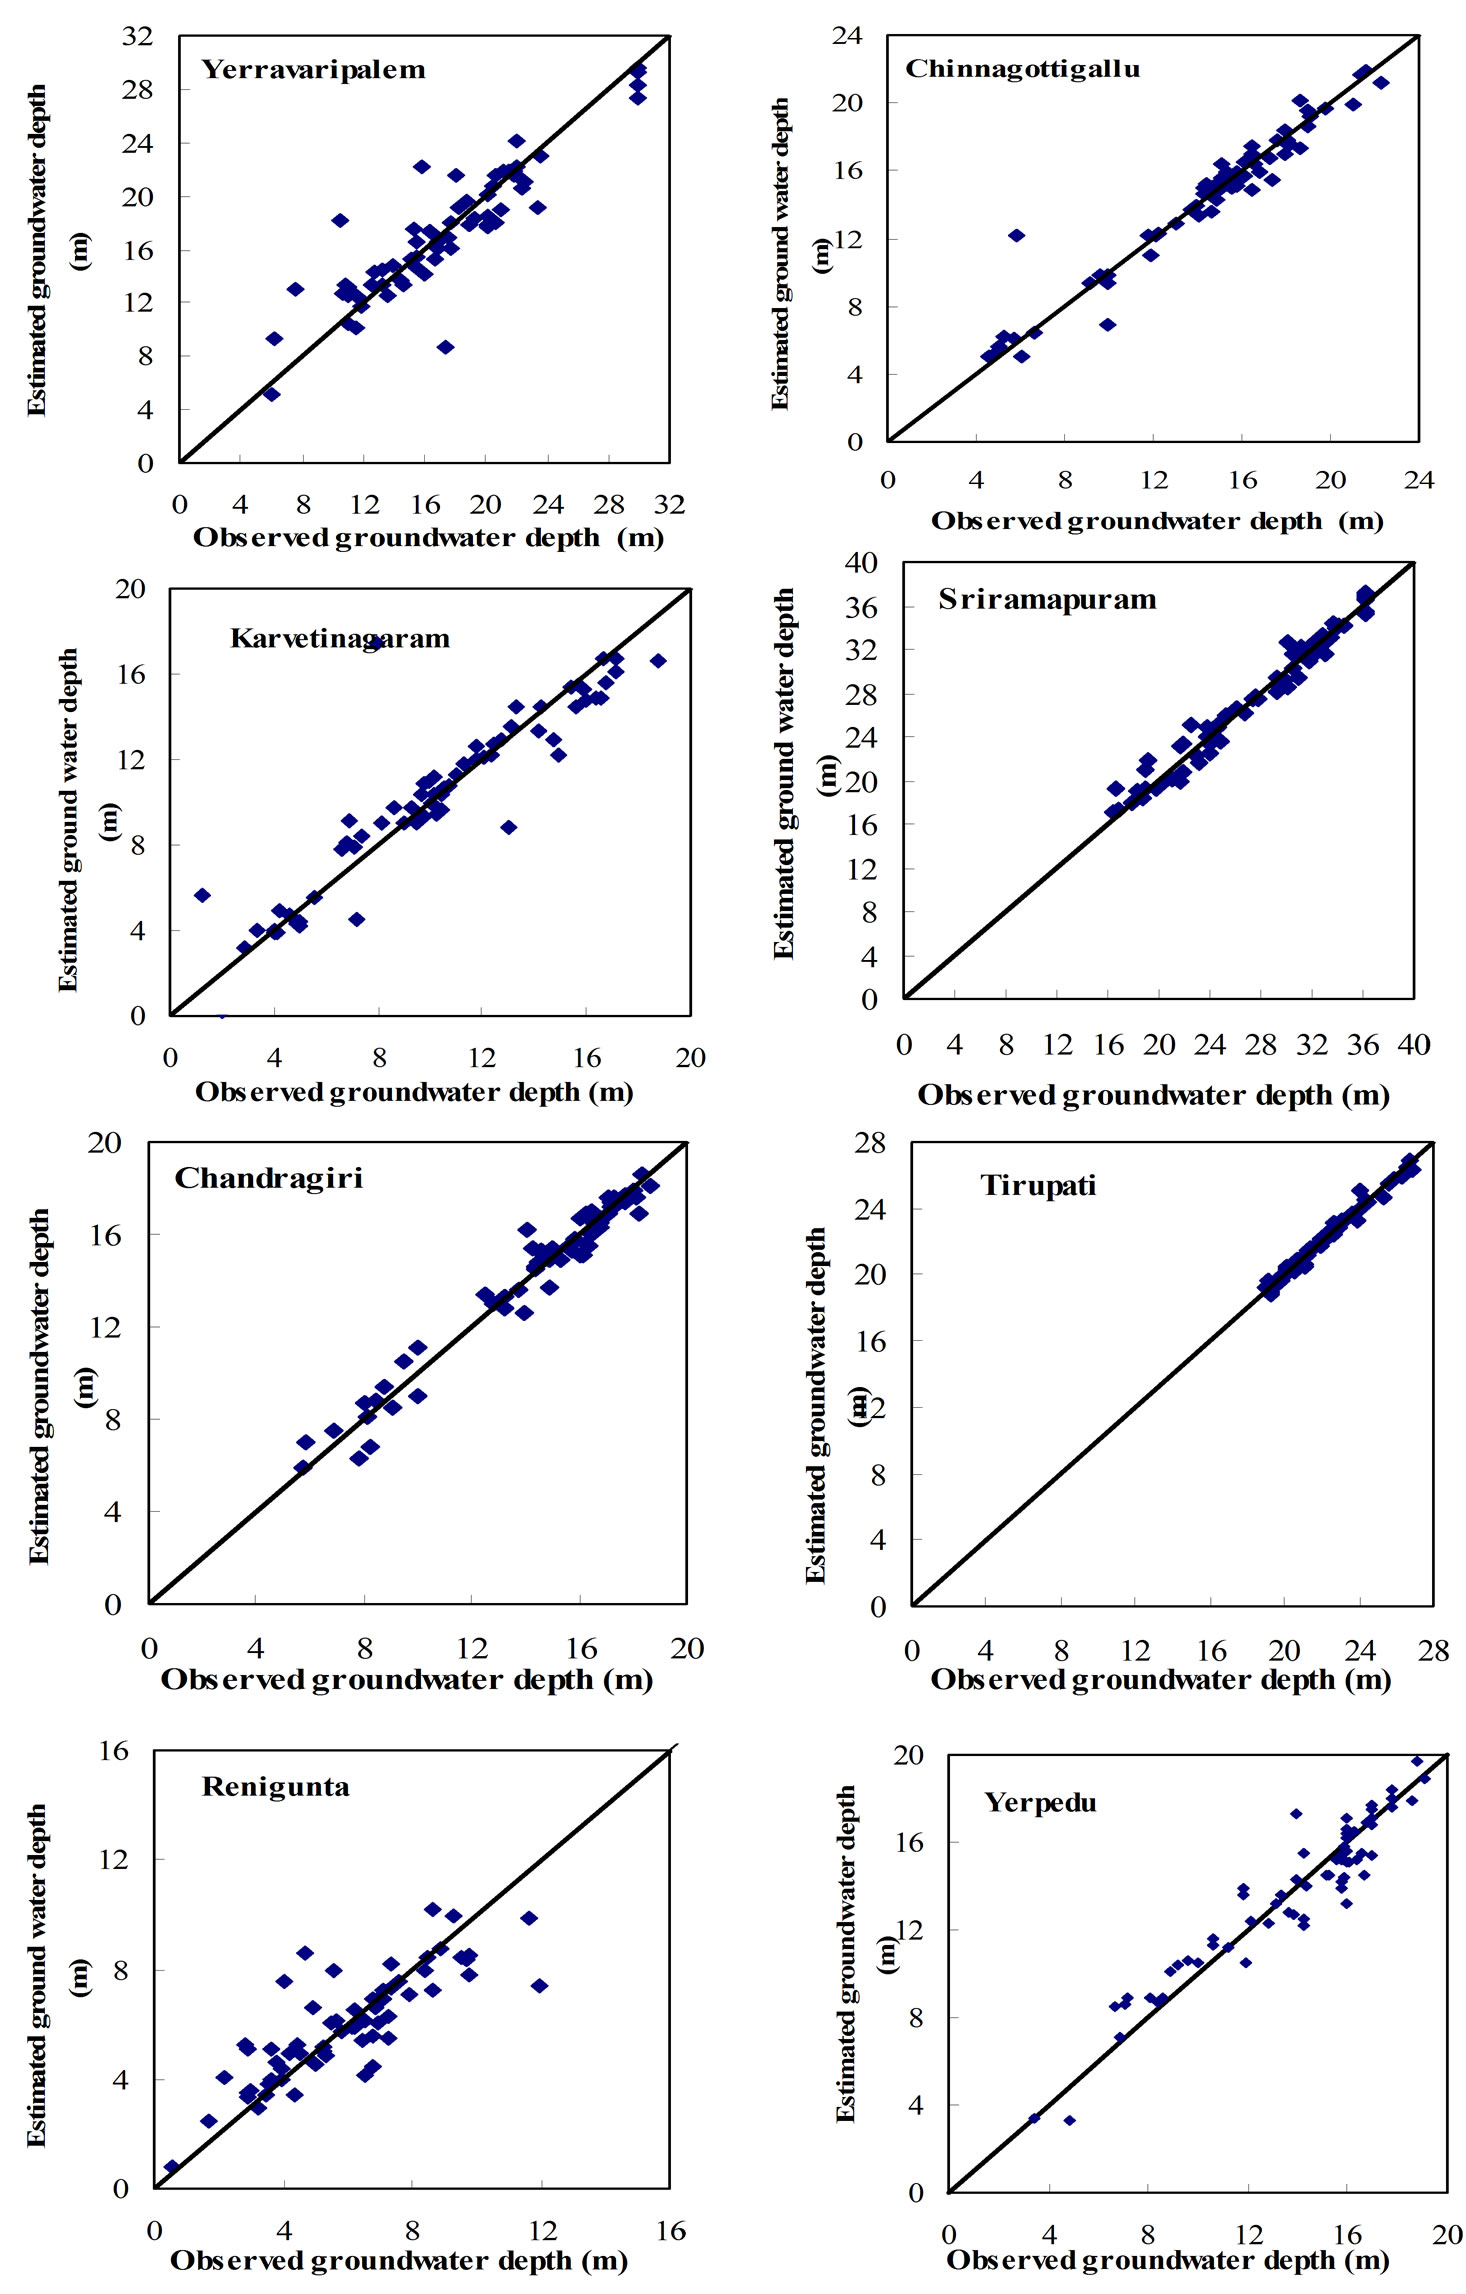
Figure 2. Comparison of observed and estimated groundwater table depths.
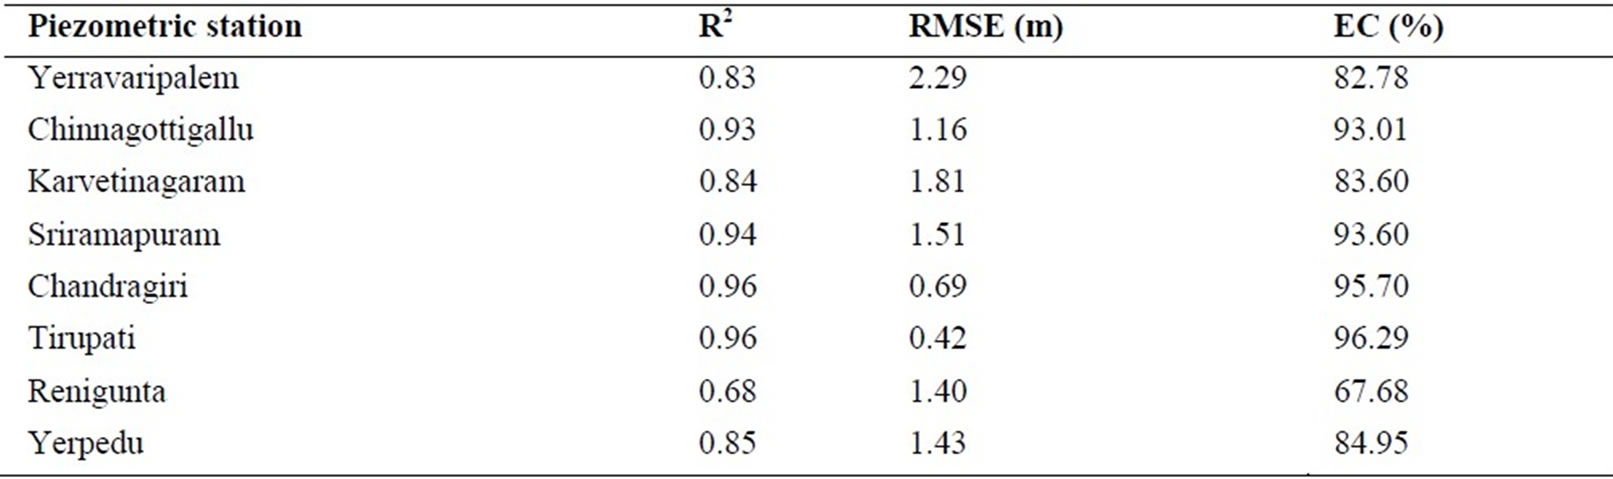
Table 6. Performance evaluation indicators.
5. Conclusions
The multiple linear correlation analysis has been carried out to study the influence of rainfall, antecedent rainfall and antecedent groundwater table depth on groundwater depth in the upper Swarnamukhi river basin. The influencing variables have been selected based on the measures of multiple linear correlations. It is observed that the rainfall, antecedent rainfall and antecedent groundwater table depth influence the groundwater table depth significantly. Further, the effect of antecedent groundwater table depth is more pronounced than that of rainfall and antecedent rainfall. The relationships proposed may be adopted to predict the groundwater table depths to a reasonable degree of accuracy for better planning and management of groundwater resources of the basin.
6. Acknowledgements
One of the authors, I. Jasmin, thanks Council of Scientific and Industrial Research, New Delhi, India for granting Senior Research Fellowship to pursue research on groundwater.
REFERENCES
- K. K. Mishra, “Statistical Analysis of Water Table Data at Powarkheda,” Journal of the Institution of Engineers,
- India, Vol. 74, No. FEV, February 1994, pp. 213-215.
- S. V. N. Rao and K. S. Ramasastri, “Estimation of Groundwater Draft and Recharge in Coastal Aquifers Using Field Data,” The Indian Society for Hydraulics, Journal of Hydraulic Engineering, Vol. 6, September 2000, pp. 9-17.
- H. D. Singh, P. Munirathnam, V. K. Chetty and T. V. K. Reddy, “A Study on the Rejuvenation of Swarnamukhi River through Water Harvesting Structures (Subsurface Dams),” Proceedings of International Groundwater Conference on Sustainable Development and Management of Groundwater Resources in Semi-Arid Region with Special Reference to Hard Rock, Dindigul, Tamil Nadu, February 2002, pp. 239-248.
- N. J. Raju, T. V. K. Reddy and P. Munirathnam, “Subsurface Dams to Harvest Rainwater - A Case Study of the Swarnamukhi River Basin, Southern India,” Hydrogeology Journal, Vol. 14, No. 4, April 2006, pp. 520-531.
- P. K. Naik and A. K. Awasthi, “Groundwater Resources Development in the Koyna River Basin,” Journal of India Water Resources Society, Vol. 25, July 2005, pp. 25-32.
- N. B. N. Prasad, E. A. Hameed, B. Sivakumar and S. Michael, “Groundwater Development Status in Lakshadweep - A Case Study,” The Indian Society for Hydraulics, Journal of Hydraulic Engineering, Vol. 12, No. 1, September 2006, pp. 25-36.
- A. K. Sinha, R. P. Singh and A. Kumar, “Groundwater Status in Dhund River Basin, Jaipur District, Rajasthan,” Journal of Geological Society of India, Vol. 68, No. 5, November 2006, pp. 809-818.