Journal of Biomedical Science and Engineering
Vol.6 No.3A(2013), Article ID:29554,10 pages DOI:10.4236/jbise.2013.63A048
Probabilistic tractography of the posterior subthalamic area in Parkinson’s disease patients
SHAPE \* MERGEFORMAT ![]()
1Neurobiology Institute, UNAM Campus Juriquilla, Juriquilla, Querétaro, México
2National Institute of Psychiatry “Ramón de la Fuente Muñiz”, México City, México
3Unit for Stereotactic and Functional Neurosurgery and Radiosurgery, México General Hospital, México City, México
Email: *slanfe@prodigy.net.mx
Received 25 January 2013; revised 26 February 2013; accepted 6 March 2013
Keywords: Parkinson Disease (PD); Posterior Subthalamic Area (PSA); Tractography; Track-Density Images (TDI)
ABSTRACT
Deep brain stimulation (DBS) is a non-pharmacological treatment for Parkinson’s disease (PD), and its efficacy depends largely on which anatomical structure (target) is stimulated. The subthalamic nucleus (STN) is one of the most commonly used targets, but stimulation of new targets within the posterior subthalamic area (PSA), comprising a group of white matter fibers known as prelemniscal radiations (Raprl), as well as the caudal zonaincerta nucleus (Zic), have proven to be superior at improving certain clinical symptoms. Despite their clinical usefulness, their anatomical connectivity has not been completely described in humans. We performed constrained spherical deconvolution of the signal in diffusion-weighted images and subsequent tractography as a means to non-invasively define the connectivity of the Raprl and Zic in a group of five patients with PD. Further, we used track-density imaging, a novel method to improve the spatial resolution of the acquired images, in order to visualize the small subregions that comprise the PSA with a voxel resolution of 0.2 × 0.2 × 0.2 mm3. Both Raprl and Zic demonstrated high probability of connectivity with the dorsal brainstem, cerebellum, subcortical nuclei (globus pallidum ventral, lateral thalamic nuclei), and cortical areas (orbitofrontal cortex, primary and supplementary motor cortex areas). The connectivity patterns were reproducible between patients and were discretely organized as the tracts entered/exited the PSA, depending on their end points. These findings indicate that the PSA is part of the neuronal circuitry controlling movement, and the precise characterization of its connectivity will aid in our understanding of the networks involved in PD and how they can be modulated with DBS in order to alleviate symptoms.
1. INTRODUCTION
Deep brain stimulation (DBS) has been used for movement disorders with great success over the last 30 years, mainly due to its reversible and adjustable nature [1]. The most sought-after anatomical locations amenable for stimulation (henceforth “targets”) include the subthalamic nucleus, the pedunculo-pontine nucleus, the globus pallidum and ventral lateral thalamic nucleus, but previous studies also have demonstrated great improvement of certain Parkinson’s disease (PD) symptoms when DBS is applied to the posterior subthalamic area (PSA) [2-5].
DBS applied within the PSA (which lies below to the last third of the intercommissural line) is more efficient in ameliorating tremor than any other target [2,6,7]. Microelectrode recordings during DBS electrode placement have shown that the target within the PSA that produces the largest improvement of tremor and also is more effective for rigidity [5] comprises white matter fibers, and not gray matter; the bundles involved correspond to what is known as the prelemniscal radiations (Raprl) [5,8]. A grey matter nucleus lies just lateral to the Raprl, and it is called the caudal zonaincerta (Zic), which has also been used to treat PD motor symptoms and essential tremor [9]. Despite their clear clinical significance, the precise identity and function of the fiber systems that traverse the Raprl and the connectivity of the Zic remain unknown.
Different approaches for functional surgery planning exist, the most common being direct visualization of the intended target by Magnetic Resonance Imaging (MRI) using T2-weighted spin echo or inversion recovery images [10]. The subthalamic nucleus (STN), like other gray matter nuclei, appears as a hypointense signal in T2- weighted images and is therefore easily identified [11, 12]. While gray matter nuclei are easily identified on anatomical images, white matter tracts are not as evident, and it is impossible to differentiate their directionality on conventional images.
Diffusion-weighted imaging (DWI) is an MRI technique which takes advantage of the magnetic resonance signal attenuation due to the effects of the diffusion of water molecules [13]. Given that in a highly organized tissue (such as white matter bundles) the preferred direction of water molecules diffusion corresponds to the longitudinal axis of the axons therein [14], quantitative analyses of DWI allow us to non-invasively study white matter brain fibers by analyzing their diffusion profiles [15]. This enables the reconstruction of their three-dimensional trajectories [16] and reveals valuable information about tissue micro-architecture [14]. The most commonly employed model for the study of water diffusion in the brain is diffusion tensor imaging (DTI), and from it, virtual representations of white matter tracts can be extracted using tractography algorithms. While extremely valuable in many scenarios, the underlying assumptions about the diffusion properties (mainly that it follows a gaussian profile and that there is a single preferred direction, if any) make it inadequate for a large proportion of the white matter volume, in which there is more than one fiber population in a given voxel [17]. Moreover, clinically feasible DTI acquisitions are spatially limited, with resolution typically around 2 mm, making the visualization of small structures difficult, if not impossible.
Constrained spherical deconvolution (CSD) of DWI [18] is capable of distinguishing different fiber populations within a single voxel by taking advantage of a large sampling of the diffusion-weighted signal in several orientations (i.e., high radial resolution). As with DTI, reconstruction of the three-dimensional trajectories of white matter bundles (tractography) is possible, and indices of the probability of connectivity with a “seed region” can be obtained at any given voxel using probabilistic tractography. Moreover, the excess of radial resolution within a voxel can be “transformed” into spatial resolution by means of a recently introduced post-processing technique called track-density imaging (TDI) [19], which employs the continuous nature of thousands of synthetic tracks derived from the diffusion data, and re-grids the data into maps of “visitation counts”. The spatial resolution of these images is not limited to that of the original images, but can be an order of magnitude larger. The ability of TDI to resolve sub-voxel structures has been demonstrated with both synthetic and biological data [20,21]. This new methodology allows the visualization of very small gray and white matter structures within the living brain that are otherwise not accessible to conventional imaging.
The objective of the present study was to characterize the anatomic connectivity of the PSA, particularly of the Raprl and Zic using probabilistic tractography in order to better understand the circuits that are modulated by electrical stimulation for the treatment of PD.
2. MATERIALS AND METHODS
2.1. Subjects
Five PD patients in stage II-III on the Hoehn-Yahr scale, (i.e. predominantly unilateral motor symptoms) were selected for treatment with DBS of Raprl contralateral to the more affected extremities. Clinical and demographic characteristics are described in Table 1. Prior to surgery all patients underwent an MRI session (described below). The protocol was approved by the Institutional Review Board, and all patients were informed and signed a written informed consent according to the Declaration of Helsinki. After completing the imaging protocol, patients underwent surgery, during which tetrapolar DBS electrodes were implanted on the side contralateral to the most prominent symptoms. The electrodes were implanted in the Raprl, which was corroborated by post-
Table 1. Clinical characteristics of PD patients.
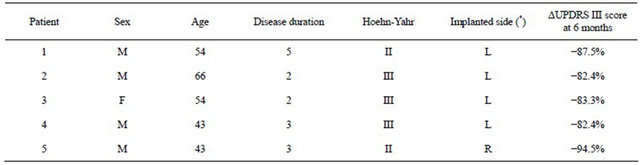
(*) DBS in PSA contralateral to the most affected extremities. F = Female, M = Male, Age and Disease duration are given in years, Hoehn-Yahr II = unilateral PD; III = bilateral PD more prominent on one side. L = Left, R = Right. ΔUPDRS = % decrease in unified Parkinson’s disease scale part III (motor) score for contralateral extremities at 6-month follow up.
operative MRI. Follow up at six months showed a >80% decrease in UPDRS scores for contralateral symptoms in all cases (Table 1).
2.2. Image Acquisition
Images were acquired using a 3 Tesla Philips Achieva MRI scanner (Philips Medical Systems, Eindhoven, Holland) located in the National Psychiatry Institute in Mexico City. Diffusion-weighted images (DWI) were acquired using 120 unique diffusion-gradient directions (b = 2000 s/mm2), field of view (FOV) 256 × 256 mm2, a reconstruction matrix of 128 × 128 (thus yielding a voxel size of 2 × 2 × 2 mm3), 60 contiguous slices and an acquisition time of 50 min. Standard clinical images were also obtained, namely a T1-weighted volume with a spatial resolution of 1 × 1 × 1 mm3 and T2-weighted images in the axial and coronal planes. Total scan time was around 70 min per patient.
2.3. Diffusion Preprocessing
All DWI images were corrected for eddy-current distortions using fsl tools (FMRIB, Oxford), by applying an affine transformation with 12 degrees of freedom to the first (non-DWI) image of the dataset. The resultant transformation matrix was applied to the original gradient diffusion directions [22]. A binary mask of the brain was obtained using the bet algorithm [23]. All voxels outside this brain mask were excluded from further processing.
2.4. Fiber-Tracking
CSD and Fiber-tracking were performed using MRtrix (Brain Research Institute, Melbourne, Australiahttp://www.brain.org.au/software/mrtrix). The maximum harmonic order, which determines angular resolution of the fiber orientation distribution [24], was set to 12.
2.5. Track-Density Imaging (TDI)
A total of one million tracks were seeded throughout the white matter from all voxels in which fractional anisotropy was greater than 0.25 using a probabilistic algorithm [25]. Tracks shorter than 10 mm were discarded. Maps of “track visitation counts” (i.e., TDI) were created with a resolution of 0.2 × 0.2 × 0.2 mm3. Further details on this technique have been previously provided [19].
2.6. Probabilistic Tractography
Visualization of the seed regions for subsequent tractography was facilitated by the high spatial resolution TDI. Thus, after careful segmentation of four seed regions (namely the Raprl and Zic bilaterally, see below), we seeded 50,000 tracts within each anatomical region. As probabilistic tractography is prone to the identification of false connections due to the accumulated uncertainty of the fiber orientation distribution function as the tracts propagate away from the seed, the proportion of tracts connected to the seed voxel tends to decay as a function of distance from the start point. This generally results in very low probabilities of connectivity with areas that are located far from the seed region and, conversely, there is the potential of recovering spurious connections that are due to proximity and not anatomy. Typically, researchers use previous knowledge to improve the results of tractography, eliminating any resulting tracts that do not correspond to known anatomy. Since tracts passing through the Raprl have not previously been fully characterized in humans, such an approach was not feasible. However, in order to disentangle chance events from real connections, we applied a previously reported statistical (and objective) method [26]. Briefly, for each patient we created a connectivity map by performing tractography on volumes of synthetic isotropic diffusion profiles (null connection map) with ten times more random tracks than the probabilistic tractography obtained from the real data; we statistically compared this null connectivity map to the connectivity maps derived from the DWI data. A voxel was deemed as connected to the seed region if it had a connection probability of p < 0.05 after Bonferroni correction (i.e., 0.05/number of seed voxels). Voxels, along with tracts going through them, that did not surpass this threshold were discarded from further analyses (on average, 40% of the tracts were discarded per seed region). Virtual dissections of the remaining tracts were then performed, based on their trajectories in terms of their intersection with the manually drawn tract-selection regions described below.
2.6.1. PSA Segmentation (Segmentation of Seed Regions: Raprl and Zic)
All manual segmentations of the PSA were made on TDIs by two different experts (GGMG and VCF), aided by the Schaltenbrand-Wahren atlas, with simultaneous visualization of T1- and T2-weighted volumes that were previously co-registered to the subject’s non-DWI (i.e., b = 0 s/mm2) using a non-linear deformation (although the volumes involved belong to the same patient and were acquired in the same scan session, the geometric distortions present in the DWI that arise from magnetic inhomogeneities warrant a higher-order registration scheme). The PSA is bounded anteriorly by the posterior border of the STN, inferiorly by the dorsal border of the substantia nigra, superiorly by the ventral thalamic nuclei, posterior medially by the anterolateral border of the red nucleus, posteriorly by the medial lemniscus, posterolaterally by the ventro caudal nucleus, and laterally by the posterior limb of the internal capsule [9]. On axial-slices the STN is seen between the mescencephalic notch and the posterior commissure levels. In T2-weighted images the STN was visualized as a small almond-shaped hypointense structure located lateral to the anterior edge of the red nucleus. Raprl are located between the red nucleus and the STN in each hemisphere, while the Zic (in each hemisphere) corresponds to the region between the Raprl and the medial border of the internal capsule [27] (Figure 1). PSA segmentation was corroborated in the axial, coronal, and sagittal brain views in each patient. Notably, the limit between Raprl and Zic is unclear, as a boundary between the two structures could not be visualized in any of the imaging modalities used. Thus, correspondence between the manual segmentation and the Schaltenbrand-Wahren atlas was carefully confirmed by the two experts [28].
2.6.2. Tract Selection Regions
Regions of interest were manually drawn for each patient’s images, and used as target regions that tracts had to intersect in order to be selected for further analyses. Seven regions that are involved in motor control were considered: the primary motor cortex (PMC), supplementary motor area (SMA), orbitofrontal cortex (OFC), cerebellum, lateral thalamus, medial globus pallidum (GPi), and the pedunculo-pontinenucleus (PPN). The thalamus was further subdivided into motor and somatosensory regions based on their connectivity to the PMC and primary somatosensory cortex [29]. Tracts not reaching any of these targets were discarded.
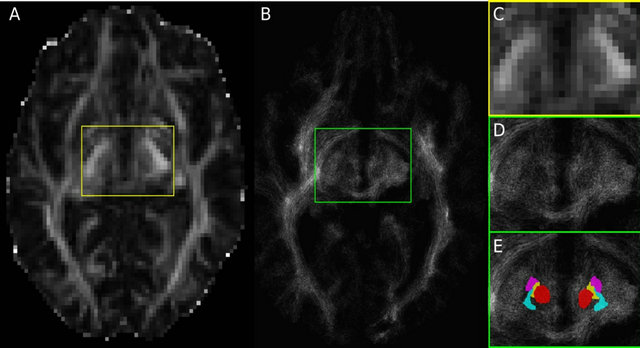
Figure 1. (A) Fractional anisotropy (FA) image of Patient 1 in the subthalamic area with acquisition resolution (2 × 2 × 2 mm3); (B) TDI axial slice at the subthalamic area with a final resolution of (0.2 × 0.2 × 0.2 mm3). Since FA and TDI do not have the same resolution, the slice shown in (B) corresponds to an image between the one shown (A) and the slice immediately above it. The region within the yellow box is shown enlarged in (C), while the green box in (B) is enlarged in (D) and (E). Notice the difference in resolution between (A) and (B), and between (C) and (D). Panel (E) is identical to (D), but with the manual segmentations overlaid, and it is color coded: red nucleus in red, STN in purple, Raprl in yellow, and Zic in cyan.
2.7. Group Average Maps
In order to summarize the tractography findings from all five patients and to highlight their similarities, we created average connectivity maps from the resulting dissected individual tracts. To do this, we non-linearly registered each subject’s fractional anisotropy (FA) map to a publicly available, group-averaged map of the same measure in stereotaxic space (FMRB58_FA_1 mm, available within fsl). The deformation field obtained was applied to that subject’s connectivity maps.
3. RESULTS
Probabilistic Representation of Connections
Tractography showed a high probability of connectivity for Raprl and Zic towards the PMC and SMA in all five patients. At the PSA level, fibers ultimately reaching the SMA traveled slightly more posteriorly relative to fibers that reach the PMC, but this spatial relationship was reversed above the subthalamic area and remained so as the tracts traveled towards their cortical targets. Similarly, connectivity between the OFC and the Raprl and Zic was demonstrated in all patients (Figure 2) with some of the fibers within this bundle branching and reaching the GPi, probably as part of the ansa lenticularis. The motor portions of the thalamus were more densely connected to the Raprl and Zic than its sensory areas. The tracts related to the motor thalamus region were always seen anterior to the sensory tracts throughout their inferior-superior trajectories, until reaching the PMC and somatosensory cortex, respectively. In all five patients we clearly identified the connectivity of the PSA towards the dorsal brainstem in the area between the lemniscal fibers and those of the brachium conjunctivum, which may correspond to tracts passing through the PPN (Figure 2, bottom row). Cerebellar fibers crossed the midline by the brachium conjunctivum at the level of the midbrain, traversing the PSA before ending in the ventrolateral (VL) thalamus. We did not investigate the connectivity between the cerebellum and the ipsilateral subthalamic area.
A distinct pattern of spatial organization of fibers passing through the Raprl and the Zic was clearly visible in all PD patients. Tracts were organized as follows: 1) the most anterior fibers targeted the OFC, GPi, and PPN; 2) fibers in the mid-portion of this bundle reached the SMA, PMC, and cerebellum; and 3) connectivity to the thalamic lateral nuclei occupied the most posterior aspect of the bundle (Figure 3). Further segmentation of the fibers in these two areas may reveal some differences.
Upon visual inspection there were only slight differences between the connectivity maps of Zic and Raprl. However, the spatially-normalized connectivity maps of all patients were averaged, and the resulting map showed subtle differences in their trajectories (Figure 4), albeit
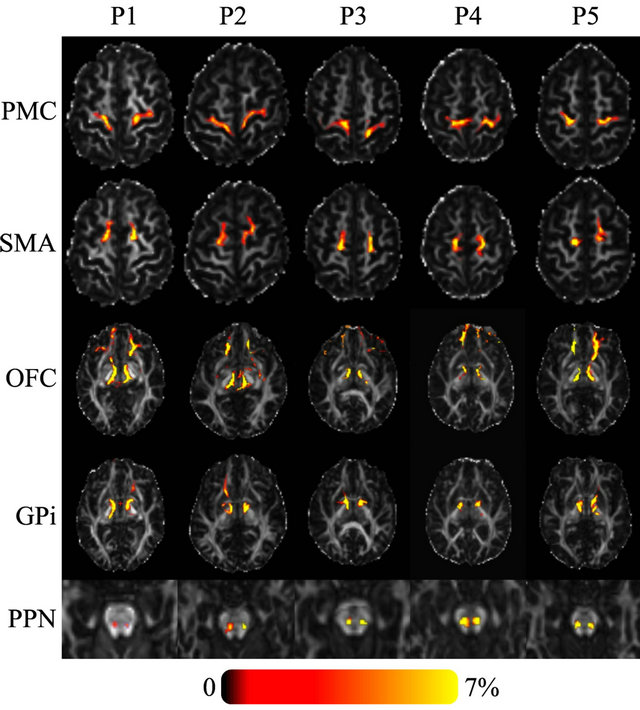
Figure 2. Axial FA images of five PD patients showing the probability of connectivity between the seed region (Raprl) and five target regions. Color indicates the number of tracts that intersect each voxel as a percentage of the number of seeds. Spurious tracts that arise from uncertainty in the data have been objectively filtered out (see text).
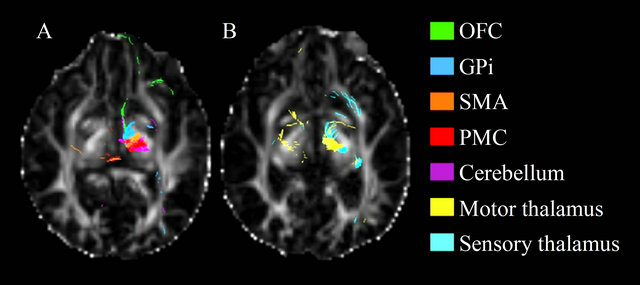
Figure 3. Axial view the fractional anisotropy map showing the tracts resulting from seeding Raprl in patient 1. Tracts are color-coded according to their destination.
with considerable overlap.
A quantitative analysis showed distinct patterns of anatomical connectivity to the two seed regions. We employed the method described by Behrens [29] for connectivity-based segmentation of the white matter connecting the seed regions to all targets. Briefly, connectivity maps from the different seed regions are compared to each other, and each voxel is classified as being connected to the seed region to which it shows the highest probability, in a winner-take-all fashion. Figure 5 shows that the Raprl connections are located, for the most part, more anteriorly than those of the Zic. Probabilistic tractography of Zic indicates that a larger number of tracts reach the PMC and SMA, while tracts from Raprl reached the OFC more often than those from Zic. The lateral portions of the cerebellar hemispheres showed
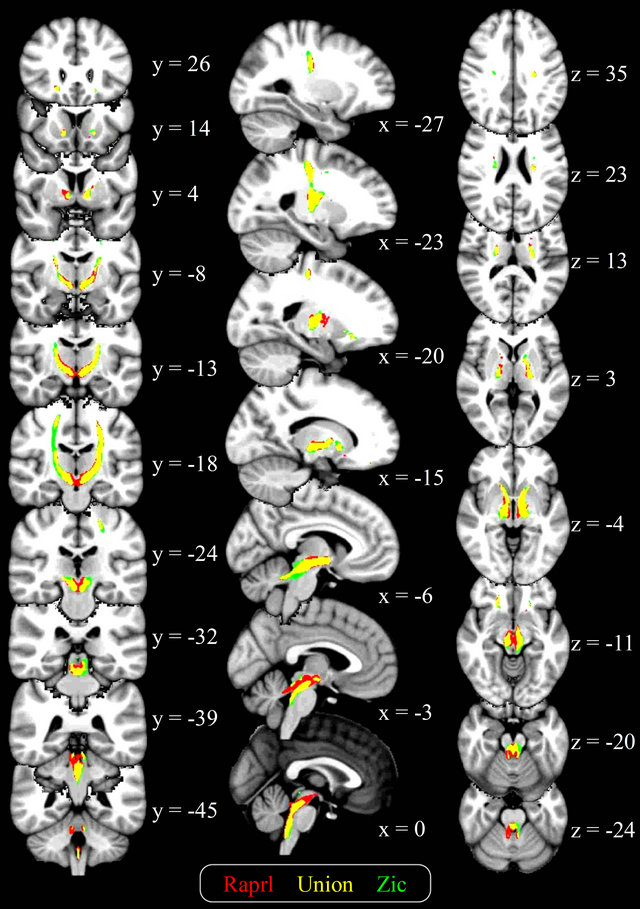
Figure 4. Average connectivity maps of the Raprl and Zic, overlaid on a T1-weighted brain template in standardized space. Color is used to represent the connectivity maps for each structure, as well as their overlap (yellow), in those voxels intersected by at least 1% of the seeded tracts. Slice coordinates are given in MNI space (mm).
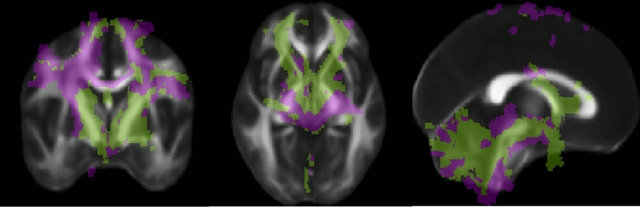
Figure 5. Connectivity of the PSA. Each voxel is color-coded according to the region to which it connects with highest probability (Raprl in green, Zic in purple) in a winner-take-all fashion. The color map is overlaid on an average fractional anisotropy map (slice MNI coordinates x = 0, y = −3, z = −4 mm).
higher connectivity with Zic, while Raprl connectivity was more prominent in the medial portion of the cerebellum. The PPN was more highly connected to the Zic, whereas the GPi showed higher connectivity with the Raprl.
The results from the connectivity-based parcellation maps (Figure 5) are mirrored in Table 2, which shows the number of tracts that reach the various targets. While there is great variability in terms of connectivity to the
Table 2. Number of tracts obtained from probabilistic tractography from Raprl and Zic to different target regions of interest (ROIs) in each hemisphere. Average [range]. A total of 50,000 tracts were seeded for each region.
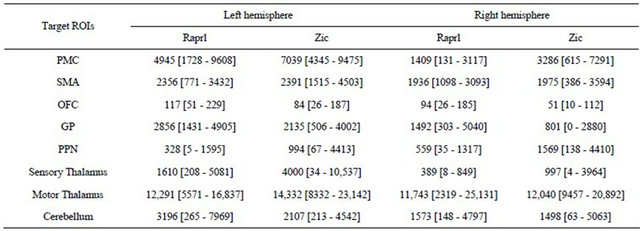
different regions, it is noteworthy that all patients showed an inter-hemispheric asymmetry in tract counts that depends upon the side of greater disability: there was a left > right hemispheric asymmetry in all the connections except those to the PPN in patients presenting more prominent symptoms in the right extremities; the remaining patient, with more prominent symptoms of the left extremities, showed a reversed pattern of tract counts.
4. DISCUSSION
Despite numerous studies reporting on the clinical benefits of electrical stimulation of the white matter pathways within the posterior subthalamus [2,3,5,6,9,30-32], it remains unknown which circuits are affected and thus, how such surgical procedures achieve these benefits. Furthermore, the anatomical and functional descriptions of these pathways are scarce [33,34] and incomplete. With an increasing need to tailor surgical procedures to individual patients based on their clinical profiles, there is an urgency to understand the networks involved in motor control and how specific changes within these networks give rise to particular symptoms (e.g., bradykinesia, rigidity, etc.), or how deranged motor-control networks can be artificially modulated in order to obtain improvement in specific domains.
Analysis of diffusion-weighted magnetic resonance imaging is currently the only available method for the study of anatomical connections in the living human brain, and novel advances have made it possible to query very specific details about the connectivity and the micro-architecture of brain tissue. In this work, we used a very recently described method that increases the spatial resolution of the acquired images by an order of magnitude [19], which enabled the identification of the small gray and white matter structures that comprise the PSA.
Further, a robust statistical framework was used in order to increase the validity of our findings [26]. This was deemed essential, as the connectivity maps derived from our data cannot be validated against prior anatomical knowledge or, for obvious reasons, against sensitive but destructive histological methods.
In this study we demonstrate reproducible patterns of connectivity that intersect the white matter fibers of the PSA, namely the Raprl as well as the Zic. All patients showed significant connections between the PSA and cortical, subcortical, and cerebellar regions involved in motor control, with the derived trajectories of tracts being qualitatively very stable among patients. Although there was a very large variability among patients in the absolute number of tracts that reached each target, the small number of patients included in this study limits our ability to quantitatively evaluate reproducibility, and it is possible that clinical characteristics specific to each patient may be responsible for the wide range of quantitative values obtained. For example, we were unable to identify any tracts connecting Zic and GPi in Patient 5, but we cannot know if this was due to clinical characteristics or to methodological issues. Further, the asymmetry of connections seen in all patients needs to be validated against a group of healthy controls.
In recent years, DTI has been used for clinical diagnosis and staging of PD. Previous reports have focused on studies of the gray matter nuclei that are mainly affected in PD, such as the substantia nigra and STN [35-39]. The cytoarchitecture of gray matter translates into low anisotropy at a macroscopic level, which markedly reduces the sensitivity of DTI to detect abnormalities of this type of tissue; however, there is evidence that DTI could be important for supporting PD diagnosis [36,37,40,41], albeit with conflicting results [37,39]. Others have approached PD as a connectivity disorder, looking beyond the basal ganglia by analyzing white mater tracts using DTI and finding widespread micro structural damage in the genu of corpus callosum, superior longitudinal fasciculus, and cingulum compared with healthy subjects [42]. PD patients also show reduced anatomical connectivity between the sensorimotor cortex and putamen and thalamus, as well as between the globus pallidum and the thalamus and substantia nigra, as compared to healthy controls [43]. Given the benefits derived from DBS of the PPN, its connectivity in humans has been recently studied using probabilistic tractography, providing evidence of its anatomic relationship with structures responsible for motor control such as cortical regions (PMC, SMA), subcortical nuclei (thalamus, globus pallidum, and STN), the cerebellum, and spinal cord [44,45]. The sensitivity of DTI and tractography for the study of PPN connectivity may be hampered by the very small size of this nucleus, which is roughly the size of a voxel in conventional DTI. As clinical scanners are, for the most part, unable to provide sub-millimeter resolution DWI, alternatives for improving spatial resolution (such as superresolution techniques like TDI) are necessary to improve our understanding of the connectivity of this and other small structures, and to aid in planning functional neurosurgical interventions.
4.1. Correlation of Anatomy with Improvement in PD Symptoms
DBS in both Raprl and Zic has been reported to show improvements in tremor, rigidity, and bradykinesia in PD. While there are no reports of improvement in gait and posture for Zic, DBS of Raprl improves these symptoms in about 50% and 35%, respectively, of advanced PD patients [5]. This improvement may be related to the connectivity of Raprl with GPi and PPN. The origin of fibers connecting Raprl with the PPN is uncertain, but fibers of the ansa lenticularis may go beyond the Forel’s fields through Raprl and towards the dorsal brainstem. This may explain the improvement in rigidity in ipsiand contralateral extremities with unilateral GPi stimulation [46], as the PPN has bilateral connections with the spinal cord.
With regard to cerebellar connections, both Raprl and Zic have been reported to improve tremor, which may depend on inhibition of fibers in the brachium conjunctivum. In contrast, stimulation of Raprl alleviates rigidity in 94% [6,47] while DBS of the Zic decreases rigidity in contralateral extremities in only 76% of PD patients [4]. Perirubral cerebellar fibers have been held responsible for this effect on rigidity. Although in our analysis cerebellar connections are even more widespread for Zic than for Raprl, Zic contains a smaller proportion of cerebellar fibers than Raprl. Further, it has been shown that perirubral cerebellar fibers pass more medially (closer to the Red nucleus), while Zic is lateral to these fibers [33].
The dense connections between Raprl and the OFC are not worthy. Fibers originating in these cortical areas seem to extend beyond Raprl into the upper brainstem. In previous reports our group has suspected the existence of these fibers that may be related to the process of selective attention [8,48,49], indicating that a reticulothalamic system is probably involved in tremor origin. On the other hand, since the OFC is an inhibitor of behavioral processes [49], it is possible that inactivating its fiber connections with the mesencephalic reticular formation by high-frequency electrical stimulation may result in improvement of bradykinesia.
The effects of pallidal DBS are related to the location of the stimulating contact within the GPi. Stimulation of the dorsal GPi significantly improves parkinsonian symptoms (rigidity, akinesia, and gait disturbance), while stimulation of the posteroventral GPi dramatically improves levodopa-induced dyskinesia and worsens gait and akinesia, although the improvement of rigidity remains [50-52]. In the present study GPi, including its posteroventral region, has a higher probability of connectivity with Raprl than with Zic, this could also explain why patients with DBS have more improvement of rigidity when there are effective contacts in Raprl than in any other neurosurgical target [3,5,6].
On the other hand, when contacts were placed more medially, bilateral DBS in the PSA is reported to have adverse effects, such as hypophonic speech and unstable gait, which were attributed to stimulation of cerebellar fibers [4]. The present study supports this hypothesis, as we observed a large number of cerebellar fibers crossing thorough the more medial regions of the PSA.
4.2. Limitations
The boundary between Zic and Raprl is not easily established by MRI, even with super-resolution methods such as the one used here. Despite our efforts to produce an accurate segmentation of the PSA, it is possible that voxels labeled as Zic contain tissue pertaining to Raprl or vice versa, and that some afferents or efferents from Zic may pass through Raprl on their way to their final destination. The small sample size and notable the lack of a control group also limit our ability to determine the robustness of the connections we identified, as well as if their inter-hemispheric asymmetry is normal or disease driven.
4.3. Conclusion
Probabilistic tractography based on TDI and CSD allows the visualization of subthalamic white matter fibers as they extend to reach cortical, subcortical and cerebellar regions, and the present study confirms that anatomical connections of the PSA are involved with key areas of motor control. The connectivity patterns of the PSA were reproducible between patients, yet there is need for future studies with a larger sample size to validate our findings and to discern how disease progression affects these connections.
5. ACKNOWLEDGEMENTS
The authors thank Dr. Dorothy Pless for the careful revision of the manuscript and Leopoldo Gonzalez for the technical advice. This work is part of the PhD dissertation of GGMG on the Doctoral Program in Biomedical Sciences at Universidad Nacional Autónoma de México (UNAM) and it was supported by the National Council of Science and Technology in Mexico (CONACyT) from grant 0114218-2009 and a CONACyT scholarship to GGMG (CVU 468870).
![]()
![]()
REFERENCES
- Benabid, A.L., Pollak, P., Louveau, A., Henry, S. and De Rougemont, J. (1987) Combined (thalamotomy and stimulation) stereotactic surgery of the VIM thalamic nucleus for bilateral Parkinson disease. Applied Neurophysiology, 50, 344-346.
- Velasco, F.C., Molina-Negro, P., Bertrand, C. and Hardy, J. (1972) Further definition of the subthalamic target for arrest of tremor. Journal of Neurosurgery, 36, 184-191. doi:10.3171/jns.1972.36.2.0184
- Kitagawa, M., Murata, J., Uesugi, H., Kikuchi, S., Saito, H., Tashiro, K. and Sawamura, Y. (2005) Two-year follow-up of chronic stimulation of the posterior subthalamic white matter for tremor-dominant Parkinson’s disease. Neurosurgery, 56, 281-289; discussion 281-289. doi:10.1227/01.NEU.0000148167.49105.A3
- Plaha, P., Ben-Shlomo, Y., Patel, N.K. and Gill, S.S. (2006) Stimulation of the caudal zonaincerta is superior to stimulation of the subthalamic nucleus in improving contralateral Parkinsonism. Brain, 129, 1732-1747. doi:10.1093/brain/awl127
- Carrillo-Ruiz, J.D., Velasco, F., Jiménez, F., Castro, G., Velasco, A.L., Hernández, J.A., Ceballos, J. and Velasco, M. (2008) Bilateral electrical stimulation of prelemniscal radiations in the treatment of advanced Parkinson’s disease. Neurosurgery, 62, 347-357; discussion 357-359. doi:10.1227/01.neu.0000316001.03765.e8
- Velasco, F., Jiménez, F., Pérez, M.L., Carrillo-Ruiz, J.D., Velasco, A.L., Ceballos, J. and Velasco, M. (2001) Electrical stimulation of the prelemniscal radiation in the treatment of Parkinson’s disease: An old target revised with new techniques. Neurosurgery, 49, 293-306; discussion 306-308.
- Plaha, P., Javed, S., Agombar, D., O’Farrell, G., Khan, S, Whone, A. and Gill, S. (2011) Bilateral caudal zonaincerta nucleus stimulation for essential tremor: Outcome and quality of life. Journal of Neurology, Neurosurgery & Psychiatry, 82, 899-904. doi:10.1136/jnnp.2010.222992
- Velasco, F. and Velasco, M. (1979) A reticulothalamic system mediating proprioceptive attention and tremor in man. Neurosurgery, 4, 30-36. doi:10.1227/00006123-197901000-00006
- Blomstedt, P., Sandvik, U., Fytagoridis, A. and Tisch, S. (2009) The posterior subthalamic area in the treatment of movement disorders: Past, present, and future. Neurosurgery, 64, 1029-1038; discussion 1038-1042. doi:10.1227/01.NEU.0000345643.69486.BC
- Brunenberg, E.J.L., Platel, B., Hofman, P.A.M., TerHaar Romeny, B.M. and Visser-Vandewalle, V. (2011) Magnetic resonance imaging techniques for visualization of the subthalamic nucleus. Journal of Neurosurgery, 115, 971-984. doi:10.3171/2011.6.JNS101571
- Dormont, D., Ricciardi, K.G., Tandé, D., Parain, K., Menuel, C., Galanaud, D., Navarro, S., Cornu, P., Agid, Y. and Yelnik, J. (2004) Is the subthalamic nucleus hypointense on T2-weighted images? A correlation study using MR imaging and stereotactic atlas data. American Journal of Neuroradiology, 25, 1516-1523.
- Slavin, K.V., Thulborn, K.R., Wess, C. and Nersesyan, H. (2006) Direct visualization of the human subthalamic nucleus with 3T MR imaging. American Journal of Neuroradiology, 27, 80-84.
- Le Bihan, D. and Van Zijl, P. (2002) From the diffusion coefficient to the diffusion tensor. NMR in Biomedicine, 15, 431-434. doi:10.1002/nbm.798
- Beaulieu, C. (2002) The basis of anisotropic water diffusion in the nervous system—A technical review. NMR in Biomedicine, 15, 435-455. doi:10.1002/nbm.782
- Basser, P.J., Mattiello, J. and LeBihan, D. (1994) MR diffusion tensor spectroscopy and imaging. Biophysical Journal, 66, 259-267. doi:10.1016/S0006-3495(94)80775-1
- Mori, S. and Van Zijl, P.C.M. (2002) Fiber tracking: principles and strategies—A technical review. NMR in Biomedicine, 15, 468-480. doi:10.1002/nbm.781
- Behrens, T.E.J., Berg, H.J., Jbabdi, S., Rushworth, M.F.S. and Woolrich, M.W. (2007) Probabilistic diffusion tractography with multiple fibre orientations: What can we gain? Neuroimage, 34, 144-155. doi:10.1016/j.neuroimage.2006.09.018
- Tournier, J.-D., Calamante, F. and Connelly, A. (2007) Robust determination of the fibre orientation distribution in diffusion MRI: Non-negativity constrained super-resolved spherical deconvolution. Neuroimage, 35, 1459- 1472. doi:10.1016/j.neuroimage.2007.02.016
- Calamante, F., Tournier, J.-D., Jackson, G.D. and Connelly, A. (2010) Track-density imaging (TDI): Superresolution white matter imaging using whole-brain trackdensity mapping. Neuroimage, 53, 1233-1243. doi:10.1016/j.neuroimage.2010.07.024
- Calamante, F., Tournier, J.-D., Heidemann, R.M., Anwander, A., Jackson, G.D. and Connelly, A. (2011) Track density imaging (TDI): Validation of super resolution property. Neuroimage, 56, 1259-1266. doi:10.1016/j.neuroimage.2011.02.059
- Calamante, F., Tournier, J.-D., Smith, R.E. and Connelly, A. (2012) A generalised framework for super-resolution track-weighted imaging. Neuroimage, 59, 2494-2503. doi:10.1016/j.neuroimage.2011.08.099
- Leemans, A. and Jones, D.K. (2009) The B-matrix must be rotated when correcting for subject motion in DTI data. Magnetic Resonance in Medicine, 61, 1336-1349. doi:10.1002/mrm.21890
- Smith, S.M. (2002) Fast robust automated brain extraction. Human Brain Mapping, 17, 143-155. doi:10.1002/hbm.10062
- Tournier, J.-D., Calamante, F., Gadian, D.G. and Connelly, A. (2004) Direct estimation of the fiber orientation density function from diffusion-weighted MRI data using spherical deconvolution. Neuroimage, 23, 1176-1185. doi:10.1016/j.neuroimage.2004.07.037
- Parker, G.J.M. and Alexander, D.C. (2005) Probabilistic anatomical connectivity derived from the microscopic persistent angular structure of cerebral tissue. Philosophical Transactions of the Royal Society of London B Biological Sciences, 360, 893-902.
- Morris, D.M., Embleton, K.V. and Parker, G.J.M. (2008) Probabilistic fibre tracking: Differentiation of connections from chance events. Neuroimage, 42, 1329-1339. doi:10.1016/j.neuroimage.2008.06.012
- Kerl, H.U., Gerigk, L., Huck, S., Al-Zghloul, M., Groden, C. and Nölte, I.S. (2012) Visualisation of the zonaincerta for deep brain stimulation at 3.0 Tesla. Clinical Neuroradiology, 22, 55-68. doi:10.1007/s00062-012-0136-3
- Schaltenbrand, G. and Wahren, W. (1977) Atlas of stereotaxy of the human brain. Thieme, Stuttgart.
- Behrens, T.E.J., Johansen-Berg, H., Woolrich, M.W., Smith, S.M., Wheeler-Kingshott, C.A.M., Boulby, P.A., Barker, G.J., Sillery, E.L., Sheehan, K., Ciccarelli, O., Thompson, A.J., Brady, J.M. and Matthews, P.M. (2003) Non-invasive mapping of connections between human thalamus and cortex using diffusion imaging. Nature Neuroscience, 6, 750-757. doi:10.1038/nn1075
- Murata, J., Kitagawa, M., Uesugi, H., Saito, H., Iwasaki, Y., Kikuchi, S., Tashiro, K. and Sawamura, Y. (2003) Electrical stimulation of the posterior subthalamic area for the treatment of intractable proximal tremor. Journal of Neurosurgery, 99, 708-715. doi:10.3171/jns.2003.99.4.0708
- Fytagoridis, A., Sandvik, U., Aström, M., Bergenheim, T. and Blomstedt, P. (2012) Long term follow-up of deep brain stimulation of the caudal zonaincerta for essential tremor. Journal of Neurology, Neurosurgery & Psychiatry, 83, 258-262. doi:10.1136/jnnp-2011-300765
- Blomstedt, P., Fytagoridis, A., Aström, M., Linder, J., Forsgren, L. and Hariz, M.I. (2012) Unilateral caudal zonaincerta deep brain stimulation for Parkinsonian tremor. Parkinsonism and Related Disorders, 18, 1062-1066. doi:10.1016/j.parkreldis.2012.05.024
- Carrillo-Ruiz, J.D., Velasco, F., Jimenez, F., Velasco, A.L., Castro, G., Soto, J. and Salcido, V. (2012) Prelemniscal radiations neuromodulation in Parkinson diseases treatment, topics in neuromodulation treatment. http://www.intechopen.com/books/topics-in-neuromodulation-treatment/prelemniscal-radiations-neuromodulation-in-the-treatment-of-parkinson-s-disease
- Testut, L. (1947) Tratado de anatomía humana. Angiología-Sistema Nervioso Central, Segundo Tomo.
- Yoshikawa, K., Nakata, Y., Yamada, K. and Nakagawa, M. (2004) Early pathological changes in the parkinsonian brain demonstrated by diffusion tensor MRI. Journal of Neurology, Neurosurgery & Psychiatry, 75, 481-484. doi:10.1136/jnnp.2003.021873
- Chan, L.-L., Rumpel, H., Yap, K., Lee, E., Loo, H.-V., Ho, G.-L., Fook-Chong, S., Yuen, Y. and Tan, E.-K. (2007) Case control study of diffusion tensor imaging in Parkinson’s disease. Journal of Neurology, Neurosurgery & Psychiatry, 78, 1383-1386. doi:10.1136/jnnp.2007.121525
- Menke, R.A., Scholz, J., Miller, K.L., Deoni, S., Jbabdi, S., Matthews, P.M. and Zarei, M. (2009) MRI characteristics of the substantianigra in Parkinson’s disease: A combined quantitative T1 and DTI study. Neuroimage, 47, 435-441. doi:10.1016/j.neuroimage.2009.05.017
- Lambert, C., Zrinzo, L., Nagy, Z., Lutti, A., Hariz, M., Foltynie, T., Draganski, B., Ashburner, J. and Frackowiak, R. (2012) Confirmation of functional zones within the human subthalamic nucleus: Patterns of connectivity and sub-parcellation using diffusion weighted imaging. Neuroimage, 60, 83-94. doi:10.1016/j.neuroimage.2011.11.082
- Du, G., Lewis, M.M., Styner, M., Shaffer, M.L., Sen, S., Yang, Q.X. and Huang, X. (2011) Combined R2* and diffusion tensor imaging changes in the substantianigra in Parkinson’s disease. Movement Disorders, 26, 1627-1632. doi:10.1002/mds.23643
- Vaillancourt, D.E., Spraker, M.B., Prodoehl, J., Abraham, I., Corcos, D.M., Zhou, X.J., Comella, C.L. and Little, D.M. (2009) High-resolution diffusion tensor imaging in the substantianigra of de novo Parkinson disease. Neurology, 72, 1378-1384. doi:10.1212/01.wnl.0000340982.01727.6e
- Brooks, D.J. (2010) Imaging approaches to Parkinson disease. Journal of Nuclear Medicine, 51, 596-609. doi:10.2967/jnumed.108.059998
- Gattellaro, G., Minati, L., Grisoli, M., Mariani, C., Carella, F., Osio, M., Ciceri, E., Albanese, A. and Bruzzone, M.G. (2009) White matter involvement in idiopathic Parkinson disease: A diffusion tensor imaging study. American Journal of Neuroradiology, 30, 1222-1226. doi:10.3174/ajnr.A1556
- Sharman, M., Valabregue, R., Perlbarg, V., MarrakchiKacem, L., Vidailhet, M., Benali, H., Brice, A. and Lehéricy, S. (2012) Parkinson’s disease patients show reduced cortical-subcortical sensorimotor connectivity. Movement Disorders. doi:10.1002/mds.25255
- Aravamuthan, B.R., Stein, J.F. and Aziz, T.Z. (2008) The anatomy and localization of the pedunculopontine nucleus determined using probabilistic diffusion tractography [corrected]. British Journal of Neurosurgery, 22, S25- S32. doi:10.1080/02688690802448251
- Muthusamy, K.A., Aravamuthan, B.R., Kringelbach, M.L., Jenkinson, N., Voets, N.L., Johansen-Berg, H., Stein, J.F. and Aziz, T.Z. (2007) Connectivity of the human pedunculopontine nucleus region and diffusion tensor imaging in surgical targeting. Journal of Neurosurgery, 107, 814- 820. doi:10.3171/JNS-07/10/0814
- Jiménez, F., Velasco, F., Carrillo-Ruiz, J.D., García, L., Madrigal, A., Velasco, A.L. and Márquez, I. (2006) Comparative evaluation of the effects of unilateral lesion versus electrical stimulation of the globuspallidusinternus in advanced Parkinson’s disease. Stereotactic and Functional Neurosurgery, 84, 64-71. doi:10.1159/000094034
- Velasco, F., Palfi, S., Jimenez, J., Carrillo-Ruiz, J.D., Castro, G. and Keravel, Y. (2009) Other targets to treat Parkinson disease posterior subthalamic targets and motor cortex. In: Lozano, A.M., Gildenberg, P.L. and Tasker, R.R., Eds, Spinger-Verlag, Berlin/Heidelberg, 1665-1678.
- Velasco, F., Velasco, M., Ogarrio, C. and Olvera, A. (1986) Neglect induced by thalamotomy in humans: A quantitative appraisal of the sensory and motor deficits. Neurosurgery, 19, 744-751. doi:10.1227/00006123-198611000-00005
- Velasco, F., Velasco, M., Jiménez, F., Velasco, A.L. and Salin-Pascual, R. (2005) Neurobiological background for performing surgical intervention in the inferior thalamic peduncle for treatment of major depression disorders. Neurosurgery, 57, 439-448; discussion 439-448. doi:10.1227/01.NEU.0000172172.51818.51
- Bejjani, B., Damier, P., Arnulf, I., Bonnet, A.M., Vidailhet, M., Dormont, D., Pidoux, B., Cornu, P., Marsault, C. and Agid, Y. (1997) Pallidal stimulation for Parkinson’s disease. Two targets? Neurology, 49, 1564-1569. doi:10.1212/WNL.49.6.1564
- Krack, P., Pollak, P., Limousin, P., Hoffmann, D., Benazzouz, A., Le Bas, J.F., Koudsie, A. and Benabid, A.L. (1998) Opposite motor effects of pallidal stimulation in Parkinson’s disease. Annals of Neurology, 43, 180-192. doi:10.1002/ana.410430208
- Collins, K.L., Lehmann, E.M. and Patil, P.G. (2010) Deep brain stimulation for movement disorders. Neurobiology of Disease, 38, 338-345. doi:10.1016/j.nbd.2009.11.019
NOTES
*Corresponding author.