Journal of Geographic Information System
Vol.4 No.1(2012), Article ID:17075,6 pages DOI:10.4236/jgis.2012.41010
Soil Informatics for Evaluating and Mapping Soil Productivity Index in an Intensively Cultivated Area of Punjab, India
Punjab Remote Sensing Centre, Ludhiana, India
Email: vip_verma@rediffmail.com
Received May 16, 2011; revised July 13, 2011; accepted August 6, 2011
Keywords: Macro Nutrient; Soil; GIS; Remote Sensing; Soil Productivity
ABSTRACT
Soil Informatics, the GIS-based decision-support system, helps to establish the potentials and limitations of different soils for crop production. A new methodology combining soil survey indices with available nutrients (P and K) was developed to evaluate soil productivity. Physiographic-soil map was generated by interpretation of IRS 1C/1D LISS III satellite data and soil survey in an agricultural region of Punjab, India. Georeferenced surface (0 m - 0.15 m) soil samples were collected from 267 sites using Global Positioning System (GPS). Available P (Olsen P) content varied from 5.49 kg·ha–1 to 67.0 kg·ha–1 and available K (1N NH4OAc extractable K) from 44.8 kg·ha–1 to 784 kg·ha–1. The nutrient maps (P and K) generated using ArcGIS clearly point out the specific locales where deficiency of nutrients constrained crop production. Multi nutrient (PK) map indicated that the combined P and K deficiency at a single place was negligible. The productivity index was computed by taking into account soil texture and available nutrients to evaluate the productivity of soils in each mapping unit. This approach is proposed as a method for the evaluation of sustainable soil management.
1. Introduction
Soil quality is usually defined in terms of soil productivity, and specifically in regard to soil’s capacity to sustain and nurture plant growth [1]. The primary reason for initiating soil survey was for the evaluation of soil productivity, which involves a blend of qualitative and quantitative rating models [2]. While efforts to define and quantify soil productivity are not new, establishing a consensus with regard to a set of standard conditions (soil properties) to be used for evaluation of productivity of soils remains difficult [3]. Such databases can be analyzed in a computerized geographic information system (GIS) to develop broad regional assessment of inherent soil quality and landscape quality [4]. The concept of Soil Rating for Plant Growth (SRPG) was developed by USDA-NRCS staff to rate soils for plant growth at a county scale [5].
During the last more than three decades, rice followed by wheat has come to be a dominant cropping system in Punjab, India. The productivity of this system has started showing signs of fatigue. Obviously, there is a vital need to identify the constraints of productivity and to find solution for the sustainability of rice-wheat system in Punjab [6]. Both these crops require application of heavy doses of nutrients to achieve full yield potential. The indiscriminate use of fertilizers over a period of time has resulted in buildup of nutrient elements like phosphorus and deficiency of potassium in many locations [7]. Hence for sustainability of the present agriculture system and for management of soil resources, it is imperative to emphasize on the rational management of soil fertility which requires an understanding of how nutrients vary across the land [8]. To date, however, many land resource assessment studies have not fully capitalized on the opportunities presented by the new techniques in geospatial analysis and information management. Previous studies on soil-site suitability for growing crops involved the execution and interpretation of surveys and studies of landforms, soils, land use, vegetation and climate etc. Since nutrient status of soils affects productivity, we included the fertility status and indices of soil survey to evaluate and map the productivity of soils using remote sensing, GIS and Global Positioning System (GPS) in Moga district of Punjab, India.
2. Study Area
The study area (Figure 1) forming part of Indo-Gangetic alluvial plain is located in central part of Punjab, India. River Satluj forms the upper boundary of the district.

Figure 1. Location of study area.
Geomorphologically, the area is a vast stretch of old and recent alluvium of Quaternary age as modified by orogenic processes associated with fluviatile action. The present landscape is the result of combined effect of the localized reworking of the earlier deposited sand bars and sand dunes by aeolian action, leveling and transportation to other places.
3. Materials and Methods
3.1. Soil Survey and Mapping
Physiographic analysis of Indian Remote Sensing IRS 1C/1D LISS III data (false colour composites, spatial resolution of 23.5 metres) of the year 2004 was carried out to distinguish the main land types and sub-types. Subdivisions of land types were mainly based upon the combination of relevant elements of image-interpretation, such as color, tone, texture, size, shape, pattern, drainage conditions, slope and land use. A reconnaissance survey of the area was undertaken by taking auger bore observations to validate the physiographic units and check the composition of soils. The soils were studied by auguring and excavating master profiles up to 1.5 m meter depth. The physiographic-soil map was finalized on 1:50,000 scale and digitized using Arc GIS. The flow chart of the approach followed is given in Figure 2.
3.2. Collection and Analysis of Soil Samples
The soil map (Figure 3) thus generated was used to prepare sampling design so that all the physiographic units/ soils were well represented. Georeferenced surface (0 - 15 cm) soil samples from 267 sites (Figure 4) representing different soils were collected in early April, 2005. Location of soil sampling sites (x, y coordinates) were located in the field with a GPS.

Figure 2. Schematic diagram of the approach for evaluating soil productivity.
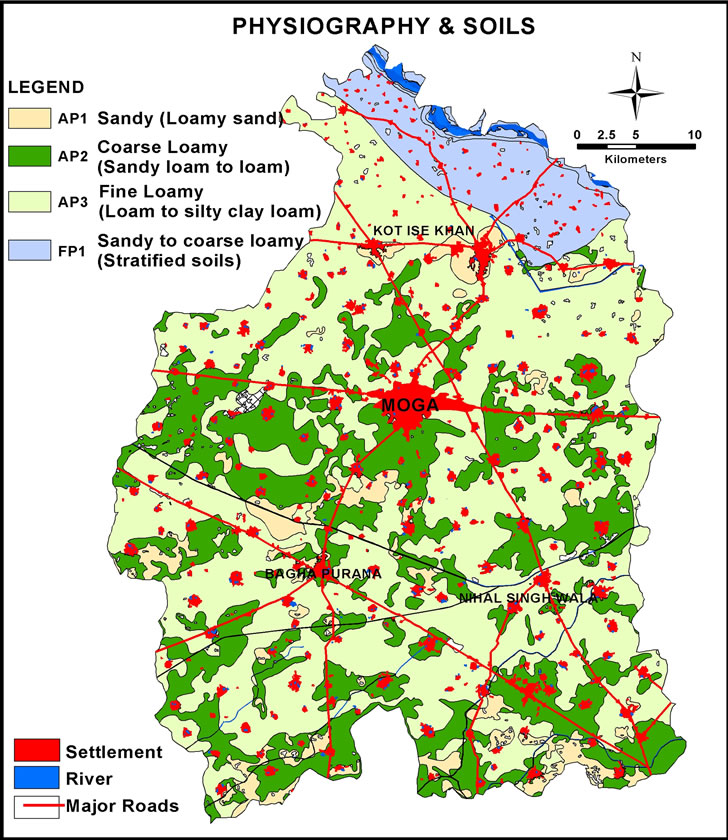
Figure 3. Physiographic soil map of the study area.
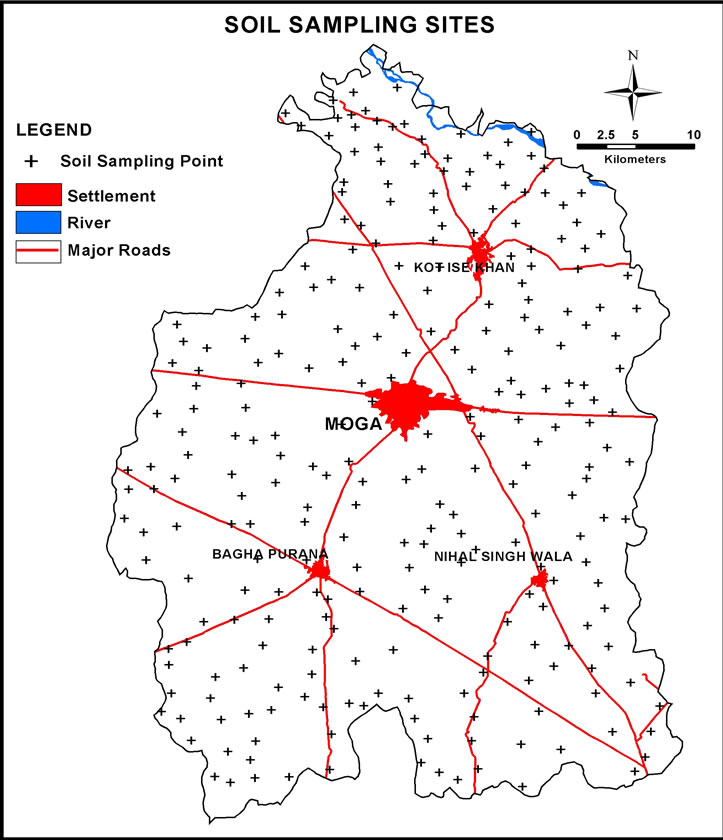
Figure 4. Soil sampling sites.
The soil samples were ground, passed through 2 mm sieve and analyzed for available phosphorus (P) and potassium (K). Olsen P (Available P) was extracted with 0.5 M NaHCO3 solution buffered at pH 8.5 [9]. Available K was determined by 1 N NH4OAc (pH 7.0) and K in the extract was measured using flame photometer [10].
3.3. Generation of Maps
Maps of georeferenced soil/plant sampling sites were generated using ArcGIS. Individual nutrient (P and K) maps were prepared and integrated to derive the multimacro nutrient (P and K) in the GIS environment.
4. Results and Discussion
4.1. Physiography and Soils
Based on visual interpretation of IRS LISS-III satellite data (spatial resolution 23.5 meters) for the year 2006, the area has been divided into two major physiographic units viz. alluvial plain (Ap) and flood plain (FP). The alluvial plain constituted the major portion of the study area and has been further categorized into alluvial plain with sand cover (Ap1), upper alluvial plain (Ap2) and lower alluvial plain (Ap3) and flood plain (FP). The alluvial plain with sand cover (Ap1) includes some of the areas of reclaimed sand dune complexes (Figure 3).
The upper (Ap2) and lower (Ap3) alluvial plain are intensively cultivated and irrigated areas with medium to heavy textured soils, respectively. The flood plain (FP) occupying a small part of the area and has stratified soils (Table 1).
The lowest amount of sand (37.8 to 48.9 percent) was in the profiles of lower alluvial plain soils (Ap3). In the profile developed on alluvial plain with sand cover (62.7 to 81.4 % sand), the clay was irregularly distributed with depth and is the lowest as compared to other units. The soils of upper and lower alluvial plain were with higher clay content and showed an increasing trend with the depth except in BC and C horizons. The soils were alkaline in reaction (pH ranged between 8.5 and 9.2). The organic carbon content of the soils varied from 0.04 to 0.81 percent with higher organic carbon in the surface horizons. An irregular distribution of organic carbon in soils from all physiographic units except for Ap2 and Ap3 indicates recent origin of these soils. The CaCO3 content of these soils varied from nil to 17.9 percent.
4.2. Chemical Characteristics and Macronutrient Status of Soils
The surface soils (Figure 4) of the study area were neutral to alkaline in reaction. Most soils were free from the problem of salinity and alkalinity. The organic carbon in these soils ranged between 0.17 percent and 0.98 percent with an average value of 0.63%. The calcium carbonate content varied from nil to 5.40% with an average value of 2.20 percent. The available phosphorus (Olsen P) content of soils varied from 5.49 kg·ha–1 to 67.0 kg·ha–1 averaging to 31.8 kg·ha–1.
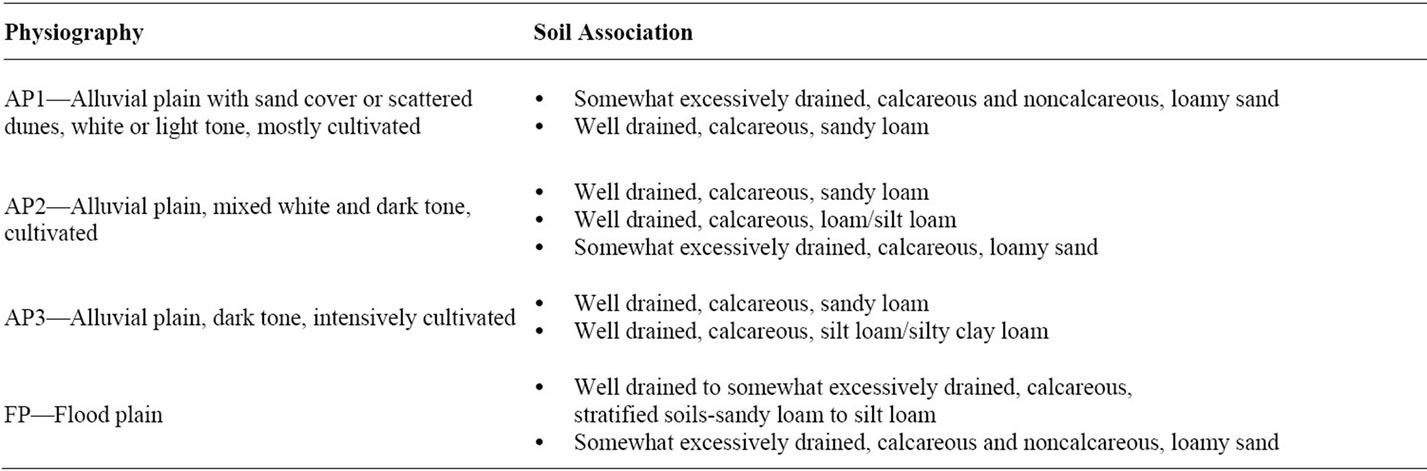
Table 1. Soil physiography relationship in Moga district.
Spatially 1.9, 14.8, 80.1 percent of the total geographical area of the district (Figure 5) had low, medium and high content of P, respectively according to the limits of available P given in Table 2. Adequate amount of P in certain areas may be attributed to application of phosphatic fertilizers to both crops in the rice-wheat cropping sequence resulting in build up of P. The efficiency of applied P is very low and it comes in available form very slowly.
The available K (1 N NH4OAc (pH 7.0)—extractable K) content ranged from 44.8 kg·ha–1 to 784 kg·ha–1 with a mean value of 255 kg·ha–1 (Table 2). A majority of the soils were medium in K content and and 56.2 and 40.9 percent of the total area was with K content in the medium and high range, respectively, whereas, the remaining 2.9 percent area was deficient in K (Figure 6).

Figure 5. Phosphorus status of surface soils (0 - 0.15 m) of the study area.
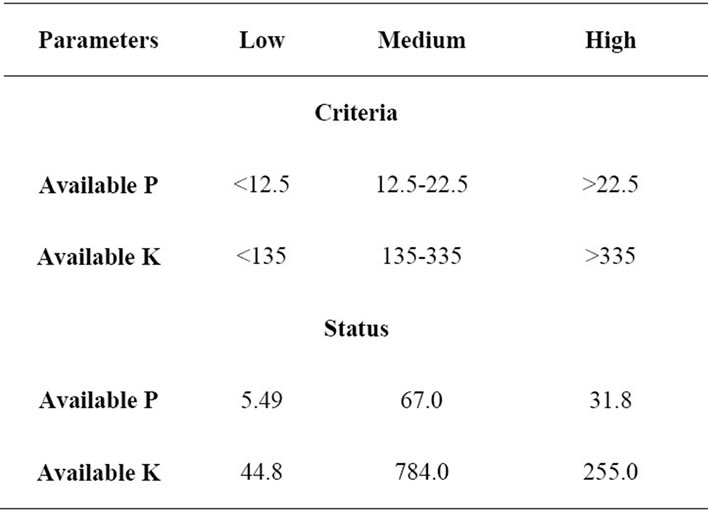
Table 2. Criteria used for assessment of nutrient status (kg·ha–1) of soils.
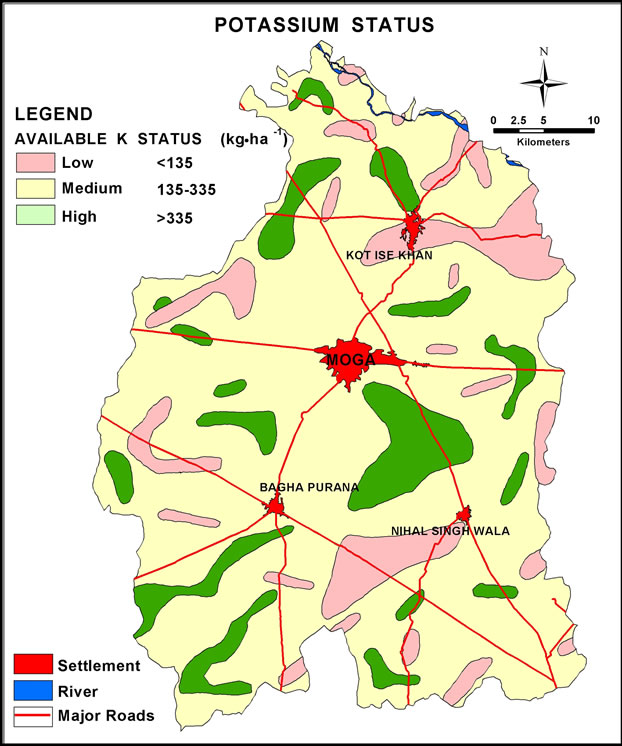
Figure 6. Potassium status of surface soils (0 - 0.15 m) of the study area.
4.3. Multi-Macronutrient Deficiencies
The multi macronutrient map (Figure 7) indicated that only a small portion of the total geographical area of the district had deficiency of P and K both at single location. Available P in the high (H) and in the medium (M) range, HM category, covered 62.5 percent of the total area. This was followed by the categories HH (HighHigh) and MM (Medium-Medium) covering 10.2 and 8.8 percent area, respectively. Other categories like LM (LowMedium), LM (Low-Medium), ML (Medium-Low) and HL (High-Low) occupied very small area of the district (Table 3).
4.4. Evaluation of Productivity Index
The physiographic soil map (Figure 4) was integrated with multi macronutrient (P and K) map (Figure 7) in ArcGIS to delineate the composite soil units (Figure 8) soil texture, available P and available K. In order to quantify the productivity of soil, parametric approach [11] was followed which was modified according to the local conditions. There were no significant differences in other parameters of approach of Riquier et al., 1976. Therefore, we evaluated the productivity index of soils by including soil texture, available P and K. The rating to each soil unit was evaluated in term of the degree of limitation. Overall productivity index (PI) was computed as under:
Productivity Index (PI) = T.P.K whereT = rating for soil texture taken as (100 for the texture suitable for growing various crops i.e. fine loamy), (80 for medium texture i.e. coarse loamy) and (60 for coarse textured and/or stratified soils).
P = rating for available phosphorus (taken as fraction of 1), (for high P soils = 1, medium P soils = 0.8 and low P soils = 0.6).
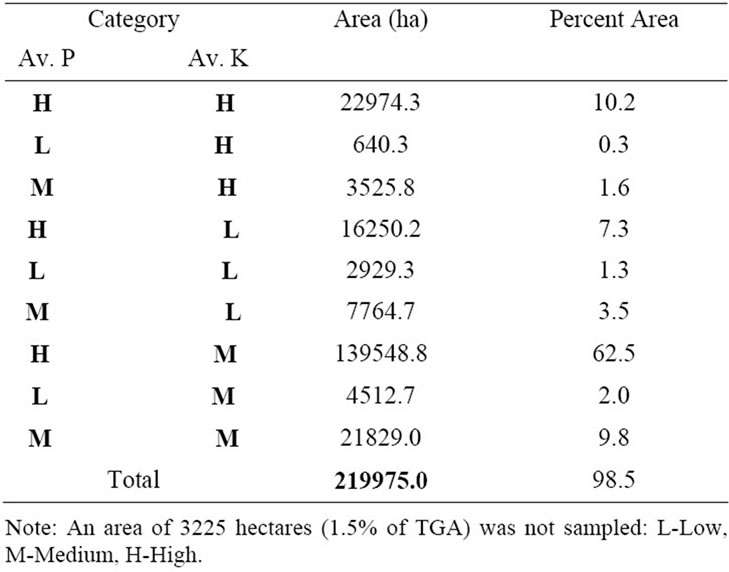
Table 3. Area under various multi macronutrient categories.
K= rating for available potassium (taken as fraction of 1), (for high K soils = 1, medium K soils = 0.8 and low K soils = 0.6).
The productivity class for each soil unit was determined according to the PI values and attributes were assigned after generation of maps in ArcGIS (Figure 8). The zones with values of PI < 40 were rated as low productivity class, 41 - 60 as medium, 61 - 80 as high and >80 as very high.
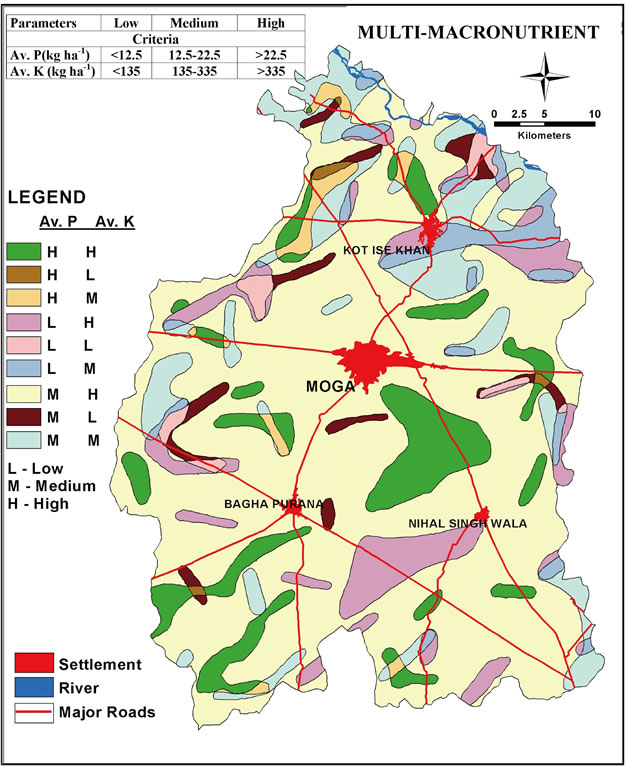
Figure 7. Multi-macronutrient of soils of the study area.

Figure 8. Soil productivity of the study area.
The changes in physiography had a strong influence on nutrient distribution. It was higher in the fine-textured soils of Ap3. The soils of Ap1 and FP were with the lowest nutrient content as reported in previous studies [12]. The PI values of all physiographic units with low P and K were less than 40. These units were consequently classified as low productivity class. The PI value of soils of Ap1 and Ap2 with high P and low K was less than 40, thereby, these soils also qualified for low productive class. However, the fine loamy soils of Ap3 with high P and low K had PI values 60. These soils were rated as highly productive. The PI factor was low (<40) for the coarse and stratified soils (Ap1 and FP) and medium textured soils (Ap2) with medium P and low K whereas it was medium (41 - 60) for fine textured soils (Ap3). The coarse-textured soils (Ap1 and FP) with medium P and K qualified for low productivity class. The medium and fine-textured soils (Ap3) with similar nutrient status (medium P and K) were categorized as medium and high productivity class, respectively. The PI for soils of Ap1 and FP units with medium K and high P values were found to be medium due to textural limitations, in spite of medium to high nutrient status. Hence, these soils were classified under the medium productivity class. The PI of Ap2 and Ap3 was 64 and 80, respectively. The productivity class with high P and K was medium for FP and Ap1, high for Ap2 and very high for Ap3 which clearly indicates the role of texture in determining the PI.
The area distribution of different productivity classes was in the order of high (65.4%) > medium (19.9%) > Low (8.0%) > Very high (6.7%). This suggested that the soils of high and very high productivity class have no limitation in respect of texture and nutrient status and was found to cover 65.4 percent and 6.7 percent area of total geographical area of the district, respectively. The low and medium productive soils were limited by either texture or low nutrient status. The soils with low productivity are mainly from Ap1 and FP, as such, these are mainly suitable for cultivation of groundnut, gram, mustard etc.
5. Conclusions
This study showed that soils with high to very high productivity class are suitable for paddy and wheat cultivation, whereas the soils with low productivity are mainly suitable for cultivation of groundnut, gram, mustard etc.
Using these data and other ancillary spatial information in the GIS environment, it is possible to identify and map similar soil characteristics that can be used to predict potentials and constraints of land for specific crop production.
REFERENCES
- M. R. Cater, E. G. Greogirch, D. W. Anderson, H. H. Janzen and F. J. Pierce, “Concepts of Soil Quality and Their Significance,” Developments in Soil Science, Vol. 25, Elsevier Science, Amsterdam, 1997, pp. 1-19.
- J. H. Huddleston, “Development and Use of Soil Productivity Ratings in the United States,” Geoderma, Vol. 32, No. 4, 1984, pp. 297-317. doi:10.1016/0016-7061(84)90009-0
- D. L. Karlen and D. E. Stott, “A Framework for Enhancing Physical and Chemical Indicators of Soil Quality,” Soil Science Society of America, Vol. 35, 1994, pp. 53-72.
- G. W. Petersen, G. C. Bell, K. McSweeney, G. A. Nielsen and P. C. Robert, “Geographical Information System in Agronomy,” Advances in Agronomy, Vol. 55, 1995, pp. 67-111. doi:10.1016/S0065-2113(08)60538-6
- Soil Survey Staff, “Soil Ratings for Plant Growth, A System for Arraying Soils According to Their Inherent Productivity and Suitability for Crops,” USDA, Natural Resource Conservation Service, National Soil Survey Centre, Lincoln, 2000.
- J. M. Duxbury, I. P. Abrol, R. K. Gupta and K. F. Bronson, “Analysis of Long-Term Soil Fertility Experiments with Rice-Wheat Rotations in South Asia,” In: I. P. Abrol, et al., Eds., Long-Term Soil Fertility Experiments with Rice-Wheat Rotations in South Asia, Rice Wheat Consortium for the Indo-Gangetic Plains, New Delhi, 2000, pp. 7-22.
- P. K. Sharma, “Emerging Technologies of Remote Sensing & GIS for the Develop of Spatial Data Infrastructure,” Journal of the Indian Society of Soil Science, Vol. 52, No. 4, 2004, pp. 384-406.
- A. Huete, “Remote Sensing of Soils and Soil Processes,” In: S. Ustin, Ed., Remote Sensing for Natural Resources Management and Environmental Monitoring: Manual of Remote Sensing, 3rd Edition, John Wiley and Sons, Inc., New York, 2004.
- S. R. Olsen, C. V. Cole, F. S. Watanabe and L. A. Dean, “Estimation of Available P in Soils by Extraction with NaHCO3,” USDA Circulation, Washington DC, 1954.
- P. F. Pratt, “Potassium,” In: A. L. Page, R. H. Miller and D. R. Keeney, Eds., Methods of Soil Analysis. Part II. Chemical and Microbiological Properties, American Society of Agronomy, Madison, 1982, pp. 225-246.
- J. D. Riquier, B. Luis and J. P. Cornet, “A System for Soil Appraisal in Terms of Actual and Potential Productivity,” Soil Resource Development and Conservation Service, Land and Water Development Division, 1970, pp. 1-35.
- V. K. Verma, R. K. Setia, P. K. Sharma, C. Singh and A. Kumar, “Pedospheric Variations in Distribution of DTPA— Extractable Micronutrients in Soils Developed on Different Physiographic Units in Central Parts of Punjab, India,” International Journal of Agriculture and Biology, Vol. 7, No. 2, 2005, pp. 243-246.