Natural Science
Vol.5 No.2A(2013), Article ID:28377,7 pages DOI:10.4236/ns.2013.52A043
A cost-optimal scenario of CO2 sequestration in a carbon-constrained world through to 2050
![]()
Transdisciplinary Initiative for Global Sustainability, The University of Tokyo, Tokyo, Japan; takeshita@ir3s.u-tokyo.ac.jp
Received 13 January 2013; revised 10 February 2013; accepted 24 February 2013
Keywords: CO2 Sequestration; Simulation; Optimization; Global Energy System Model
ABSTRACT
In this paper, a regionally disaggregated global energy system model with a detailed treatment of the whole chain of CO2 capture and storage (CCS) is used to derive the cost-optimal global pattern of CO2 sequestration in regional detail over the period 2010-2050 under the target of halving global energy-related CO2 emissions in 2050 compared to the 2005 level. The major conclusions are the following. First, enhanced coalbed methane recovery will become a key early opportunity for CO2 sequestration, so coalrich regions such as the US, China, and India will play a leading role in global CO2 sequestration. Enhanced oil recovery will also have a participation in global CO2 sequestration from the initial stage of CCS deployment, which may be applied mainly in China, southeastern Asia, and West Africa in 2030 and mainly in the Middle East in 2050. Second, CO2 sequestration will be carried out in an increasing number of world regions over time. In particular, CCS will be deployed extensively in today’s developing countries. Third, an increasing amount of the captured CO2 will be stored in aquifers in many parts of the world due to their abundant and widespread availability and their low cost. It is shown that the share of aquifers in global CO2 sequestration reaches 82.0% in 2050.
1. INTRODUCTION
Avoiding dangerous climate change is an increasingly formidable challenge. CO2 capture and storage (CCS) is now recognized as an important option for mitigating climate change. Research, development, and demonstration for CCS are ongoing not only in developed countries, but also in at least 19 developing countries. Although it has been indicated that CCS has advantages over other CO2 mitigation options in terms of CO2 emissions reduction potential and cost-effectiveness (e.g., [1,2]), there are still major hurdles to widespread deployment of CCS. First of all, it must be proven that CO2 can be permanently and safely stored underground. Second, public acceptance of storing CO2 underground must be gained.
Under these circumstances, identifying in advance the future likely CO2 storage sites is considered to be highly useful in overcoming the above two hurdles. This is because much time and effort can be spent on better understanding the geological properties of potential CO2 storage sites, on giving potential host communities for CO2 storage sites a detailed explanation on the necessity, scope, and safety of the CO2 storage project, and on building a reliable relationship with them. Also, taking into account that an important feature of CCS is that it is capital intensive, this would help all stakeholders (including governments, utilities, and CCS industries) make rational decisions on CCS infrastructure design.
Thus, the purpose of this paper is to derive the costoptimal global pattern of CO2 sequestration in regional detail over the period to 2050 under a stringent CO2 emissions reduction constraint (i.e., a halving of global energy-related CO2 emissions in 2050 compared to the 2005 level). The cost-optimal global pattern of interregional CO2 transportation to CO2 storage sites is also drawn and analyzed under this constraint. These analyses are done by using the global energy system model REDGEM70 (an acronym for a REgionally Disaggregated Global Energy Model with 70 regions) [3,4], which treats the whole chain of CCS in detail.
2. METHODOLOGY
2.1. Overview of the REDGEM70 Model
REDGEM70 is a technology-rich, bottom-up global energy systems optimization model formulated as an intertemporal linear programming problem. Figure 1 schematically illustrates the structure of the model. With a 5% discount rate, the model is designed to determine the cost-optimal energy strategy (e.g., the cost-optimal
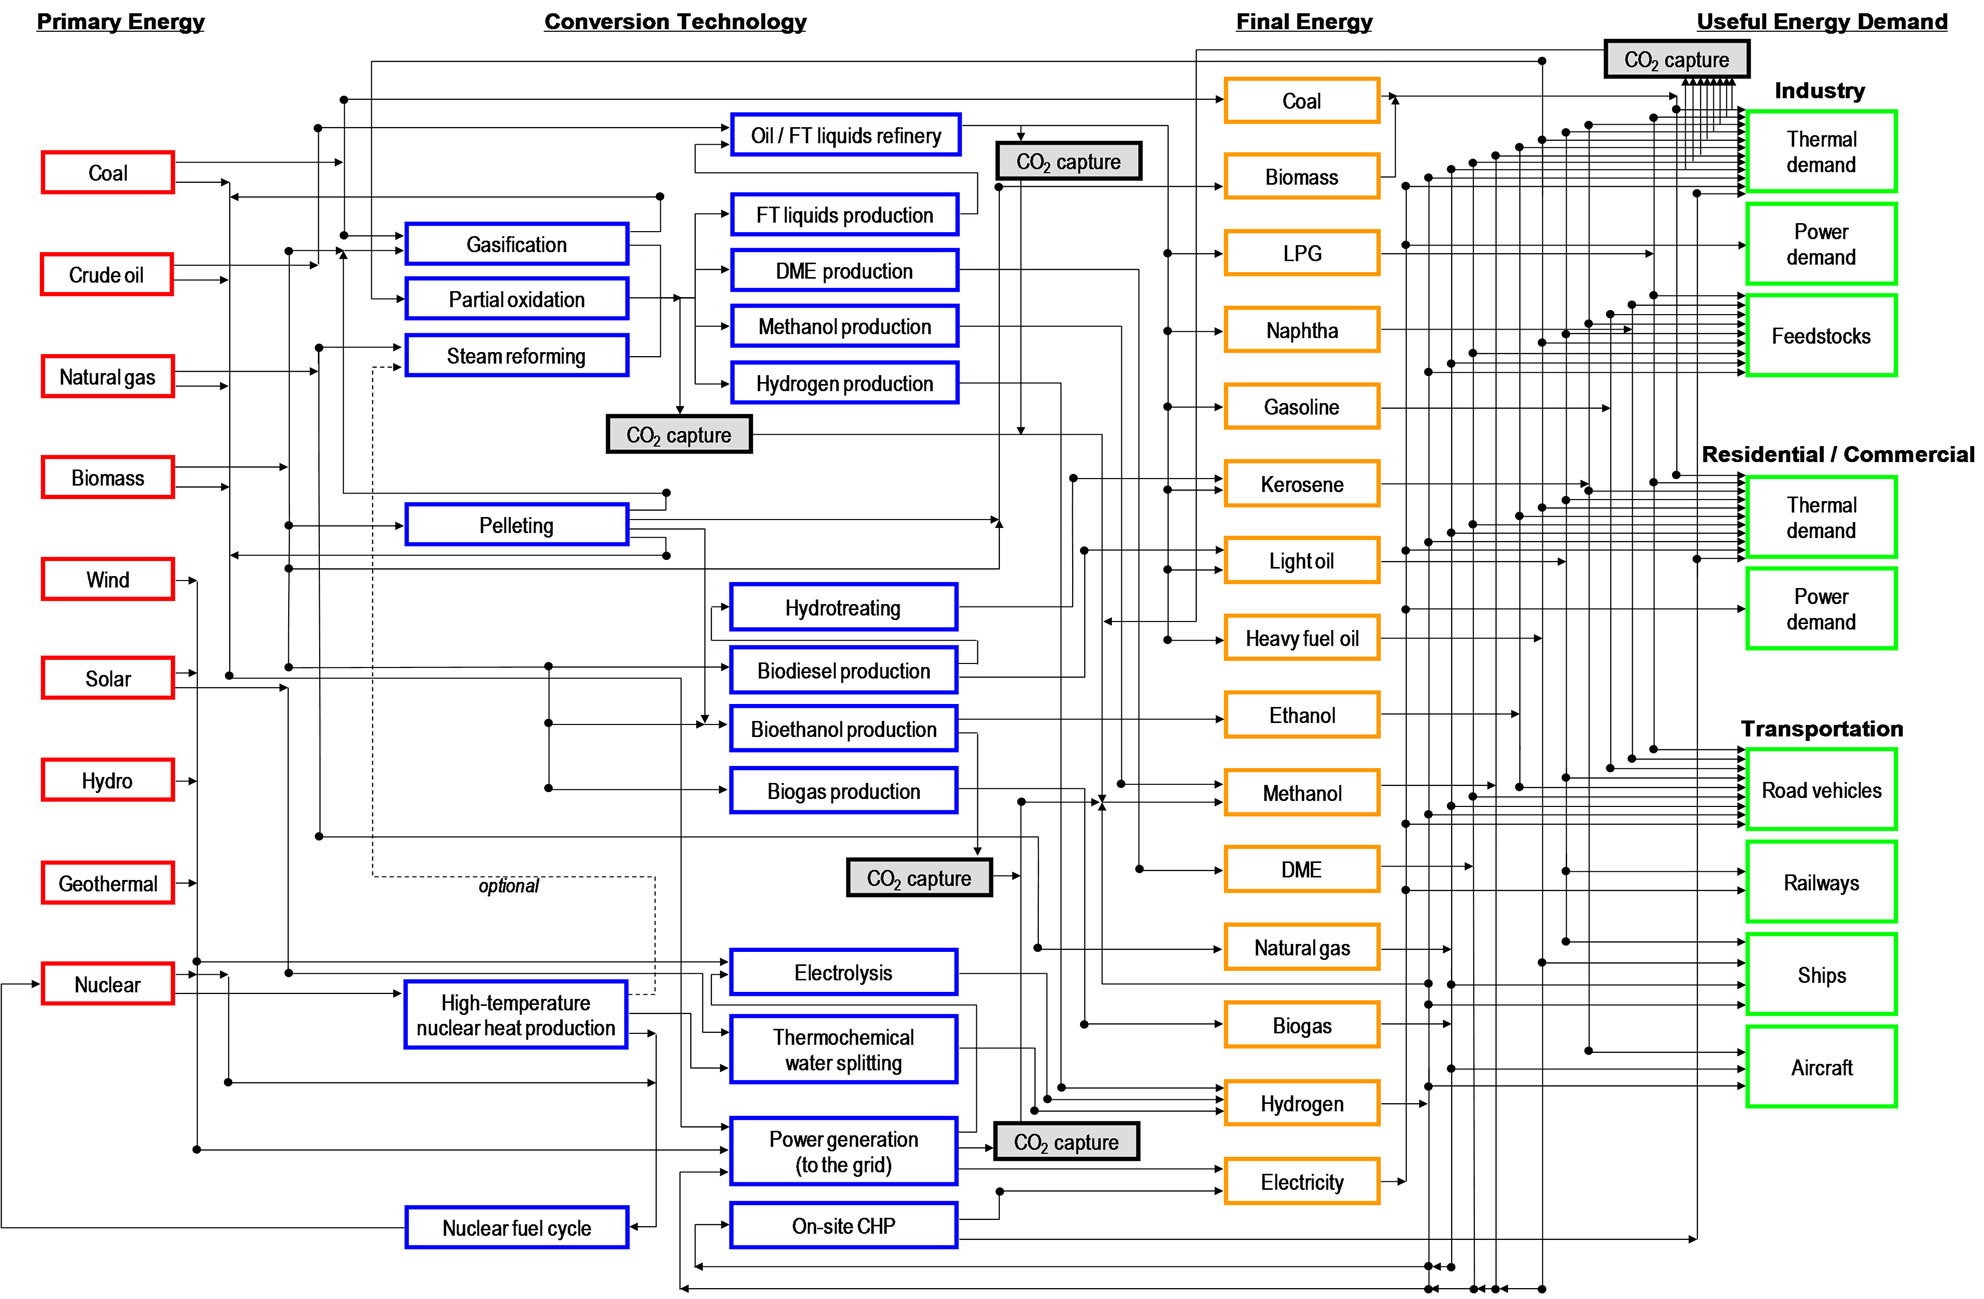
Figure 1. Schematic representation of the structure of REDGEM70a. aFT: Fischer-Tropsch; DME: dimethyl ether; LPG: liquefied petroleum gas; CHP: combined heat and power.
choice of technology options) from 2010 to 2050 at 10-year intervals for each of 70 world regions so that total discounted energy system costs are minimized under constraints on the satisfaction of exogenously given energy end-use demands, the availability of primary energy resources, material and energy balances, the maximum growth rates of new technologies, etc. In the model, price-induced energy demand reductions and energy efficiency improvements, fuel switching to less carbonintensive fuels, and CCS in geologic formations are the three options for CO2 emissions reduction.
Furthermore, in the current version of the model used in this study, there is also a constraint that global energyrelated CO2 emissions in 2050 are to be halved compared to the 2005 level. This constraint is the same as that given in the International Energy Agency’s BLUE Map scenario [1,5]. The model has a full flexibility in where CO2 emissions reduction is achieved to meet this constraint.
Figure 2 shows how the 70 world regions are defined in REDGEM70. These 70 regions are categorized into “energy production and consumption regions” and “energy production regions”. The whole world was first divided into the 48 energy production and consumption regions to which future energy end-use demands are allocated. The 22 energy production regions, which are defined as geographical points, were then distinguished from the energy production and consumption regions to represent the geographical characteristics of the areas endowed with large amounts of fossil energy resources. While the 48 energy production and consumption regions cover the global final energy consumption, all the energy-related activities except final energy consumption are conducted in each of the two region types in the model. Such a detailed regional disaggregation enables the explicit consideration of regional characteristics in terms of energy resource supply, energy demands, CO2 storage capacity, geography, and climate.
Future trajectories for energy end-use demands were estimated as a function of those for socio-economic driving forces such as population and income in the intermediate B2 scenario developed by [6]. Allocation of the energy end-use demand estimates to the 48 energy production and consumption regions was done by using countryand state-level statistics/estimates (and projections if available) on population, income, geography, energy use by type, and transport activity by mode, and by taking into account the underlying storyline of the B2 scenario that regional diversity might be somewhat preserved throughout the 21st century.

Figure 2. Regional disaggregation of REDGEM70.
Assumptions on the availability and extraction cost of fossil energy resources are taken from [7]. For biomass resources, REDGEM70 considers not only terrestrial biomass (such as energy crops and modern fuelwood), but also waste biomass. The availability of these biomass resources and excess cropland that can be used for energy purposes without conflicting with other biomass uses such as food production was estimated for each region and each time point. They were estimated assuming that biomass is produced in a sustainable way so that biomass-derived energy carriers can be regarded as carbon neutral. Data for these biomass resources (e.g., resource availability, yields per hectare of land, and supply costs) are provided in [8]. These resource availability estimates were then allocated to the 70 model regions by using country-, state-, and site-level statistics/estimates.
2.2. CCS Sector
In REDGEM70 as shown in Figure 1, the CO2 generated from power plants (excluding those used for on-site CHP production and biomass-fired steam-cycle power generation), synthetic fuels production plants (excluding those used for converting stranded gas and decentralized small-scale hydrogen production), ethanol production plants, oil/FT refinery plants, and industrial processes can be captured for subsequent sequestration in geologic formations. It is assumed that the captured CO2 is transported intraregionally (and interregionally if needed) to a storage site and then stored in geologic formations. Data for CO2 capture technologies are provided in [8,9]. The costs of all types of CO2 capture technologies, which represent the bulk of the overall CCS costs, are assumed to be reduced by 15.6% from 2010 to 2050 [10].
The cost of intraregionally transporting the captured CO2 from fossil-fueled plants to a storage site was estimated to be 24.1 US $2007 per tonne of carbon, assuming that it is transported intraregionally through 250 km of pipeline [8,10]. On the other hand, due to the dispersed nature of biomass feedstocks, the intraregional transportation of the captured CO2 from biomass-fueled plants to a storage site is assumed to suffer from diseconomies of small scale. Based on [8], the cost of intraregionally transporting the captured CO2 from biomass-fueled plants to a storage site was estimated to be in the range of 59.0 - 95.4 US $2007 per tonne of carbon depending on secondary energy carriers produced from biomass.
REDGEM70 treats the interregional transportation of CO2 between representative cities/sites in the 70 model regions and is able to determine its cost-optimal evolution path. Figure 3 shows the interregional CO2 transportation costs as a function of transportation distance for each mode. In advance of model simulations, possible interregional transportation routes were given between representative cities/sites in the 70 model regions and their distances were calculated using geographic information system (GIS) land cover data, GIS land use data, and land elevation data. Thus, the cost of transporting a tonne of carbon between every couple of representative cities/sites in the 70 model regions is an input to the model.
The geologic CO2 sequestration options included are enhanced oil recovery (EOR), enhanced coalbed methane recovery (ECBMR), depleted gas-field disposal, and aquifer disposal. Table 1 shows the input data for CO2 sequestration options. In addition to CO2 sequestration costs listed in Table 1, a monitoring cost of 0.864 US $2007 per tonne of carbon stored is assumed to be required [13].
Figure 4 shows the regional distribution of CO2 storage capacity. The regional distribution of CO2 storage capacity in aquifers was derived from data reported in
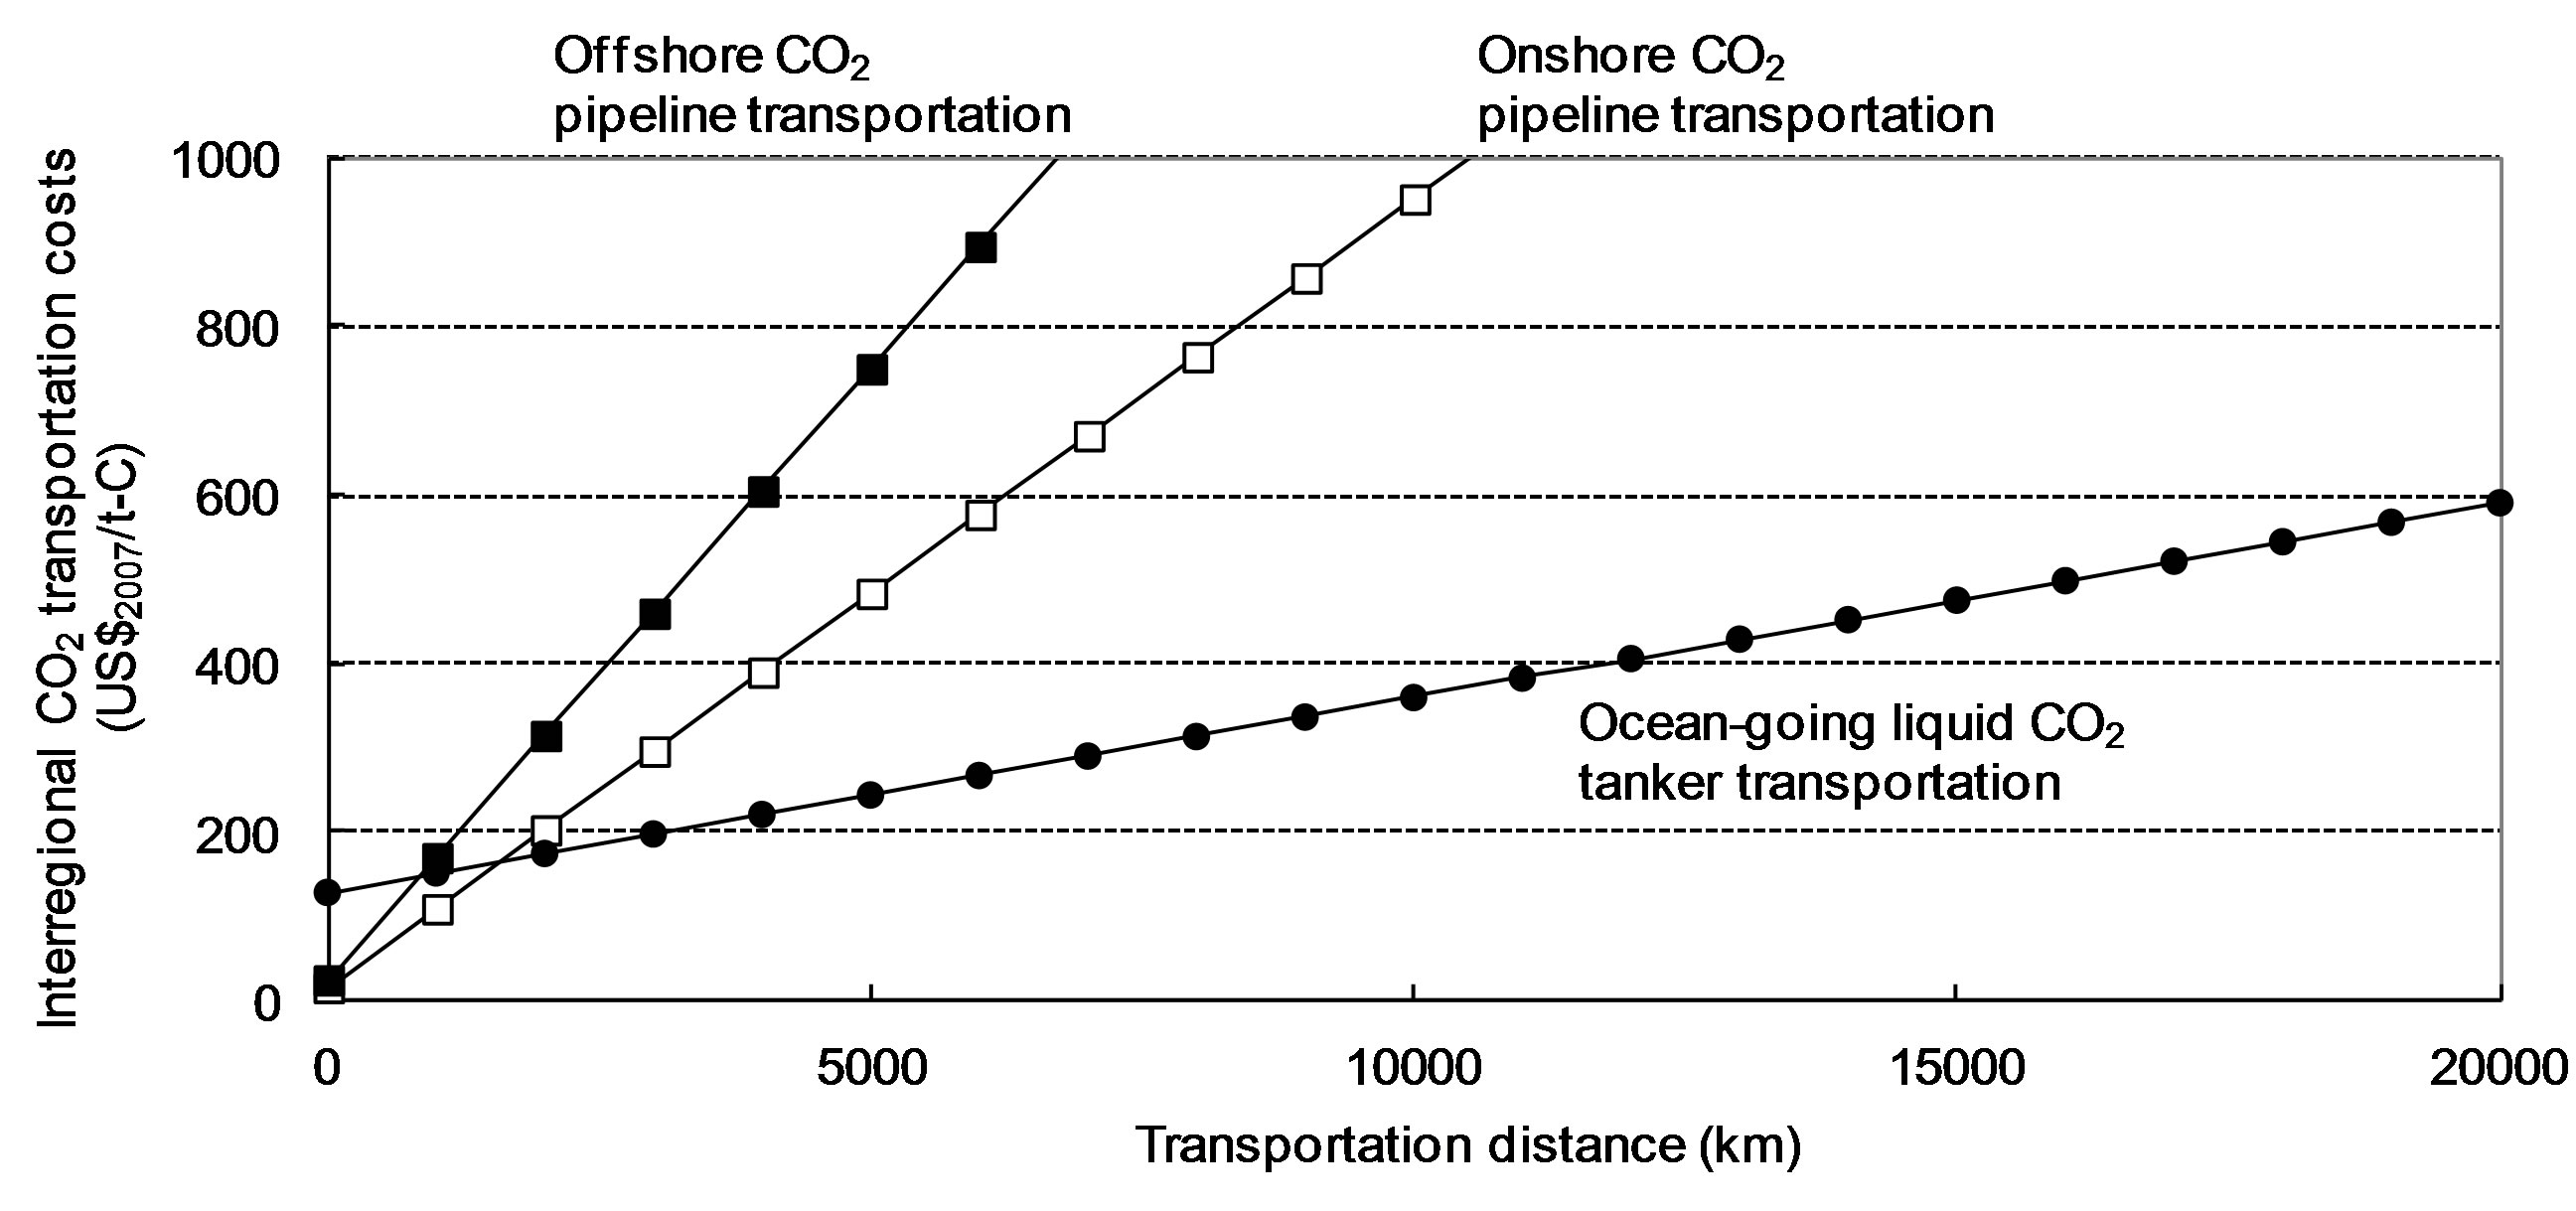
Figure 3. Interregional CO2 transportation costs as a function of transportation distance.
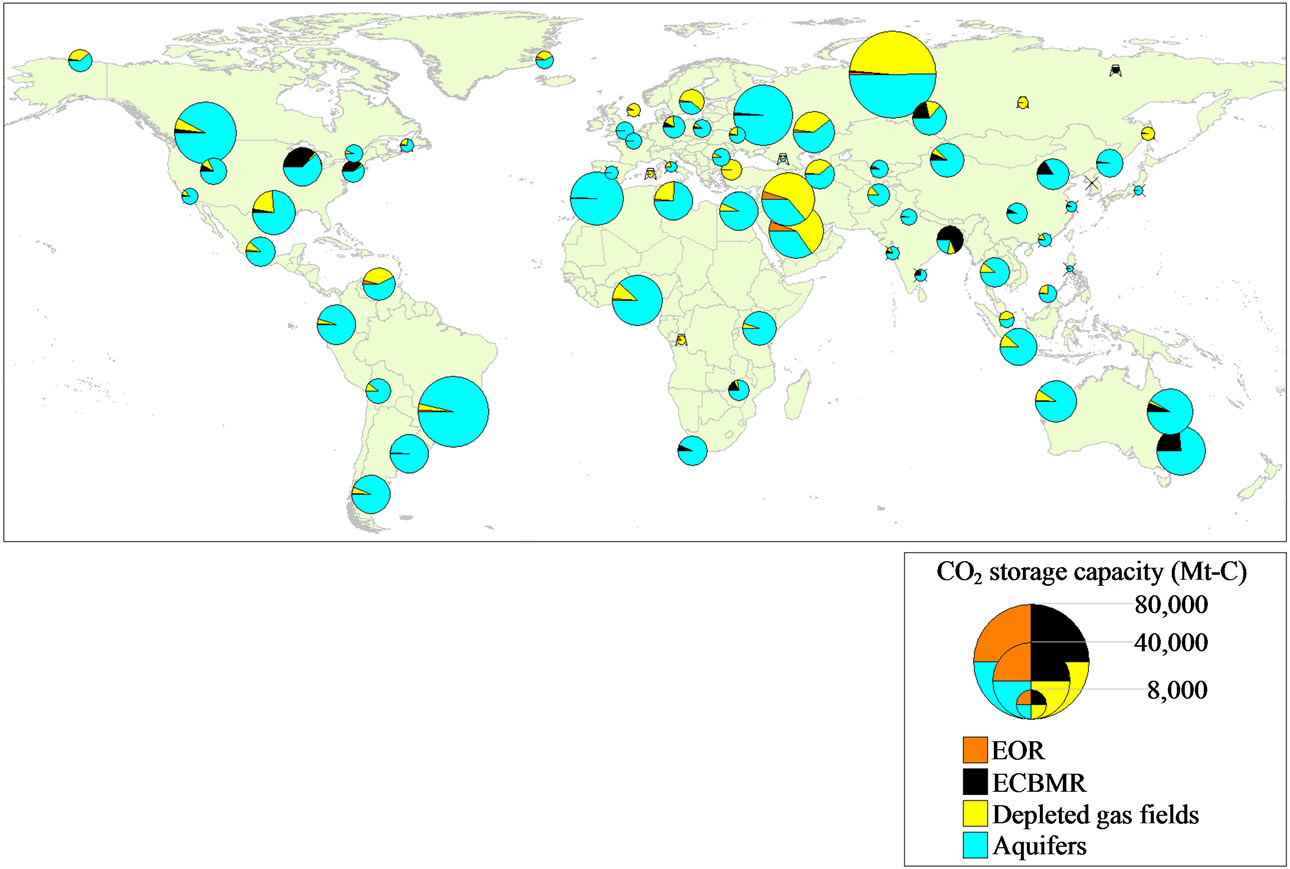
Figure 4. Estimated regional distribution of CO2 storage capacitya. aTowers indicate representative sites in energy production regions, while crosses indicate representative cities in energy production and consumption regions.

Table 1. Data for geologic CO2 sequestration optionsa.
[11]. Following the approach taken by [12], the regional distribution of CO2 storage capacity in EOR sinks, ECBMR sinks, and depleted gas fields was estimated from that of conventional oil resource base, anthracite and bituminous coal resource base, and conventional natural gas resource base, respectively.
3. RESULTS AND DISCUSSION
3.1. Globally Aggregated Results for CO2 Sequestration
Before examining the cost-optimal pattern of CO2 sequestration on a regional basis, the focus is placed on the globally aggregated results. Figure 5" target="_self"> Figure 5 shows the evolution of the global amount of CO2 sequestration by type of storage option. This result implies that large-scale commercial deployment of CCS is likely to begin around 2030 under the stringent CO2 emissions reduction constraint. As technological progress in the field of CCS technologies advances over time, they make an increasing contribution to CO2 emissions reduction. The share of CCS in global energy-related CO2 emissions reduction compared to the business-as-usual case without any CO2 constraints increases from 1.5% in 2020 to 17.7% in 2050.
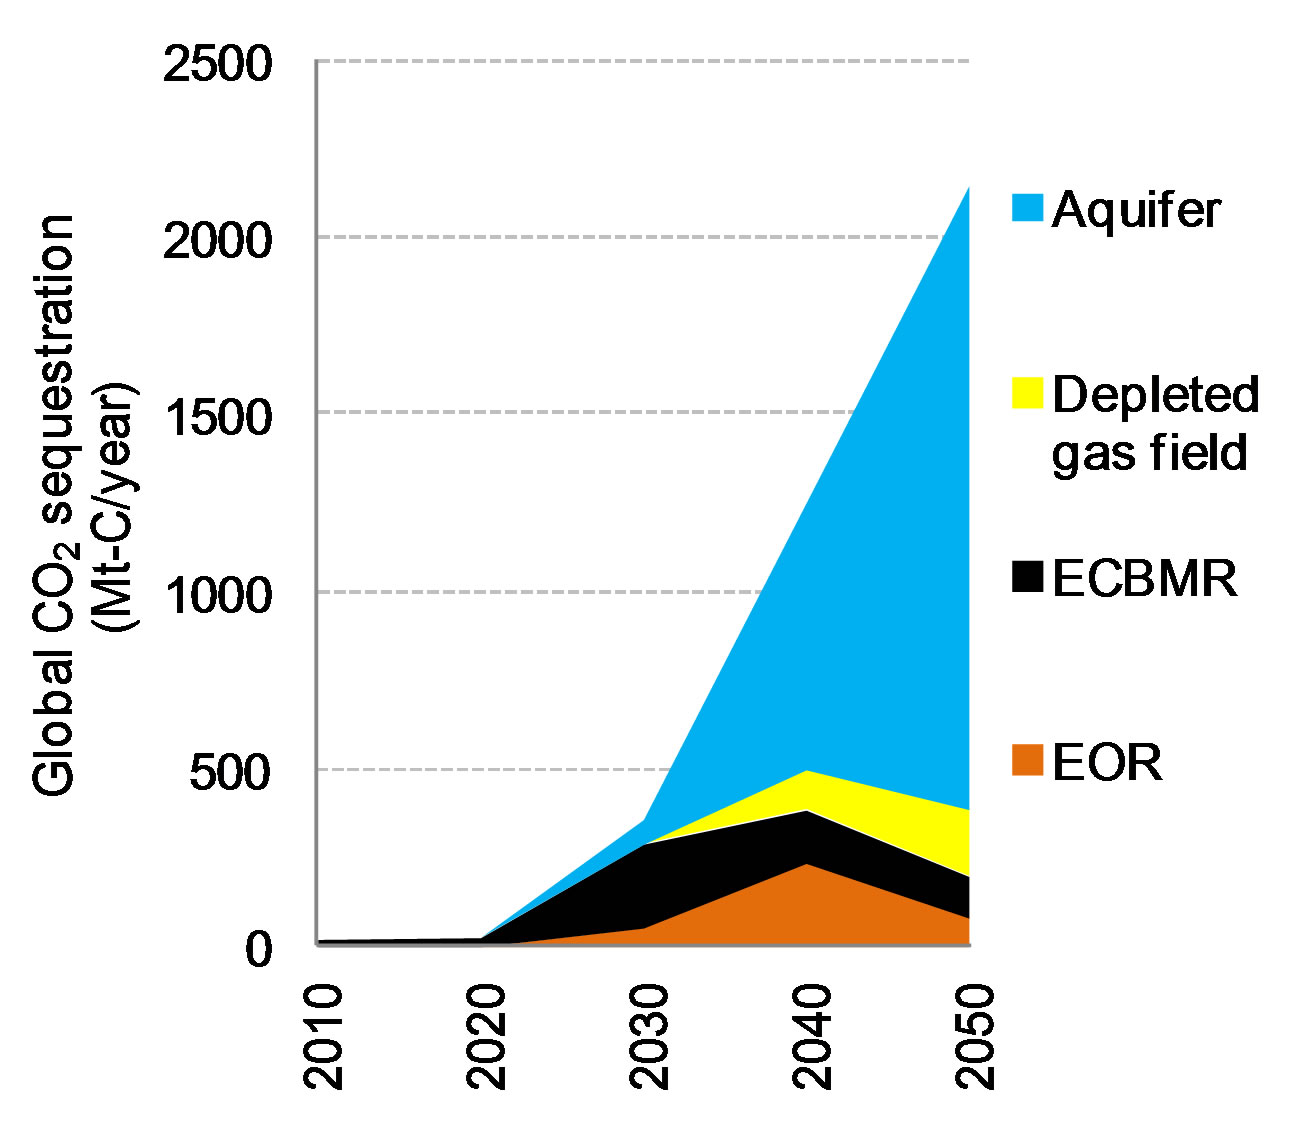
Figure 5. Global CO2 sequestration by type of storage option.
Total cumulative CO2 sequestration over the period 2010-2050 amounts to 38 gigatonnes of carbon, which account for only 4% of global CO2 storage capacity. This means that after meeting the stringent constraint imposed on global energy-related CO2 emissions in 2050 (i.e., in the second half of the century), CCS can play a significant role in reducing CO2 emissions.
As regards geologic CO2 sequestration options, ECBMR is chosen first because very low, or even negative, costs can be achieved through offsetting revenues from the natural gas produced in ECBMR operations. This is also true for EOR: in the initial phase of CCS deployment, EOR operations are one of the pillars of global CO2 sequestration. It can therefore be argued that CO2 sequestration combined with enhanced hydrocarbon recovery creates an early opportunity for CCS.
In contrast, aquifers account for a dominant share of global CO2 sequestration in the second half of the time horizon: their share in global CO2 sequestration increases from 60.2% in 2040 to 82.0% in 2050. This is due to their abundant and widespread availability and their low cost (see Table 1 and Figure 4). It is noteworthy that all the four options have a visible participation in global CO2 sequestration from 2030 onwards, when large-scale CCS deployment begins.
3.2. Cost-Optimal Pattern of CO2 Sequestration and Transportation
Figures 6 and 7 illustrate the global pattern of geologic CO2 sequestration and CO2 transportation for 2030 and 2050, respectively. In 2030, large-scale CO2 sequestration is carried out in a limited number of regions. More specifically, regions rich in coal resource base (e.g., the US, China, India, Australia, and South Africa) take the lead in CO2 sequestration, reflecting the large share of ECBMR operations in global CO2 sequestration at this point in time.
Although not shown here, CO2 capture is implemented predominantly in coal-fueled plants in 2030 because the incremental cost of CO2 capture is lower for them than for plants fueled by other carbonaceous feedstocks, which is due to economies of scale caused by the high carbon content of coal and the large scale of coal-fueled plants. This also explains why large-scale CCS deployment starts in these coal-rich regions. However, the capture of CO2 from coal-fueled plants loses its share over time under the stringent CO2 emissions reduction constraint. The main reason is that CO2 emissions from coal-fueled plants with CCS are unacceptable under this constraint because coal has the highest carbon emission factor of all fossil fuels and because the efficiency of CO2 capture for those plants is not 100% (about 90% - 95%).
Among others, EOR operations in regions with oil fields that are in decline (e.g., China, southeastern Asia, and West Africa) and aquifer storage in southeastern and western Asia play a role in global CO2 sequestration in 2030. It is important to note that interregional CO2 transportation is not chosen at all in 2030 because of the widespread distribution of geologic formations with large CO2 storage capacity and the high cost of CO2 transportation. In other words, it is cost-effective to sequester the CO2 captured from a model region in geologic formations in that region.
It should be noted, however, that the realization of the CCS potential in today’s developing countries actually depends on the effective transfer of technologies and funds from today’s industrialized countries and on global efforts to reduce CO2 emissions. Without them, CCS would not be deployed on such a large scale in today’s developing countries.
As shown in Figure 7, the picture changes dramatically in 2050. At this point in time, geologic CO2 sequestration is carried out all over the world. It should be emphasized that CCS is deployed fairly extensively in today’s developing countries. In particular, Latin America, tropical central Africa, and southeastern Asia account for a large share of global CO2 sequestration in 2050. This is because the strategy of negative CO2 emissions provided by combining bioenergy conversion technologies with CCS is adopted in these regions rich in high-quality woody biomass resources to meet the stringent CO2 emissions reduction constraint. On the contrary, the amount of CO2 sequestration is tiny in Japan and Korea due to their very small CO2 storage capacity.
Whereas the large amount of the captured CO2 is stored in aquifers in many parts of the world, the other three options also make a non-negligible contribution to global CO2 sequestration in 2050. Similar to the results for 2030, ECBMR is applied in coal-rich regions such as India, the US, Russia, and Australia. On the other hand, EOR begins to be applied on a large scale in the Middle East, where giant oil fields exist, as oil production from

Figure 6. Global pattern of geologic CO2 sequestration and CO2 transportation in 2030a. aSame as footnote a in Figure 4.

Figure 7. Global pattern of geologic CO2 sequestration and CO2 transportation in 2050a. aSame as footnote a in Figure 4.
them becomes increasingly mature. CO2 sequestration in depleted gas fields is carried out on a large scale in regions where large quantities of conventional natural gas are produced (e.g., the US, the Middle East, and China).
Except for the route from Korea to the Far East in Russia, interregional CO2 transportation is not chosen in 2050 for the same reason as was described for 2030. The captured CO2 is interregionally transported only from Korea because it was estimated to have very small CO2 storage capacity [11], because Korea has access to onshore geologic formations with sufficient CO2 storage capacity within a relatively short distance, and because pipelines can make the short-distance transportation of CO2 over land economical (see Figure 3). It can also be seen that the long-distance transportation of CO2 by sea is unlikely to be done at least until 2050 due to the relatively close geographical proximity between CO2 sources and sinks and to the high cost of shipping CO2 by sea over such short distances (see Figure 3).
These results do not mean that CO2 transportation will play a marginal role under the stringent CO2 emissions reduction constraint. Rather, intraregional CO2 transportation and CO2 distribution networks built for this purpose will be a major component of a CCS system because there is to some extent a regional mismatch between CO2 point sources and CO2 sinks in most cases [2,13]. Taken together, great emphasis should be put on building infrastructure for short-distance CO2 transportation over land to establish the cost-optimal CCS system.
Geologic CO2 sequestration is hardly carried out in the 22 energy production regions of the model throughout the time horizon. This is because the interregional transportation of fossil fuels to the place of their use (i.e., the 48 energy production and consumption regions of the model) followed by their conversion to secondary energy combined with CCS is less costly than their conversion to secondary energy combined with CCS followed by the interregional transportation of secondary energy such as electricity and hydrogen.
4. CONCLUSIONS
Using the regionally disaggregated global energy system model with a detailed treatment of the whole chain of CCS, this paper has derived the cost-optimal global pattern of CO2 sequestration in regional detail over the period 2010-2050 under the target of halving global energy-related CO2 emissions in 2050 compared to the 2005 level. Also, prospects for interregional CO2 transportation have been discussed under this target. Four major findings were obtained.
First, ECBMR will become a key early CO2 sequestration opportunity because it can generate revenues that offset all or part of the costs of CO2 capture and transportation. Accordingly, coal-rich regions such as the US, China, India, Australia, and South Africa will take the lead in CO2 sequestration. For the same reason, EOR will also play a role in global CO2 sequestration from the initial stage of CCS deployment, which may be applied mainly in China, southeastern Asia, and West Africa in 2030 and mainly in the Middle East in 2050.
Second, over time, CO2 sequestration activities will become more spatially dispersed and an increasing amount of the captured CO2 will be stored in aquifers in many parts of the world due to their abundant and widespread availability and their low cost. It is cost-effective to deploy CCS extensively in today’s developing countries, implying the importance of the effective transfer of technologies and funds from today’s industrialized countries. According to the results for 2050, CO2 sequestration is carried out in the majority of world regions and the share of aquifers in global CO2 sequestration reaches 82.0%.
Third, all the four options will make a visible contribution to global CO2 sequestration. The captured CO2 may be stored in depleted gas fields mainly in the US, the Middle East, and China.
Fourth, the interregional, long-distance transportation of CO2 is unlikely to be chosen throughout the time horizon. This is due to the widespread distribution of geologic formations with large CO2 storage capacity and the high cost of CO2 transportation.
Readers, however, should be aware of a limitation of this study. As pointed out by many authors, regional differences in CO2 policy actions and targets, CO2 policy framework and incentives, and other political issues, which are not fully considered in the model, are likely to have a large impact on where CCS technologies are deployed in the “real world”. Thus, the results of this study must be interpreted with caution. Nevertheless, this study is novel and significant in that the findings obtained from the regionally disaggregated results have important implications for the cost-optimal pattern of CCS deployment and the strategic planning of CCS infrastructure.
REFERENCES
- IEA (2008) Energy technology perspectives 2008. IEA, Paris.
- IEA (2004) Prospects for CO2 capture and storage. IEA, Paris.
- Takeshita, T. and Yamaji, K. (2008) Important roles of Fischer-Tropsch synfuels in the global energy future. Energy Policy, 36, 2791-2802. doi:10.1016/j.enpol.2008.02.044
- Takeshita, T. (2012) Assessing the co-benefits of CO2 mitigation on air pollutants emissions from road vehicles. Applied Energy, 97, 225-237. doi:10.1016/j.apenergy.2011.12.029
- IEA (2010) Energy technology perspectives 2010. IEA, Paris.
- International Institute for Applied Systems Analysis (2007) GGI scenario database. http://www.iiasa.ac.at/Research/GGI/DB/
- Rogner, H.-H. (2012) Energy resources and potentials. In: Johansson, T.B., Patwardhan, A., Nakicenovic, N. and Echeverri, L.G., Eds., Global Energy Assessment (GEA), Cambridge University Press, New York, 425-512. doi:10.1017/CBO9780511793677.013
- Takeshita, T. (2009) A strategy for introducing modern bioenergy into developing Asia to avoid dangerous climate change. Applied Energy, 86, S222-S232. doi:10.1016/j.apenergy.2009.04.023
- Takeshita, T. (2011) Competitiveness, role, and impact of microalgal biodiesel in the global energy future. Applied Energy, 88, 3481-3491. doi:10.1016/j.apenergy.2011.02.009
- Riahi, K., Barreto, L., Rao, S. and Rubin, E.S. (2005) Towards fossil-based electricity systems with integrated CO2 capture: Implications of an illustrative long-term technology policy. Proceedings of the 7th International Conference on Greenhouse Gas Control Technologies, Elsevier, Amsterdam, 921-929. doi:10.1016/B978-008044704-9/50093-8
- Research Institute of Innovative Technology for the Earth (2002) Study project for implementation planning of the New Earth program. New Energy and Industrial Technology Development Organization, Tokyo.
- Takeshita, T. and Yamaji, K. (2006) Potential contribution of coal to the future global energy system. Environmental Economics and Policy Studies, 8, 55-88.
- IPCC (2005) Special report on carbon dioxide capture and storage. Cambridge University Press, Cambridge.