Health
Vol.5 No.4(2013), Article ID:29925,7 pages DOI:10.4236/health.2013.54096
Local climate changes and the spread of malaria in Rwanda
![]()
Department of Physical Geography, University of Kaiserslautern, Kaiserslautern, Germany; sascha.henninger@ru.uni-kl.de
Copyright © 2013 Sascha M. Henninger. This is an open access article distributed under the Creative Commons Attribution License, which permits unrestricted use, distribution, and reproduction in any medium, provided the original work is properly cited.
Received 8 February 2013; revised 18 March 2013; accepted 2 April 2013
Keywords: Rwanda; Climate Change; Malaria; Vectors; Central Africa
ABSTRACT
A population’s health makes it possible to draw conclusions about a country’s general development level. In connection with local climatic changes, for example, we can assess how well a society adjusts to the new conditions. To that effect, it has been observed during the last few years that global climate change can also affect human health in various ways. We can differentiate direct health impacts (e.g. extreme weather events, natural catastrophes caused by the weather) from indirect ones. However, the indirect consequences cause by far the greater damages to health. They are being spread increasingly by vectors (mosquitoes, ticks, etc.). Especially when a vector-carried infectious disease (e.g. malaria) migrates into areas where it is not endemic, considerable societal problems can result. The people living there would be immunologically unprepared.
1. INTRODUCTION
Rwanda, a mountainous tropical country in sub-Saharan Africa, is commonly regarded as a potential malarial region because of its location. However, viewed from the perspective of malaria’s incidence rate, the country’s pronounced terrain relief, with elevations ranging from 900 meters to over 4500 meters above sea level (a.s.l.), confers a decided advantage. Because of their elevations large parts of Rwanda must be regarded too cold to prevent the anopheles mosquito from spreading to the fullest extent (that would allow it to exploit its epidemiological potential). Nevertheless, an analysis of a series of Rwandan climate measurements now reveals that an increase in average annual temperatures has been observed throughout the past 40 years [1]. Now it is worth a serious consideration that as a direct consequence, vectors could advance to higher elevations. The Rwandan government still reports 1000 m a.s.l. as the epidemiological ceiling elevation for malaria cases in its territory comparable to other countries with an analogue relief and climatic conditions [2]. However, there is evidence of malarial infections spreading up to elevations of 2500 m a.s.l., not only because of Rwanda’s changing local climate conditions. The rate of infection is climbing steadily in these regions, also because their population lack widespread immunity.
The World Health Organization classifies Rwanda as malaria-endemic country as do studies by [3] as well as [4,5]. This is a meaningful way of raising awareness of the latent danger. However, the geographical spread of the anopheles mosquito in Rwanda, as the crucial vector, was naturally limited by altitude and the concomitant moderate temperatures [6]. Moreover, a shift in the spread of malaria has taken place especially in the countries of sub-Saharan Africa during the past decades [7-9]. Africa’s cities, steadily growing for years, have exhibited a diminution in malaria cases compared with the surrounding countryside, as exemplified in the east African states of Ethiopia [10], Uganda and Kenya [11], Tanzania [12], but also in the Democratic Republic of Congo [13]. It is widely suspected that this is also a climate-induced development [14,15]. With respect to malaria-associated morbidity and mortality, furthermore, it is possible to locate geographical foci, whose former incidence rates of the disease would not necessarily have made them suspect as at-risk malarial areas [16,17]. We can nevertheless already assume that this trend will continue due to the rising temperatures. Among others this could be confirmed, deriving these types of prognoses by means of a new version of the Liverpool Malaria Model [18]. Consequently, this poses the question of the extent to which demonstrable temperature changes will also favour the spread of the anopheles mosquito in Rwanda. Not least, the lack of widespread immunity among the population would pose severe challenges to social life in some areas [2]. The investigation focuses on regional or local modifications especially caused by temperature and rainfall changes. For today’s Rwanda, as for many other malarial regions, an already mentioned altitude limit of 1000 m a.s.l. is still considered valid. This would mean that the epidemiological potential of vectors at higher altitudes should considerably diminish. Presumably, based on this theoretical foundation, the government of Rwanda still estimates the danger of being infected with malaria very low, except for some areas in the sparsely populated south. However, since it is presumed that the data base rests on information outdated as the depiction of Rwanda’s regional climate zones, it behoves us to pursue how this problem is linked to the regional climate changes of recent decades.
2. CLIMATE AND MALARIA—THE RECCIR PROJECT
As it is described in [1], an analysis of climate measurement series from Rwandan weather stations revealed that the division into four Rwandan climate zones could not hold water against a more detailed analysis based on currently available data. This led to the initiation of the ReCCiR project (Recent Climate Change in Rwanda) in 2009. So first of all, the primary project’s aim was to conduct a regional climatic analysis covering all of Rwanda and visualizing it on new maps [1].
For these purposes, the climate records from a total of 51 weather stations were accessed covering the country’s entire territory. As the project began an evaluation of Rwanda’s climate situation was made based on local climates, not regarding the fact that the weather stations (mainly temperature and rainfall readings, for the most part) were distributed throughout the country. Up until the early 1990’s a majority of the recorded data was based on the “Mannheim hours”. That meant having to assume a certain degree of inaccuracy in the results comparing manually derived data with continuous digitally recorded values. In order to be able to quantify this inaccuracy, a location was selected being able to record daily average temperature readings over a six-month time horizon with representative data collection methods using both “Mannheim hours” as well as continuous readings. This showed that the manual values differed from the digitally-logged ones by 3%. This difference was then factored into subsequent analyses, knowing well that it could not be considered as representative for all of Rwanda’s weather stations by 100%, but this finding was regarded as a correction value [1].
The time-consuming manual transfer of data from the measurement books into a usable digital form enabled to filter out transcription errors or inconsistencies, such as ones caused by faulty recording (such as 379.5˚C instead of 37.95˚C). That meant eventually discarding 19% of the entire data collection [1].
In order to safeguard the statistical reproducibility of the climate measurement results, a cluster analysis was conducted, which allowed separating the measurement station data into partial collectives or groups. The basis of the cluster analysis is a comparison of temporal patterns for the temperature curves. Group membership was assigned by Euclidean distance mapping. Data was compared using single-linkage cluster analysis. This involves comparing paired values and aggregating each most similar pair in a cluster (nearest neighbour technique) [1, 19]. The first result to be drawn from this analysis was that the climate measurement series of the remaining stations fit very well into differentiated groups corresponding to relevant regional climate zones. This result was subjected to a hypothesis test using a student’s t-test, which answered the question if there were significant differences between the individual measurement stations or if there was a null hypothesis in the case of the calculated clusters, as mapped in this form [1,19]. It showed that the weather stations not being grouped in clusters of specific weather stations, with α < 0.05 (Si = 95%) were also not correlated, confirming the results of the cluster analysis [1].
Regarding the observed rising annual average temperature trends manifested by all of Rwanda’s climate zones, it was further decided to investigate the potential possible spread of various vectors, particularly of the anopheles mosquito, as a function of changing local climatic conditions. The question to be explored was whether such modifications can be demonstrated for the country of Rwanda and, if so, how they impact the population?
Since no data on malaria infections was forthcoming from the Rwandese side, it was fallen back on direct onsite capture of patient data. Accordingly, information relating to the evaluation of malaria infections and outbreaks of the disease were collected from the respective district hospitals or local clinics (Table 1). This yielded a sizeable contingent of records for the affected patients. Thus, it was possible to trace both the time of year when the disease appeared and the spread or location of the malaria from a patient’s documented date of admission and respective domicile. This turned out to be a very good foundation for a country-wide determination and visualization of the disease’s annual course. Dependable data on rates of malaria incidence for the years after 1997, facilitate a comparison with the climate measurement series from 1997 to 2011 with the population
Table 1. Location of the meteorological stations (italic) and the district hospitals or local clinics respectively (bold).
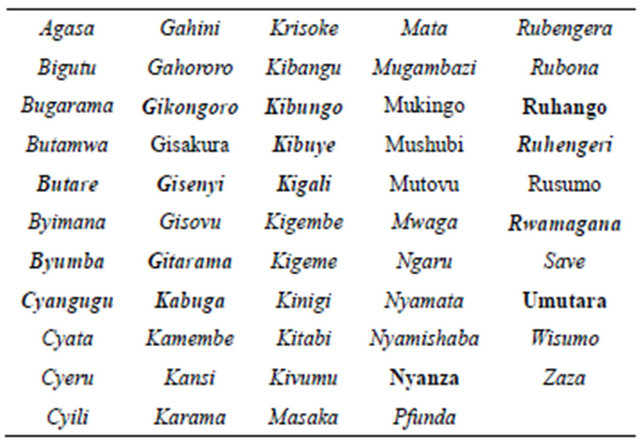
growth numbers collected since 1996.
As mentioned in [1] the area-wide development of the climatic changes was visualized as well as the malaria’s spread by resorting a method of geostatistical interpolation. Specifically, the kriging technique was used. Besides applying distance-based weights to neighbouring points, it also weights them by the value of the neighbouring point; i.e. a value that is to be interpolated is more influenced by points that lie closer to it than ones farther away. This prevents falsification through clustering as well as through the so-called “trained eye” effect. The kriging technique recommends itself as the optimal technique for geographical interpolation of diverse measurements. A sub-technique known as local ordinary kriging was used to present a picture of reality as accurate as possible. Thus, trend elimination by means of a linear function was not necessary, but the twelve measurement points lying closest to the interpolation point were incorporated in the calculation. The technique minimizes the likelihood of errors [1,20,21].
3. RECCIR PROJECT RESULTS
3.1. Local Climate Modifications
The analysis of the climate measurement series for the Rwandan weather stations began with evaluating the time series by decades, above all in order to understand the spatial changes in the regional and local climatic situation. The first minor local changes within the respective climate regions already showed up in the comparison of values (1931-1960) with the time series from 1960 to 1970. But the changes in annual average temperatures and rainfall amount became even clearer based on data between 1970 and 1990, which also manifested itself eventually in the spatial distribution of the various climate regions [1].
The modification in rainfall totals during this measurement period was comparable, with a trend toward a decrease in the rainfall amount (−240 mm). It ploted a new, regional climatic division for the country based on 1996-2011 data. The manifest local climatic changes implied that Rwanda’s old, four-part climate zone scheme no longer reflects the current situation. It was replaced by a new, six-part local or regional climatic breakdown [1].
As seen in Figure 1 compared to Figure 2, the “EastRwandan dry and hot lowland zone” spreaded farther west. The 1000-meter isohyet moved far beyond the metropolitan area of the capital city, Kigali. The rainfall amount for Kigali now went down to 900 mm [1].
The capital city, Kigali, occupies a special position. For a long time, Kigali was inside the 1000 mm isohyet in the transition zone between the temperate highland climate in the west and the savannah climate in the east. In the present day, the city’s entire catchment area must be assigned to the “East-Rwandan dry and hot lowland zone”. Just the decline in rainfall amount of 110 mm shows that the 1000 mm isohyet has shifted to the west. Moreover, an urban climate effect can be detected even for this rustic capital city with temperatures rising by an average of 1.5 K above the surrounding countryside. Added to this is the highly polluted city air [1,22-24]. Consequently, Kigali was taken into the new classification as a local climate zone (Figure 2) [1].
In the entire climate zone (“East-Rwandan dry and hot lowland zone”), the rainfall reaches maximum values of around 900 mm and the annual average temperature is 21˚C. Because of the west-moving dryness, the climatic features of the “Temperate zone of the central highlands” are shifting east and to higher elevations. Comparable with the “East-Rwandan dry and hot lowland zone”, rainfall is evidently decreasing in these areas as well (−160 mm), while, on the other hand temperatures are increasing (+1.2 K) (comp. Figures 1 and 2) [1].
The most significant modification within the temperate climate zone can be observed in the high mountainous region around Rewere (comp. Figures 1 and 2). Initially defined as “Mountain climate”, in comparison with other Rwandan locations, this area registers the highest rainfall decrease and a strong temperature increase being anomalous for these altitudes. This development is similar in the high mountain regions in the country’s north as well as in the south. A markedly more temperate climate is evident on the Rift ridge and also on the Virunga volcano range [1]. Population pressures have been growing in the recent years in these regions because of the changes in the region’s climate. On top of the generally strong population growth rate, people are migrating from the eastern, drier parts of the country to the central highland searching of better farming conditions and food security. Due to the declining precipitation, cultivation of some agricultural products is no longer possible in parts of the “East-Rwandan hot and dry lowland zone” or only
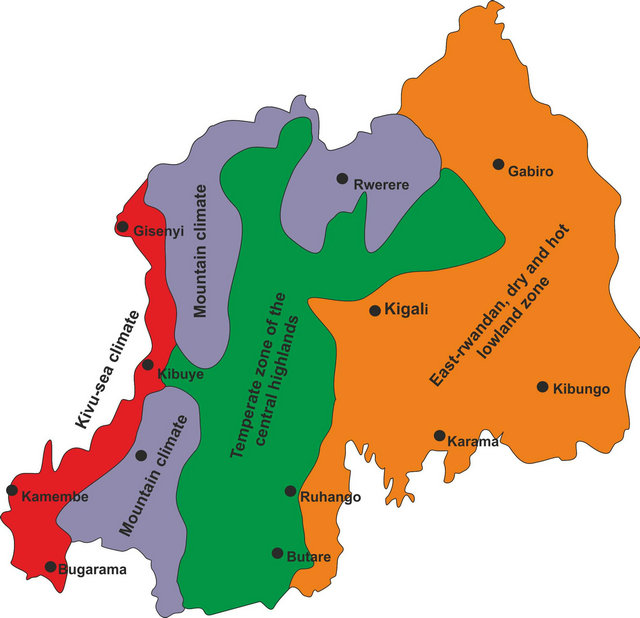
Figure 1. The climate zones of Rwanda, based on data from 1931-1960 [1].
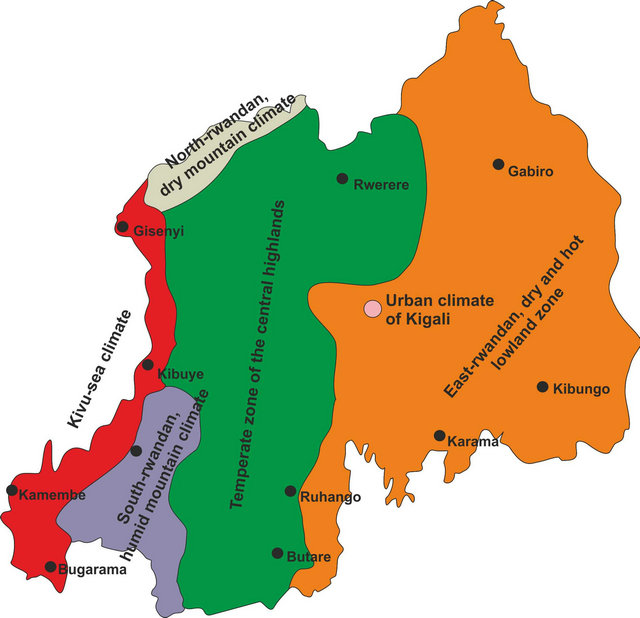
Figure 2. The new climatic classification of Rwanda, based on data from 1996-2011 [1].
with great effort [1].
Rwanda’s mountain climate had experienced the most far-reaching climatic changes, which used to be concentrated in the regions of the Virunga volcano chain in the north and the Nyungwe mountain rain forest in the south. This simple division can no longer be maintained in light of the current data. In fact the local climates of the two regions must be demarcated from each other (comp. Figures 1 and 2). While the area in southern Rwanda, especially around the Nyungwe rainforest, exhibits modest temperature changes (+0.5 K) and continues to register rainfall amount of >1400 mm, around the Virunga volcanos the temperature ranges about 2 K higher while total rainfall has clearly dropped (−250 mm). This calls for a new division of the Rwandan “Mountain climate” into the “South-Rwandan humid mountain climate” and the “North-Rwandan dry mountain climate” [1].
Nearly unchanged physically as a regional climate zone is the area along Lake Kivu (comp. Figures 1 and 2). The locale climate peculiarity arising from the prevailing land-lake-wind circulation continues to cause climatic conditions that remain roughly the same, with slightly rising temperatures (+0.5 K) and a decrease in rainfall of about 50 mm.
3.2. Local Malaria Modifications
Along with rising temperatures throughout the country the risk that the anopheles mosquito will spread as a function of temperature and rainfall grows as well. This may result in a higher risk for transmission of the infectious disease malaria [14]. Equally significant, a likely consequence is that the insect might be able to advance to higher elevations [2]. For a highland country like Rwanda, where many parts of the country fell below the epidemiological relevant line in the past, a rise in temperatures may now lead to the increased probability of malaria transmission. It was Loevinson who already pointed to this problem back in the early 1990’s [25]. Especially in areas, in which malaria hardly appeared, chances are that the trend will be especially pronounced, because the population’s immunity in this area is limited. However, it is not only the temperature that regulates which space the anopheles mosquito occupies, but also the presence of rain. Vectors like the anopheles mosquito spend part of their life cycle in water habitats. Hence, their range also strongly depends on hydrological changes. An expansion of the population is adapted to the change from rainy to dry seasons with the decisive criterion for the insect’s development being the intertwining of the wet phase’s duration with the intervening dry period. On the one hand, high humidity values stimulate the vector dynamic or the metabolic system of the anopheles mosquito. On the other hand, a lasting dry spell or low humidity clearly raises their bite frequency. Since an analysis of Rwanda‘s climate measurement series can demonstrate both an increase in dry phases but also noticeable more intense, heavy rains during recent decades, we could also expect more frequent outbreaks of waterand vector-borne diseases. In addition, wet paddy rice cultivation in many parts of the country no doubt is a factor not to be ignored in the anopheles mosquito’s spread [26]. This problem should not be discussed here.
Comparing Figures 3 and 4 provides an overview of the trend in malaria illnesses for the entire country. Figure 3 shows the geographic spread of malaria in Rwanda as well as the probability of becoming infected. For this depiction information from the individual district hospitals of the year 1990 were taken as the base, although the numbers were not complete, as for the years after 1990 (see Table 1 with the situation of the district hospitals).
What emerges from the vector-induced illnesses is that there were two areas in Rwanda being described as endemic where the probability to be infected was >70%: the tropical wet southwest border area with the Democratic Republic of Congo in the Bugarama Rift Country and the south-eastern area bordering Burundi on Lake Rweru (Figure 3). The latter was discarded as not significant due to the extremely low population density of the area. Furthermore, a uniform picture emerges of the almost malaria-free area between the Virunga volcano chain in the north, the western Central Highlands up to Lake Kivu and the Nyungwe rainforest in the south. The eastern Central Highlands between Butare and Gitarama and the area east of Kigali present a minimal risk of malaria (5% to 15%). Akagera’s risk is also at 15%. Solely, the capital Kigali exhibits a 30% higher reading (Figure 3). However, this is not necessarily due to local climatic changes in this area, but also especially owing to the fact that this area exhibits the highest population density in the country [27].
A changed picture presents itself evaluating data for the years 1990 to 2011 (Figure 4). It is no longer absolutely necessary to differentiate between more or less endangered malaria risk areas. At present, there is a clear bifurcation of the country. Ruanda’s high mountain regions along the Rift Valley and in the northern or southern mountain country are still largely free. Otherwise, it seems that an increase in the incidence rate to 70% must be expected for the entire remaining country. Interalia, malaria has spread strongly along Lake Kivu. It can be surmised that the anopheles mosquito was able to invade this area from the west or the east and found ideal conditions in a few locations. Designating potentially endemic areas might be a problem. Whereas Rwanda was nearly free of malaria twenty years ago or certainly not to be designated as an endemic area, aside from a few small border areas fulfilling the climatic and hydrologic prerequisites for formation of the anopheles mosquito, now there are three large areas which have a nearly 90% incidence rate: the areas around Burgarama have expanded in the direction of Lake Kivu; malaria infection risk, originating from Lake Rweru, has expanded west, north and south and already includes large areas in southwest Rwanda all the way to the Akagera (Figure 4). This evaluation and assessment of the current situation coincides very well with the findings by [18]. The use of the Liverpool Malaria Model for validating malaria’s spread potential on the African continent forecasts an extant
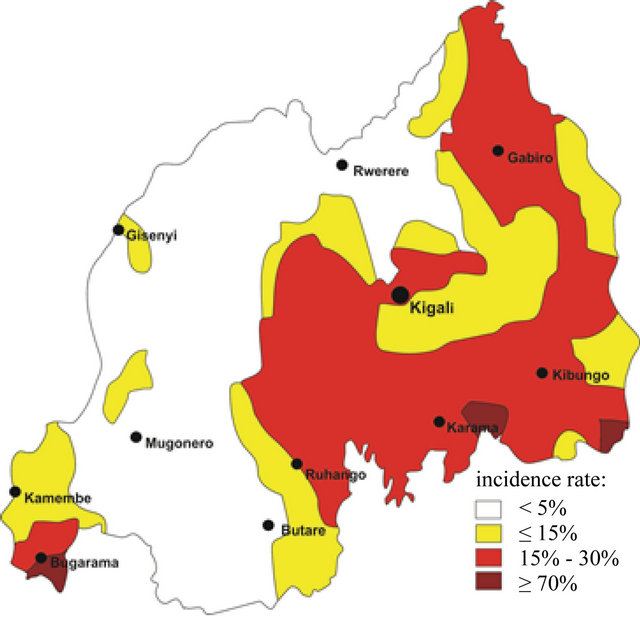
Figure 3. Spatial development and spread of malaria incidences within the territory of Rwanda for the time period till 1990 (based on data from the district hospitals of Table 1).
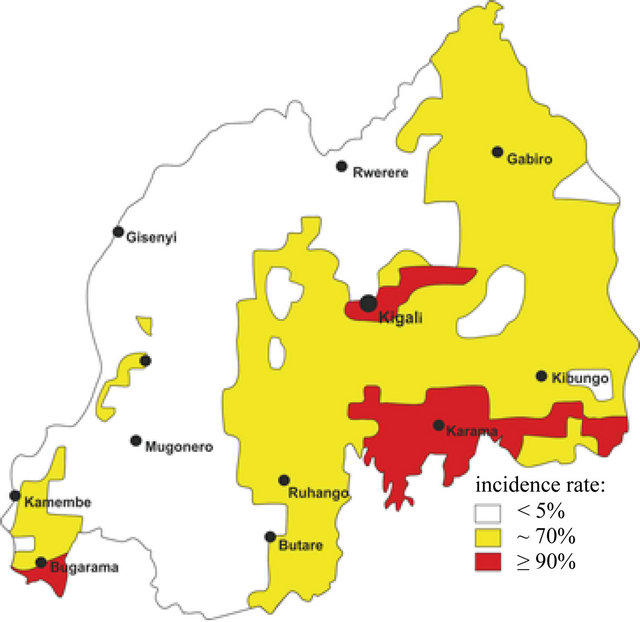
Figure 4. Spatial development and spread of malaria incidences within the territory of Rwanda for the time period till 1990 (based on data from the district hospitals of Table 1).
increase in the disease’s incidence rate with rising altitude especially for the highland expanses of Ethiopia and Rwanda. Certainly a cause for concern is what is happening in the Kigali metropolitan area, which now also has the status of an endemic area (Figure 4). What makes the potential here especially explosive is that around 1.5 million people live in this area. Comparing it to the studies by [28] and [29] respectively, this is astounding for a basic assumption about the course of Africa’s urbanization is that the likelihood of infections goes down in cities. Inter alia, this is attributed to infrastructure and medical care being better than in rural areas, but also to improved hygiene. This is not yet the case in Kigali, presumably because, on the one hand, the city is changing enormously, on the other hand, large parts of Kigali cannot be called urban, because its conditions are more like those prevailing in the countryside.
Except for the malaria-free high areas, the annual occurrence of malaria illnesses shows that, local anomalies excepted, the entire country is to be classified as a risk area for at least ten months of the year, if not all year round. This means that October and November mark the onset of the malaria season, then gradually diminishing or suspending entirely between May and July.
4. CONCLUDING REMARKS
At present it is still difficult to account for the modifications that climate change brings, particularly trying to explain for them on a regional or local scale. The question to what extent such climatic changes can be assigned responsibility for the spread of vector-caused infectious diseases cannot be answered solely by changes in the climate. Nonetheless, we have to assume—and this much at least we owe to climate change—that, for example, the geographical manifestation of areas at risk for malaria will shift. For some regions, this can be an advantage, but in all probability for others the transmission of the infectious disease will have a negative impact on the incidence rate. Particularly in sub-Saharan Africa, as pointed out in some publications, parallels can be seen between the length of rainy seasons and the changed rainfall amount and their effects on the length of the malaria transmission season (e.g. [5]). The example of Rwanda has shown that this development can also be observed there. With the increase and decrease of rainfall and intensification of dry phases in different regions important changes come in geographic transmission patterns [6].
Nevertheless, it bears repeating here that it is not only climate change that should be assigned responsibility for the situation in Rwanda of increasing incidence rates. Naturally, the modifications in temperature and rainfall have lasting effects on the vector dynamic, but a concluding assessment of the development of malaria in Rwanda must take additional factors into account. Above all, it calls for bringing the development of the country’s population structures into the analysis. In particular, the increasing population density, fostered by a high population growth rate and internal migration, changed and improved settlement structures as well as land use lead to a changed quality of life compared to 30 or 40 years ago. Certainly since the genocide ended, Rwanda has recorded a rapid increase in population and continual urbanization [22]. The primary effect of this was to have a reduced probability of getting malaria [28,29]. However, the country’s infrastructure, especially outside Kigali and even in the larger cities like Butare or Gitarama, can only be described as urban within limits. Most notably, sanitation measures resemble rural conditions. An additional partial modernization of agriculture and the related changes on the land (e.g. [30]) expressed above all in expansion of irrigated surfaces and in some region actually is salutary for the anopheles mosquito [26]. This of course accommodates vector development, because what happens, for example, on rice paddies in concert with local climate changes is exactly what the World Health Organization among others has been warning against for many decades: the creation of additional breeding grounds for the anopheles mosquito. Each of these cited determinants in its own way will affect the risk of transmission of the vector-induced disease of malaria and must therefore be regarded as interacting with all the others, especially with changes in the climate.
REFERENCES
- Henninger, S. (2013) Does the global warming modify the local Rwandan climate? Natural Science, 5, 124-129. doi:10.4236/ns.2013.51A019
- Kappas, M. (2009) Klimatologie. Klimaforschung im 21. Jahrhundert: Herausforderung für Naturund Sozialwissenschaften. Spektrum Akademischer Verlag, Heidelberg.
- Guerra, C., Gikandi, P., Tatem, A., Noor, A., Smith, D., Hay, S. and Snow, R. (2008) The limits and intensity of Plasmodium falciparum transmission: Implications for malaria control and elimination worldwide. PLoS Medicine, 5, 2. doi:10.1371/journal.pmed.0050038
- Hay, S., Guerra, C., Gething, P., Patil, A., Tatem, A., Noor, A., Kabaria, C., Manh, B., Elyazar, I., Brooker, S., Smith, D., Moyeed, R. and Snow, R. (2009) A world malaria map: Plasmodium falciparum endemicity in 2007. PLoS Medicine, 6, 39. doi:10.1371/journal.pmed.1000048
- Sinka, M., Bangs, M., Manguin, S., Coetzee, M., Mbogo, C., Hemingway, J., Patil, A., Temperley, W., Gething, P., Kabaria, C., Okara, R., Boeckel, T., Godfray, H., Harbach, R. and Hay, S. (2010) The dominant Anopheles vectors of human malaria in Africa, Europe and the Middle East: Occurrence data, distribution maps and bionomic précis. Parasites & Vectors, 3, 117. doi:10.1186/1756-3305-3-117
- Sherman, I. (1998) Malaria: Parasite biology, pathogenesis, and protection. ASM Press, Washington DC.
- DFID (2004) Department for international developmentclimate change in Africa, East Anglia. DFID, Norwich, 1-8.
- Hay, S., Guerra, C., Tatem, A., Noor, A. and Snow, R. (2004) The global distribution and population at risk of malaria: Past, present and future. Lancet Infection Diseases, 4.
- Tatem, A., Hay, S. and Rogers, D. (2006) Global traffic and disease vector dispersal. PNAS, 103, 16. doi:10.1073/pnas.0508391103
- Yohannes, M. and Petros, B. (1996) Urban malaria in Nazareth, Ethiopia: Parasitological studies. Ethiopian Medical Journal, 34, 2.
- Omumbo, J., Guerra, C., Hay, S. and Snow, R. (2005) The influence of urbanisation on measures of Plasmodium falciparum infection prevalence in East Africa. Acta Tropica, 93, 5. doi:10.1016/j.actatropica.2004.08.010
- Drakeley, C., Schellenberg, D., Kihonda, J., Sousa, C., Arez, A., Lopes, D., Lines, J., Mshinda, H., Lengeler, C., Armstrong, Schellenberg, J., Tanner, M. and Alonso, P. (2003) An estimation of the entomological inoculation rate for Ifakara: A semi-urban area in a region of intense malaria transmission in Tanzania. Tropical Medicine & International Health, 8.
- Coene, J. (1993) Malaria in urban and rural Kinshasa: The entomological input. Medical and Veterinary Entomology, 7, 127-137. doi:10.1111/j.1365-2915.1993.tb00665.x
- Harvell, C.D., Mitchell, C.E., Ward, J.R., Altizer, S., Dobson, A.P., Ostfeld, R.S. and Samuel, M.D. (2002) Climate warming and disease risks for terrestrial and marine biota. Science, 296, 2158-2162.
- Henninger, S. (2011) Lokalklimatische Veränderungen und die Ausbreitung von Malaria in Ruanda. Zentralblatt für Geologie und Paläontologie, 1, 77-96.
- Nchinda, T.C. (1998) Malaria: A reemerging disease in Africa, 4, 398-403.
- Lozán, J.E. (2008) Warnsignal klima. Gesundheitsrisiken, gefahren für pflanzen, tiere und menschen. Wissenschaftliche Auswertungen, Hamburg.
- Ermert, V., Fink, A., Jones, A. and Morse, A. (2011) Development of a new version of the Liverpool Malaria Model. I. Refining the parameter settings and mathematical formulation of basic processes based on a literature review. Malaria Journal, 10, 35. doi:10.1186/1475-2875-10-35
- Schönwiese, C.D. (2006) Praktische statistik für meteorologen und geowissenschaftler. Gebrüder Bornträger, Berlin Stuttgart.
- Stoyan, D. and Jansen, U. (1997) Umweltstatistik: Statistische verarbeitung und analyse von umweltdaten. Teubner Verlag, Leipzig.
- Siebertz, K., van Bebber, D. and Hochkirchen, T. (2010) Statistische versuchsplanung. Springer Verlag, Berlin. doi:10.1007/978-3-642-05493-8
- Henninger, S. (2009) Urban climate and air pollution in Kigali, Rwanda. ICUC’07, Yokohama, 29 June-3 July 2009, 1038-1041.
- Henninger, S. (2009) Urbane luftverschmutzung am beispiel einer afrikanischen Großstadt. Umweltchemie und Ökotoxikologie, 3, 58-60.
- Henninger, S. (2010) Modifikationen des lufthygienischen Wirkungskomplexes in der ruandischen Hauptstadt Kigali. Berichte des Meteorologischen Instituts der Albert-Ludwigs-Universität Freiburg, 20, 422-427.
- Loevinsohn, M.E. (1994) Climatic warming and increased malaria incidence in Rwanda. The Lancet, 343, 714-718.
- Teklehaimanot, A. and Pushpa, R.J. (1999) The mosquito: Public enemy No. 1. World Health Organization, Geneva. doi:10.1016/S0140-6736(94)91586-5
- Adimola, B., Gahima, C., Kivuva, M. and Mmbando, J.S. (2006) Atlas for East Africa. Pearson Longman Press, Essex.
- Hay, S., Guerra, C., Tatem, A., Atkinson, P. and Snow, R. (2005) Urbanization, malaria transmission and disease burden in Africa. Nature Reviews: Microbiology, 3.
- Davis, J., Clark, T., Kemble, S., Talemwa, N., NjamaMeya, D., Staedke, S. and Dorsey, G. (2006) Longitudinal study of urban malaria in a cohort of Ugandan children: Description of study site, census und recruitment. Malaria Journal, 5, 18. doi:10.1186/1475-2875-5-18
- Guerra, C., Snow, R. and Hay, S. (2006) A global assessment of closed forests, deforestration and malaria risk. Annals of Tropical Medicine & Parasitology, 100, 3. doi:10.1179/136485906X91512