Engineering
Vol.08 No.07(2016), Article ID:69335,10 pages
10.4236/eng.2016.87046
Analysis of Stress Strain State of X-60 Pipe Weld Joints Employing Magnetic-Anisotropy Indicator of Mechanical Stress
Hamid Suliman Hamid Elhag1, Nikulin Vasili2, Isaac Einav3, Yagoub Kamal Eldin4
1Petroleum Training Center, Khartoum, Sudan
2Ferrologica Company, St. Petrsburg, Russia
3Starik Company, Toronto, Canada
4Sudanese Atomic Energy Commission, Khartoum, Sudan

Copyright © 2016 by authors and Scientific Research Publishing Inc.
This work is licensed under the Creative Commons Attribution International License (CC BY).
http://creativecommons.org/licenses/by/4.0/


Received 24 April 2016; accepted 26 July 2016; published 29 July 2016
ABSTRACT
This research presents an experimental study of analysis of stress strain state SSS of X-60 pipe weld joints employing magnetic anisotropy indicator of mechanical stresses Stress Vision (IMS) using of “before and after” comparison approach taking readings on pipe base metal, weld area and heat affected zone (HAZ) before and after hydrotest. Test results were compared with X-ray testing results for welded joints and with metallographic testing. Test results demonstrate the relevance of applied test conditions and redistribution of residual stresses. A new equation was established for estimating the residual (technological) and operating stresses in other pipelines with a tolerance of 15% in the field of elastic deformation (up to the yield point), according to Hooke law.
Keywords:
Stress Strain State (SSS), Residual Stresses, Stress Concentration, Indicator of Mechanical Stress

1. Introduction
It’s generally recognized that the main reason of objects failure is internal residual mechanical stresses, developed in parts of structures, these stresses may reach the yield strength [1] . The occurrence of these stresses is always associated with linear or volume strains.
The Joule effect, the first of the magnetomechanical effects to be thoroughly documented (in 1842), is a longitudinal change in length due to an applied magnetic field. A transverse change in length and associated volumetric change are also observed. Although the Joule effect is usually associated with the actuation capability, numerous sensor configurations rely on the excitation of the magnetostrictor to facilitate sensing. The Joule effect has an important reciprocal effect known as the Villari effect; a stress induced in the material causes a change in the magnetization. This change in magnetization can be sensed, and once calibrated, used to measure the applied stress or force. The Villari effect has been the subject of much research (Lee, 1955; du Tremolet de Lacheisserie, 1993; Jiles, 1995) [2] .
In this research, the stress strain state and residual stresses redistribution of welded pipe were studied, in both butt-welded and longitudinally welded joints, utilizing new measurement technique based on material magnetic anisotropy. Test results were compared with X-ray testing results for welded joints and with metallographic testing. Test results showed compliance of all applied tests results, redistribution of residual stresses and new equation was established for estimating the residual (technological) and operating stresses in other pipelines.
2. Experiment Arrangement
The experiment were performed using carbon steel pipes, longitudinally welded with electric resistance welding (ERW) grade API 5L X-60 [3] which are frequently employed in oil industry, with dimensions 8 inches outside diameter, 6.4 mm thickness and 6 meters length. The three pipes were cut to 9 spools with a length of 2 meters each, and then the pipe spools were butt-welded using shielded metal arc welding technique (SMAW) with a qualified welding procedure to join each two meters pipe spools together. The joints were designated as joint no 1, 2, 3, 4, 5 and 6.
After welding the joints were inspected with the x-ray to ensure their soundness and freedom of rejected defects, the X-ray evaluation was conducted according to API 1104 code―Welding of Pipelines and related facilities [4] .
3. Experiment Methodology
Pipes were hydrostatically tested to 90, 180 and 240 bar pressure in a factory test machine, which is equivalent to 37.5%, 75 % and 100% of Pipe Specified minimum yield strength.
Stresses were measured at each different pressure in the base metal, HAZ and weld metal, employing IMS Stress Vision as shown in Figure 1 and Figure 2, 490 data points were gathered for each joint (1, 2, 3, 4, 5 & 6) at the three different pressure conditions. The weld metal is located at position Y7 through Y8 vertical lines of the stress plot. A grid with 20 mm spacing (or half probe width to ensure complete data overlap) was drawn on the pipe to cover the areas of interest on the pipe circumference.
Stresses at joints 1 & 2 were measured without hydrostatic test, and then after hydro-testing up to 180 bar (standard test pressure to 75% of specified minimum yield strength as outlined in API 5L standard).
Stresses at joints 3 & 4 were measured without hydrostatic test.

Figure 1. Pipe under pressure on test machine.
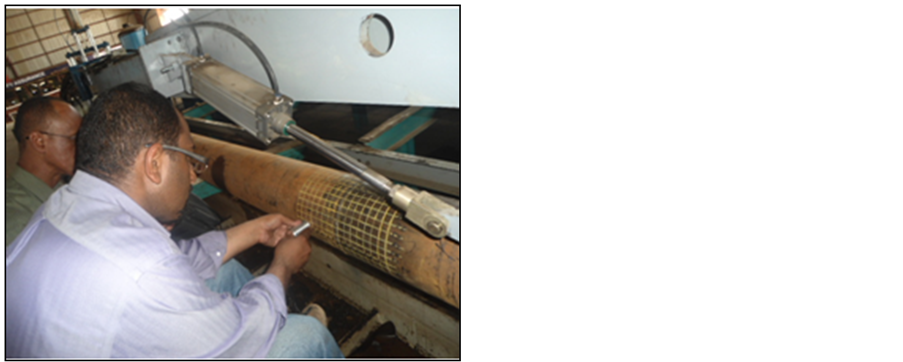
Figure 2. Taking reading using IMS while pipe under pressure.
Stresses at joints 5 & 6 were measured without hydrostatic test and then, after hydro-testing to 90,180 bar and 240 bar (which is 100% specified yield strength).
Using “before and after” comparison approach, the stresses maps developed by the device were analyzed in conjunction with:
1) The radiographic results of the joints.
2) The microscopic metallography examination of all joint samples (base metal, HAZ and weld metal).
Testing was conducted according to ASTM E 112 [5] and Giad factory procedure [6] .
4. IMS Stress Vision Equipment Description
Indicator of Mechanical Stresses (Figure 3) was designed for measurement, visualization and evaluation of mechanical stress fields in various ferritic steel structures.
Can achieve complex stress measurement tasks like:
1) Layer-by-layer presentation of mechanical stresses.
2) Determine the gradient of stress level. Is it stable or critical?
3) Prediction of dangerous and emerging mechanical stress concentrations.
Device measures electromotive forces utilizing magneto-anisotropy technique.
Operation of device is based upon measurement of Electro Motive Force (EMF) induced in measuring coils by magnetic field that is generated by transducer’s excitation coils in a zone of the object being tested.
Working part of transducer intended for probing in each direction is formed of two mutually perpendicular U- shaped magnetic circuits; upon one of the latter there is excitation coil, upon the other-measuring coils.
In materials with isotropic magnetic properties EMF induced at measuring coils is mutually compensated and output signal equals zero. If there is anisotropy of magnetic properties unbalance of EMF occurs, and it results in appearance of output signal which value depends on the value and orientation of main mechanical stresses in zone of transducer’s installation upon the surface of metal being tested [7] .
Block Diagram of the method is presented in Figure 4.
5. Test Results.
5.1. MAS Results
The magnetic method measurements were performed over an area of 280 mm, covering the pipe circumference, at 490 points of a rectangular mesh with a uniform step of 20 mm. The area was centered above the pipe butt weld line.
First, it should be noted that the mapping was performed over an area composed of materials with different mechanical and magnetic properties (the weld metal, the base metal and the heat affected zone). Thus, the measurements are relative for each part of the mapped area. Second, we used these measurements to form maps of the maximum shear stress concentration and, moreover, for an independent comparison.

Figure 3. Indicator of mechanical stress “Stressvision-2”.
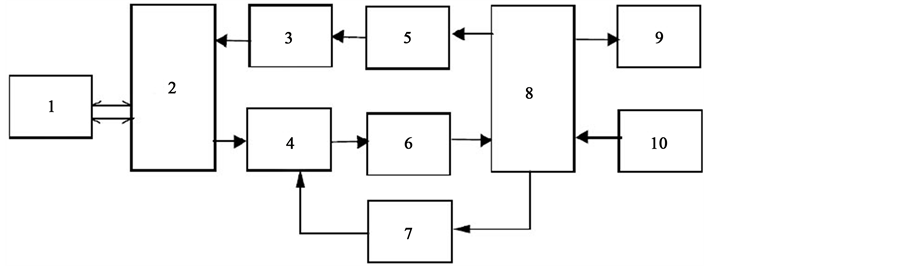
Figure 4. Structural diagram of magnetic anisotropic device “Stressvision-2”. 1―Transducer, 2―Regulator, 3―Power amplifier, 4―Output amplifier, 5―DAC, 6―ADC, 7―DAC, 8―Controller, 9―Display, 10―Keyboard.
The stress measurements were performed while the pipe was under pressure (for the pipes tested during hydrostatic pressure).
For six joints following stress maps were developed by the device (Figures 5-9).
After performing measurements, results were transferred to laptop with program software for results processing and getting maps of Difference Principal Mechanical Stresses (DPMS) and Concentration Coefficient of Mechanical Stresses (CCMS), statistics of all performed measurements at each control zone.
Statistical Results processing:
All results of the mean value in conventional units throughout the measurement zone are transferred to one table with counter sign for graph construction:
Relation between test pressure (bar) and Difference of principal mechanical stresses DPMS (conventional units)

Calculated linear equation  (Figure 10). This equation describes the proportionality of Hooke’s law in the field of elastic deformation and exclusively in the field of 14 × 35 (Annular weld) in these pipelines.
This equation was preliminary and exploratory in nature, so as for the purity of the experiment need to calculate the equation based on the results of defect-free device tube.
Pressure 0 bar Pressure 90 bar Pressure 180 bar
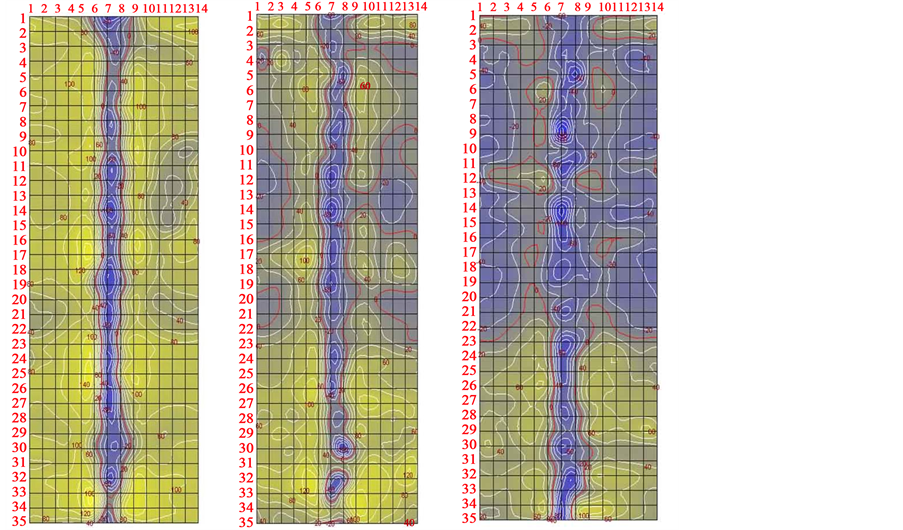 63.58 28.55 −3.09
Figure 5. Cartograms of Differences Main (or Principle) Mechanical Stresses (DPMS). Welding joint №1. The mean value in conventional units throughout the measurement zone (14 × 35).
Pressure 0 bar Pressure 90 bar Pressure 180 bar
 58.73 31.37 −4.17
Figure 6. Cartograms of Differences Main (or Principle) Mechanical Stresses (DPMS). Welding joint №2. The mean value in conventional units throughout the measurement zone (14 × 35).
Welding joint №3 (Pressure 0 bar) Welding joint №4 (Pressure 0 bar)
 51.16 65.43
Figure 7. Cartograms of Differences Main (or Principle) Mechanical Stresses (DPMS). The mean value in conventional units throughout the measurement zone (14 × 35).
Pressure 0 bar Pressure 90 bar Pressure 180 bar Pressure 240 bar
 57.11 44.91 3.52 −32.28
Figure 8. Cartograms of Differences Main (or Principle) Mechanical Stresses (DPMS). Welding joint №5. The mean value in conventional units throughout the measurement zone (14 × 35).
Pressure 0 bar Pressure 90 bar Pressure 180 bar Pressure 240 bar
 64.81 54.94 −7.85 −33.32
Figure 9. Cartograms of Differences Main (or Principle) Mechanical Stresses (DPMS) Welding joint №6. The mean value in conventional units throughout the measurement zone (14 × 35).

Figure 10. Relation between test pressure and DPMS.
5.2. Metallographic Test Results
Fifteen specimens (10 mm × 19 mm) were removed transverse to the welding direction covering the weld area, HAZ in addition to 7 specimens removed from base metal out of weld area and HAZ, to produce specimens for microstructure examination. The weld metal microstructure was revealed using 5% Nital acids. The microstructure was evaluated using standard optical microscope according to ASTM procedure.
The base metal microstructures of the analyzed samples were typical structure of a carbon steel comprised of ferrite light areas and pearlite dark areas with grain size of ASTM. Examples of this type of microstructure are presented in Figure 11 and Figure 12. The images are presented at 100× magnification.
The microstructure analysis showed the absence of microcracks in weld area, HAZ and base metal.

Figure 11. Microstructure of HAZ for joints 1 pipe A.

Figure 12. Microstructure of HAZ for joint 6.
Extension of grains in the HAZ was reported for Pipe C, Joints no 5 & 6, which may be attributed to permanent deformation. See grain photos of pipe c (joints 5 & 6) in Figure 12.
6. Conclusions
In conclusion, the following should be noted:
Compressive and tensile stresses exist in most metal structures and can be readily detected with Stress Vision IMS in piping welds. The concentration and gradient of these stresses can be indicators of poor weld construction. Stress Vision IMS is capable of discerning the gradient of these forces.
Our research has clearly demonstrated that the stress gradient (DPMS) between these forces decreases significantly under the influence of increased hydraulic loads by changing sign in welds number 5 and number 6 which can be attributed to the redistribution of compressive stresses to a tensile stress condition that will lead to ultimate structural failure. At the higher pressures, it is obvious that the weld is entering into the metallic plastic deformation zone, where the weld is trying to pull itself apart.
The control pipe joints in this study have large number and variety of welding defects. The detected defects have a strong influence on the stress state of each other and the integrity of the pipe. In this regard, one can identify the presence of defects from the stress gradient and the stress concentrators in the weld and heat affected zone (HAZ).
Defects that are classified as permissible, according to the radiography report and the utilized code acceptance criteria include:
1) Joint 1 incomplete root penetration at locations 10 and 56 (Figure 13);
2) Joint 2 incomplete root penetration at locations 2 and 55(Figure 14);
3) Joint3 incomplete root penetration at locations 6 and 27 (Figure 15);
4) Joint 4 incomplete root penetration at location 64 (Figure 16);
5) Joint 6 incomplete root penetration at locations 8, 10, and 67 (Figure 17).


Figure 13. RT films of Joint 1 showing internal concavity at locations 10 & 56.


Figure 14. RT films of Joint 2 showing internal concavity at locations 2 & 55.


Figure 15. RT films of Joint 3 showing internal concavity at locations 6 & 27.

Figure 16. RT films of Joint 4 showing internal concavity at locations 64.

Figure 17. RT films of Joint 6 showing internal concavity at locations 8 & 10.
These stress concentrators may lead to the destruction of the structure when subjected to loads exceeding 75% SMYS (specified minimum yield strength). Attached photos of x-ray films for the welded joints 1, 2, 3, 4, 5, and 6 (Figures 13-17).
It is interesting to note that other NDT methods such as ultrasonic inspection (API 1104 UT, ASME B31), may result in these defects being rejectable. And radiography, as an NDT technique is insensitive to planar defects, such as lack of side wall fusion (LOF) in the weld. This particular defect will create an ID/OD stress riser that could result in a through wall failure under the appropriate stress conditions. This condition could be easily detected by phased array ultrasonic inspection or time of flight diffraction UT (TOFD). It is recommended that all suspect stress conditions be evaluated with other NDT techniques.
As a result of this research, we were able to establish a new equation for determining residual (technological) and operating stresses:

This could be used to estimate with similar material in other pipelines (with a tolerance of 15%) the elastic deformation (up to the yield point), according to Hooke’s law. It should be noted, to reduce errors it would be necessary to recalculate the equation based of the results of defect-free pipe.
It should also be noted that all calculations were based on the processing of results through Stress Vision IMS in the “second layer” 0 - 6 mm slicing. Surface effects could easily be established through analysis of saved data. The same could be said for volumetric evaluation of stresses.
Extension of steel grains in joints 5 & 6 which were subjected to 100% SMYS (specified minimum yield strength) pressure test was definitive evidence for permanent deformation of the weld structure. This study could be extended to further research like impact of weld’s defects under pressure pipeline construction and operating pressures.
Magnetostrictive sensor technology continues to mature and will provide important capabilities towards pipelines and ferromagnetic structures life extension, in the years ahead.
Acknowledgements
Special thanks to Professor Engineer Jan Suchanek CSc―Czech Technical university supervisor of this research.
This work was supported by Ferrologica Company, Russia St. Petrsburg and GIAD pipes factory-Sudan, Sudan Atomic Energy Commission.
And assisted by Petroleum Training Center, Khartoum, Sudan. GM and QA & QC Department team of GIAD Pipes factory Engineers: Hasan Mohamed Ibrahim, Muawia Ahmed, Mohamed Elhadi, Abdelhafeez Abdalla, Hydrotest machine technician Ali Ahmed, QA/QC team members and Pipe Welder Amar Alhag from SPPC.
Cite this paper
Hamid Suliman Hamid Elhag,Nikulin Vasili,Isaac Einav,Yagoub Kamal Eldin, (2016) Analysis of Stress Strain State of X-60 Pipe Weld Joints Employing Magnetic-Anisotropy Indicator of Mechanical Stress. Engineering,08,499-508. doi: 10.4236/eng.2016.87046
References
- 1. Zhukov, S.V. and Zhukov V.S. (2008) Technical Description of Indicator of Mechanical Stresses. Ferrologica LLC, Russia.
- 2. Calkins F.T., Flatau, A.B. and Dapino, M.J. (2007) Overview of Magnetostrictive Sensor Technology. Journal of Intelligent Material Systems and Structures, 18, 1057-1066.
http://dx.doi.org/10.1177/1045389X06072358 - 3. API Specification 5L: Specification for Line Pipe.45th Edition, December 2012.
- 4. API 1104 Welding of Pipeline and Related Facilities, 1998.
- 5. ASTM E 112-96.
- 6. Sop for Metallographic Test Procedure Issue Date 3/3/2014 pp1-3.
- 7. Indicator of Mechanical Stresses “Stressvision”—Version Basic, Advance Technical Description, Operation Manual, Certificate 2010.