Engineering
Vol.07 No.10(2015), Article ID:60842,16 pages
10.4236/eng.2015.710063
Analysis of Temperature Profiles and Cycle Time in a Large-Scale Medical Waste Incinerator
Veilla E. Matee, Samwel V. Manyele
Department of Chemical and Mining Engineering, University of Dar es Salaam, Dar es Salaam, Tanzania
Email: veilla.elisante@mnh.or.tz, smanyele@udsm.ac.tz
Copyright © 2015 by authors and Scientific Research Publishing Inc.
This work is licensed under the Creative Commons Attribution International License (CC BY).
http://creativecommons.org/licenses/by/4.0/


Received 29 May 2015; accepted 27 October 2015; published 30 October 2015
ABSTRACT
Temperature profiles and cycle times in a large-scale medical waste incinerator installed in a referral hospital were used to assess the performance and functionality of incinerator. The study was conducted using data collected from 8 cycles per days for 67 days. For proper combustion and destruction of toxic components in the primary chamber and destruction of pollutants and toxic components in the flue gas, it is desired to reach the maximum temperature in the chambers faster and maintain this maximum temperature for an extended time interval. The primary and secondary temperatures T1 and T2, respectively, were recorded at an interval of one minute for different cycles. Different amounts of wastes with varying proportions of sharps and other wastes were loaded into the incinerator and temperature profiles recorded. The analysis shows that the incinerator works at primary temperature less than the required recommended by manufacturer while the secondary chamber operates between 600 and above 950˚C, although higher temperatures up to 1020˚C were observed. The average load preparation time was observed to be 14.6 minutes, while the chamber preheating time before daily initial loading was 25.45 minutes. Both temperature profiles were observed to have similar shapes for all combustion cycles studied, except when incinerator malfunctioning occurred. The average cycle time was established to be 32.7 minutes and 28.97 minutes based on time to drop to 550˚C after the maximum temperature and loading time intervals, respectively, although longer cycle times were observed. Temperature drop in both combustion chambers as a result of waste charging was observed in the interval of 5 minutes. The chamber heating rate was observed to decrease exponentially with time during both preheating and incineration operation.
Keywords:
Medical Waste Management, Infectious Waste, Pathological Waste, Sharps Waste, Incineration, Temperature Profile, Cycle Time, Heating Rate

1. Introduction
Incineration is an important technology for the treatment and decontamination of medical waste, involving high-temperature (800˚C to 950˚C) dry oxidation process that reduces organic and combustible waste to inorganic, incombustible matter with a significant reduction of waste volume and weight. The study investigated the performance of the large scale medical waste incinerator based on temperature profiles and cycle time [1] [2] . The area of study was MNH which admits 350,000 patients per month and generates and incinerates on average 900 kg of infectious waste daily. Medical waste collected and measured was categorised into sharps waste and other wastes. Sharp waste contained needles, syringes, blades, sutures or other sharp instruments while other wastes contained pathological waste (human tissues, organs and body fluids), infectious waste (containing pathogenic organisms), pharmaceutical waste (drugs, vaccines expired or spoiled), genotoxic (radioactive films and fluids), and pressurized containers [3] .
Monitoring of temperature is essential for understanding the performance of incinerator in terms of destruction efficiency, emissions control [4] and identification of process malfunctions. This is because, based on temperature profiles, it is possible to establish average cycle time for waste incineration, maximum temperatures reached during each cycle, chamber heating and cooling rate, proportion of sharps waste required to attain highest temperatures, etc.
2. Literature Review
Medical waste is defined as any waste which consists wholly or partly of human or animal tissue, blood or other body fluids, syringes, needles, suture or other sharp instruments; which unless rendered safe may prove hazardous to any person coming into contact with it, excretions, drugs or other pharmaceutical products, swabs or dressings and any other waste arising from medical, nursing, dental, veterinary, pharmaceutical or similar practice, investigation, treatment, care, teaching or research, or the collection of blood for transfusion, being waste which may cause infection to any person coming into contact with it.
Medical waste management system is a procedure of managing waste from a point of generation, segregation, transportation, storage and treatment and final disposal. Being a referral hospital, MNH handles tons of infectious medical waste per year. The medical waste management process such as handling, segregation, mutilation, disinfection, storage, transportation and final disposal are vital steps for safe and scientific management of medical waste [3] [5] .
The WHO suggests that hospitals should provide plastic bags and strong plastic containers for infectious waste. The mixtures of infectious medical waste and sharps waste are treated at MNH. Safe disposal of healthcare waste improves working conditions, reduces pollution, reduces accidental injuries, increases public safety and reduces the chance of transmission of infectious disease [6] [7] .
Studies in other countries indicate that the generation of medical waste requiring incineration is critical [3] [7] [8] . Medical waste generation in Tanzanian hospitals has been measured and identified to be high. For example, the rate of medical waste generation was about 2250 kg/day in Amana and 2500 kg/day in Ligula hospital. The waste generation rate per patient per day is also high about 1.8 (Amana) and 2.0 (Ligula) kg/patient/day, as reported by [3] . The daily medical waste generation rate has been observed to fluctuate randomly. According to the study conducted at the MNH, on average hospital generates 948 kg/day which is equivalent to 0.5 kg/patient. day or 0.947 kg/bed/day. Other study conducted Dar es Salaam city showed that the hospital with better medical facilities (Aga Khan)was observed to have higher waste generation rates of up to 1.3 kg/patient/day, than other hospitals like Temeke hospital (0.15 kg/patient/day), Hindu Mandal (0.37 kg/patient/day), Amana (0.26 kg/ patient per day) [9] .
The rate of generation of medical waste is proportional to number of beds and also number of patients. At MNH, the rate could be lower than 0.947 kg/bed/day due to the fact that MNH wards can admit more than 1200 patients/day. However, to compare different hospitals it is advised to use actual measurements of waste generated disregarding the number of beds and patients [3] . The generation rates reported consider only infectious waste despite the fact that hospitals generate both infectious and non-infectious wastes.
Another way of expressing the medical waste generation in the hospital is the sectional overview, that is, waste generation per section of the hospital. In most hospitals, the dominant trend (in descending order) is large amounts of waste in the surgical, gynaecology, orthopaedic and medical sections which produce smallest amounts [10] . Such an overview will assist hospital management to direct their waste management resources in the critical areas.
A large scale double chamber incinerator (with air pollution control devices, temperature control, flame ignition transformer and burners) is used at MNH. The lifting equipment has a capacity of 120 kg with maximum load bin of 75 kg. On incineration machine, during primary combustion process, some of the products of combustion are given off as combustible gases such as carbon monoxide. When these combustible gases reach the secondary combustion chamber they meet a further supply of air from the air blower and secondary burner, and undergo secondary combustion in the secondary combustion chamber, raising the temperature even higher, and reducing the gases to stable compounds such as carbon dioxide.
The combustion of healthcare waste under controlled conditions uses equipment that operates at temperatures on the order of 900˚C - 1000˚C, and that includes air pollution control equipment as well as other components to manage the emissions from the unit to prevent disease transmission [11] . These units generally include a second chamber (known as double chamber incinerator) which essentially provides the necessary conditions (temperature, time, and turbulence) to achieve complete combustion and to keep the concentration of undesirable compounds to a minimum [12] . The auxiliary fuel for these types of incinerators is diesel whereby, the incinerator is operated in a batch mode [2] . The study involved establishment of temperature profiles during different combustion batches.
A properly designed incinerator uses minimal fuel with shorter incineration cycle time. The temperature control system is required when the temperature increases beyond the set value, the fuel supply stops and waste can be burnt using material inside primary chamber. In case the temperature drops below set value, the fuel solenoid valves will be activated switching burners and rising the temperature again. Thus, temperature measurement provides a useful control variable for the incineration process.
3. Methodology
3.1. Design Features of the Assessed Incinerator
Standard fire bricks of approximately 230 mm × 115 mm × 75 mm and capable of withstanding temperatures of at least 1300˚C have been used to construct the refractive walls of the primary and secondary chambers [13] [14] . The MNH incinerator consists of primary chamber and secondary chamber each designed to operate using oil burners and an opening on top, for waste feeding and a chimney for smoke outlet, respectively. The automatic feeding bin is incorporated within the machine. The secondary burner is connected to the chimney as shown in Figure 1. The incinerator is used to destroy all clinical waste, pharmaceutical waste, radiology waste and pathological waste.
The waste is loaded on primary chamber and final combustion of gases takes place at secondary chamber. Also if a temperature of secondary chamber goes higher than the set value 850˚C the operator has to switch on the small water pump which produces spray of water to cool down the flue gases. Both chambers are incorporated with temperature controller which displays the combustion temperatures on each cycle. The maximum temperature was about 900˚C in secondary chamber and about 850˚C in the primary chamber. The incinerator was operated to burn about 70 kg of medical waste per cycle.
3.2. Large-Scale Incinerator Temperature Set Points
The temperature set points of MNH incinerator are shown in Table 1. There are three temperature controller namely primary temperature controller, secondary temperature controller, and flue gas temperature controller. Their set temperature values are 650˚C, 850˚C and 250˚C respectively.
In order to attain perfect incineration, the following conditions must be fulfilled: temperature must be high enough, turbulence in combustion gas mixture should be high and held at this condition for long time (3Ts) [2] . Time is an important aspect for incineration because it will have a great impact on incineration efficiency and fuel consumption. The two temperatures were recorded simultaneously against incineration time at intervals of 0.5 minutes (initially) and 1 minute (later). Table 2 shows the sample data recorded, for the preheating periods. This paper uses statistical analysis to identify the variables which affect the performance of incinerator.
3.3. Quantities of Medical Waste Loaded
Table 3 shows the sample data on waste loading rate for sharps and other waste, for which the compositions X and Y (kg other waste/total waste and kg sharps waste/total waste) were determined. The data shows also the maximum temperatures recorded for each of the cycles carried out in one day.
Cycles where the load preparation time (LPT) was not recorded refer to cases where the machine triggered error and the cycles had to restart. The time between waste loading (∆tL) is the true cycle time for the incinerator,

Table 1. MNH Incinerator temperature set value.
Table 2. Sample data collection datasheet for temperature profiles.
Table 3. Summary of incinerator operation data for 8 consecutive cycles conducted in one day.
values of which will be compared to those from temperature profiles. The time before 21.5 minutes is the chamber preheating time, during which there is no waste load in the primary chamber. This time interval was used to study the burner heating capacity and to establish the average preheating time.
3.4. Sample Size
In this study, the data on temperature profiles was collected for about 67 cycles including maximum temperatures, weight of sharps waste and other waste incinerated. The primary and secondary temperatures, T1 and T2 respectively, were recorded simultaneously at an interval of one minute for up to 67 cycles. Different amount of wastes with varying proportions of sharps and other wastes were loaded into incinerator and recorded. At the end of incineration the weight of the ashes collected was determined. Also, the cycle time was established from each incineration cycle.
4. Results and Discussion
4.1. Description of Temperature Profiles
The incineration process starts with preheating of both chambers, during which the temperature increases from either room temperature (starting with a cold chamber) or some higher value depending on the initial temperature of the chamber. In Figure 1, the primary chamber started at around 222˚C while the secondary chamber started at 764˚C. This is followed by loading of the waste into the chamber, which raises the primary chamber temperature further reaching the maximum value of about 800˚C. On the other hand, the secondary chamber temperature will also increase to reach the set value, after which the burner will be switched off automatically, and on again when the temperature has dropped. This is shown by fluctuating temperature values around the set point of 900˚C. Depending on the nature of the waste loaded (quantity and composition) the cycles will differ in duration (cycle time discussed later) and also in the peak or maximum temperatures reached (based on T1 curves). In one day, about 8 cycles are conducted treating about 950 kg. Always, T2 is higher than T1 unless there is a fault in burner operation system.
4.2. Poor Performance Incineration Profiles
The temperature profiles illustrated on Figure 2 reveals that there was poor incinerator performance because of malfunction of secondary burner. Problems were evident starting with the 80th minute, whereby, the secondary temperature dropped to 478˚C and increased to 877˚C while the cycle was not yet complete. The changes in secondary chamber temperature continued irrespective of the incineration cycles for the rest of the day indicating malfunctions of incinerator. After the 3rd cycle, the incineration cycles were conducted at lower temperatures in both chambers, which can lead to air pollution. The poor performance was attributed to tripping of the power control system.

Figure 1. Sample daily incineration temperature profiles.

Figure 2. Poor temperature profiles for selected day.
The faster rise in temperature in the secondary chamber after starting the primary burner can be attributed to the content of plastics in the safety boxes, infusion set, pharmaceutical bottles loaded in the primary chamber which pyrolyze faster and flow to secondary chamber for final combustion. In a properly functioning incinerator, when the primary burner creates heat in the chamber, the gases increases the chamber temperature and combustion takes place. As the hot gases leave primary chamber, the combustion in the secondary chamber is highly improved thus leading to higher temperature. Thus for the case of MNH incinerator depicted in Figure 2, the secondary temperatures are slightly lower than primary chamber indicating malfunction of secondary burner and blockage of passage of gases into the secondary chamber.
4.3. Plots of Primary Chamber Temperature Profiles for Each Cycle
Each time the new waste load is charged into the chamber, both temperatures decrease and after few seconds the primary temperature rises again to maximum and the falls again, as the cycle is completed. The temperature rise depends on the amount of sharp waste loaded into incinerator. The study reveals that in some cases the primary temperatures increases excessively to 900˚C indicating that more sharps was introduced into the primary chamber, which is also an indication of poorly functioning temperature control system. The cycle time of incineration process was determined by recording the duration of a complete cycle from first loading to another loading. Loading of waste lowers the temperatures for about 2 - 5 minutes and when combustion increases the temperature rises on both chambers. The horizontal axis in Figure 3 to Figure 5 is the time recorded during actual incineration cycle, excluding preheating time for the first cycle. As indicated on Figure 3, there were few cycles with longer cycle time of up to 60 minutes, whereas most cycles took between 26 - 38 minutes. This indicates different waste quantities and compositions were being incinerated. According to Figure 3, it is evident that T1-C1, T1-C2 and T1-C3 were operated at temperature below 800˚C whereas the remaining cycles were operated between 850˚C to 950˚C.
Figure 3 reveals that curves of temperature profiles are similar for primary chamber, indicating that all incineration cycles undergo the same processes, but with varying speed or duration. However, a closer examination of the temperature profiles shows that there is a wide variation in maximum temperatures as well as variation in time to reach maximum temperature, as discussed below.
During combustion cycles, it was observed that the maximum temperatures were being reached after a duration which varied from one cycle to another. This is attributable to waste properties such as moisture content and composition. Figure 4(a) shows the temperature profiles for the primary chamber with a wide variation in time to reach maximum temperature for cycles with maximum temperature above 850˚C. The great similarity in the shape of the curves is still noted, with a right-hand skew due to cooling after the waste load is completed.
Regardless of the maximum temperature reached, the profiles shows the shift in the time to reach maximum, as shown in Figure 4(b), for cycles with maximum temperature below 800˚C. It should be noted in Figure 4(a) and Figure 4(b) that, during the first 1 - 5 minutes after loading, the temperature drops slightly due to cooling effect of the waste and also due to escape of hot gases when the chamber waste-charging door is opened.
Figure 1 to Figure 4 indicates that there is a wide range of maximum temperatures observed in the primary chamber during incineration cycles. Figure 5 shows the differences in maximum temperatures reached during different incineration cycles (C3, C8 and C8) on the same day, but reaching the maximum temperature at the similar time starting from loading of waste, about 10 minutes. While this does not affect the cycle time, it is a criteria for good incinerator performance. High maximum temperatures were observed when the waste loaded had low moisture content, contained more sharps waste, and are properly segregated at the source and also when the burners were in good working conditions. The primary chamber attained different maximum temperature during daily operations and also from day to day due to changes in the waste characteristics. Figure 5 shows that the maximum temperature could vary from 750˚C to 950˚C.
4.4. Determination of Cycle Times Based on Temperature Profiles
After the waste is completely destroyed in the primary chamber, the temperature drops slowly from the maximum value towards the room temperature if no waste is loaded. Between consecutive cycles, temperature does

Figure 3. Primary chamber sample temperature profiles indicating different cycle times.
 (a)
(a) (b)
(b)
Figure 4. (a) Time to reach the maximum temperature in the primary chamber above 800˚C for selected incineration cycles; (b) time to reach the maximum temperature in the primary chamber below 800˚C for selected incineration cycles.

Figure 5. Shift in the maximum temperature for the primary chamber during incineration cycles.
not fall completely, but at about 550˚C, the new load should be charged and the temperature will drop and start rising again. Figure 6 shows the distribution of temperatures recorded during waste charging, for 75 cycles. It was observed that most of the time, charging of the waste is done at lower temperatures, with an average temperature of 448˚C. The model value was however, higher, at about 485˚C, although still considered to be lower. Moreover, the distribution shows that the loading temperature was negatively skewed (Sk = −1.04), indicating that there are times when loading take place while the chamber is still at a very low temperature. This kind of operation resembles the small scale incinerators which start by loading the waste into the chambers, closing the door and then starting the secondary chamber burner followed by the primary burner. The door is not opened until all the waste is destroyed.
By observing the cooling temperature profiles, which are similar in shape except the time to reach 550˚C, it was possible to establish the cycle times, spread of which was analyzed as shown in the histogram, Figure 7. The average cycle time for 50 cycles was observed to be 29 minutes, with a standard deviation of 9 minutes. The shape of the probability density function is close to normal, slightly skewed towards the right (Sk = 0.62), for

Figure 6. Probability distribution of the primary chamber temperature at the time of waste loading.

Figure 7. Distribution of the cycle time data based on time to reach 500˚C during cooling.
which extended cycle times of up to 59 minutes were observed. This was attributable to wet or poorly segregated waste being loaded in the primary chamber. The minimum cycle time observed under this category was 10 minutes.
Table 4 shows the comparison between the statistical analyses of the cycle time data based on the two methods employed in this study. The differences can be attributed to the fact that loading takes place after the temperature has dropped below 550˚C, hence longer values than the cooling method.
Based on this definition, 64 cycles were assessed, giving an average cycle time of 32.7 minutes, with a standard deviation of 10.9 minutes. The probability density function was close to normal, as the loading time was based on machine settings, as shown in Figure 8. However, the minimum cycle time was 13 minutes while longer cycle times of up to 68 minutes were observed leading to higher positive skewness. Such a variation in time between loading events, revealed by the statistical parameters, shows that the machine operations is not proper.
Table 4 compares the statistical analyses of the cycle time data based on two different definitions, that is, time between loading events and time to reach 550˚C during cooling session, both of which gives similar results.
4.5. Chamber Preheating Temperature Profiles
Before waste is loaded into the primary chamber to start the daily incineration routine, the chamber is always preheated to higher temperatures. Due to different chamber sizes, while the primary and secondary burners are the same, the final preheating temperatures are higher in secondary (650˚C - 700˚C) than in the primary chamber
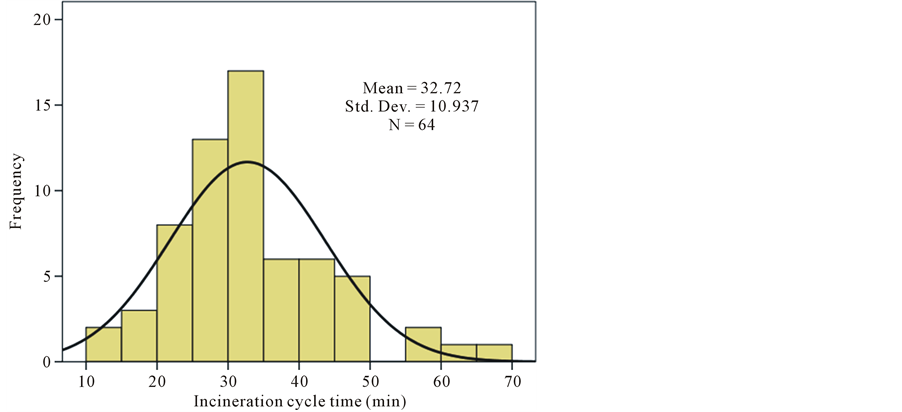
Figure 8. Probability density function of the cycle time data based on intervals between waste loading events.
Table 4. Comparison of the statistical analysis of the cycle time data.
(350˚C - 450˚C), as shown in Figure 8. It is also noted that the starting temperatures are not necessarily the same for both primary and secondary chamber, and depends on the initial temperature conditions before starting the process. Figure 8 shows further that despite the differences in initial preheating temperatures, the burners were operating with fluctuating heating rate, or the chamber thermal properties vary widely with waste characteristics, such that the rates of temperature rise were observed to be different. Moreover, the final preheating temperatures are different for each incineration day for both T1 and T2. The final temperatures reached during preheating in secondary chamber is high compared to the data recorded for the primary chamber, due to the fact that the size of secondary chamber is smaller than that of the primary chamber where large volume of waste has to be accommodated.
Since the temperature rise during preheating is related to empty chambers without any waste present, the variations in data represents burner performance fluctuations. Based on profiles in Figure 9, it is evident that the temperature rise stops at t = 10 minutes in both chambers indicating that this should be the maximum preheating time. If loading takes place at this time, the first cycle time will be reduced leading to minimized daily incineration time and hence reduced fuel consumption.
Figure 9 shows the variations in the pre-heating times for ten different incineration days. The shortest preheating time of 8.5 minutes and longest preheating time of 43 minutes were observed, giving an average value of 25.45 minutes.
4.6. Primary Chamber Heating Rate during Incineration
The differences in burner heating rate during chamber preheating can be attributed to burner service requirements, cleanliness of the firing parts, cleanliness of the fuel used, and presence of absence of ashes in the primary chamber. Figure 11 shows the variations of chamber heating rate (based on the rate of change of temperature, dT/dt) for four selected days. This data was collected when the chamber is empty before loading the waste. It is evident that the heating rate profiles are different, with peak values at different incineration times. In two cases, the highest heating rates were observed at the beginning of the preheating period (Day 1 and Day 16) while the other two the peaks for maximum heating rate were observed later (Day 13 and Day 15). This information signals to the technicians that the burners require services more often.
It can be seen that from t = 10 minutes, the rate of increase in temperature has dropped almost to zero, signifying that the preheating time of 10 minutes is long enough to minimize the cycle time and save fuel, as stated above.

Figure 9. Chamber preheating temperature profiles (for the mean preheating time of 25 min).

Figure 10. Variations in chamber preheating times.


Figure 11. Primary chamber preheating rate (˚C/min).
The overall rate of change in temperature during incineration for selected days was studied to identify which phase undergoes faster temperature change, and also to assess the burner efficiency. The rate of change of temperature with time is the parameter which describes the burner capacity against chamber size and waste type, but can also indicate changes in burner efficiency with time. The burner capacity vs. chamber size was studied from the primary chamber preheating times for selected days. In the primary chamber, however, the rate of change of temperature with time was low due to large size of chamber and presence of waste load. The maximum rate of change in temperature in primary chamber was studied for each incineration cycle. Figure 12 shows the observed maximum values in the 40 selected cycles, arranged in descending order. The heating rate varied between 80 and 160˚C/min. Statistical process control techniques will require plotting a control chart to enable detection of the decrease in the burner efficiency, indicated by the decrease in heating rate, outside the lower control limit, for example one standard deviation below the mean value (not shown in Figure 12).
Due to fluctuations in the heating rates observed during the incineration cycle, the average values for 40 cycles are plotted against incineration time in Figure 13, giving an exponential decay curve (Equation (1)):
 (1)
(1)
with a good fit (R2 = 0.9832). This implies that, initially, while the chamber is at lower temperature, the heating rate is higher, and decreases as the temperature rises with time. The heating rate reaches the minimum when the maximum temperature is reached in the chamber. Based on data presented in Figure 9 to Figure 11, the exponential function exists during the chamber preheating time.

Figure 12. Maximum heating rate in the primary chamber for selected incineration cycles.

Figure 13. Average heating rate in the primary chamber for 40 incineration cycles.
4.7. Load Preparation Time and Temperature Drop during Waste Loading
The MNH incinerator allows for load preparation time before end of the cycle is reached. Before loading into the chamber, the waste is lifted by operators and loaded into the bin, which is the dropped automatically into the chamber. The time available for load preparation is a key factor in the incinerator performance as it allows proper mixing of the waste (sharps and other waste) and correct weight being charged. Knowledge of this parameter forms a critical training item for the new operators, since it calls for responsibilities in keeping the machine running and performing the task. A sample of 60 cycles was analyzed, giving the average time of 14.6 minutes, with a standard deviation of 6.61 minutes, as shown in Figure 14. The data is however skewed to the right (Sk = 1.6) indicating that higher durations for load preparations were observed. This can be attributed to operator skills and performance problems, as well as machine malfunctioning. The minimum load preparation time of 3.5 minutes and maximum of 42 (longer than the average cycle time) minutes is an indication of operational problem.
When loading waste into incinerator, the temperature in both chambers decreases for about 1 - 5 minutes depending on waste composition and moisture content. Based on data collected in this study, by noting the temperature at the time of loading and then tracing its decrease to the minimum before it starts to raise again, it was possible to plot the data for various cycles (N = 75 cycles), as shown in Figure 15, for the primary chamber only.
Figure 16 shows the probability distribution of the temperature drop data in primary chamber during incineration due to waste loading studied for 75 cycles. The established average temperature drop was 48.6˚C, which is on the higher side, with stronger fluctuations between different cycles, with a standard deviation of 37.5˚C. The probability density function for the temperature drop due to loading of the waste was observed to be positively skewed (Sk = 1.37) indicating that there are cases where the temperature drop is too high to affect the operation of the incinerator. The effect of excessive temperature drop (up to as high as the maximum recorded values of 200˚C) will lead to higher fuel consumption, since energy is required to raise the temperature again using burners. Moreover, extended cycle time leads to high fuel consumption.

Figure 14. Load preparation time distribution for different incineration cycles.

Figure 15. Decrease in primary chamber temperature due to waste loading.

Figure 16. Probability distribution of the temperature drop data in primary chamber during incineration due to waste loading.
5. Conclusions
Monitoring of temperature is essential for understanding the performance of double chamber incinerator. This is because, based on temperature profiles, it is possible to establish average cycle time, effect loading on chamber temperatures, functionality of the burners based on actual temperature and heating rate, effectiveness of the chamber preheating, etc. These results generally give picture that, when more pathological waste is loaded into incinerator the temperature is not as high as when more sharp waste was loaded, proper combination of waste types (sharps waste and other waste) is crucial for attaining higher temperature and faster rise in the incinerator chambers. Based on this study, it has been established that the temperature profiles for both chambers should be of the same shape for all incineration cycles; with differences only in peak values and time to reach maximum temperatures otherwise a technical problem is indicated.
The average cycle time based on intervals between loadings was observed to be 32.7 minutes and 28.97 minutes for the data based on time to drop to 550˚C after the maximum temperature. Longest cycle times indicated that there is a problem in burner functionality or in waste segregation. For pathological wastes incineration time is high as more time is required to burn the waste. If the wastes comprise of mainly sharps waste and other laboratory waste the cycle time will be shorter. The heating rate in the chamber was observed to decrease with time as the chamber temperature increased during incineration.
The chamber preheating rate based on rate of increase in temperature was also a parameter that can be used to assess the burner performance. The average chamber preheating time was observed to be 25.47 minutes, while the average load preparation time was 14.6 minutes. The trend analysis will help hospital engineers and technicians to observe and understand any abnormalities of the incinerator that need special attention. Proper planned preventive maintenance schedule has to be established to improve equipment life and avoid unplanned maintenance activity.
Acknowledgements
The completion of this study has been the result of assistance received from various staff. Gratitude goes to MNH Management team (for permission to use Muhimbili National Hospital as study area) and all staff in the Engineering department for their assistance during data collection.
Cite this paper
Veilla E.Matee,Samwel V.Manyele, (2015) Analysis of Temperature Profiles and Cycle Time in a Large-Scale Medical Waste Incinerator. Engineering,07,717-732. doi: 10.4236/eng.2015.710063
References
- 1. Santoleri, J.J. (1985) Design and Operating Problems of Hazardous Waste Incinerators. Environmental Progress, 4, 246-251.
http://dx.doi.org/10.1002/ep.670040408 - 2. Manyele, S.V. and Kagonji, I.S. (2012) Analysis of Medical Waste Incinerator Performance Based on Fuel Consumption and Cycle Times. Engineering, 4, 625-635.
http://dx.doi.org/10.4236/eng.2012.410080 - 3. Kagonji, I.S. and Manyele, S.V. (2010) Analysis of the Measured Medical Waste Generation at Amana and Ligula Hospitals Using Statistical Methods. African Journal of Environmental Science and Technology (AJEST), 5, 815-833.
- 4. Singh, S. and Prakash, V. (2007) Toxic Environmental Releases from Medical Waste Incineration: A Review. Environmental Monitoring, 132, 67-81.
http://dx.doi.org/10.1007/s10661-006-9503-3 - 5. Manyele, S.V. (2004) Medical Waste Management in Tanzania. Current Situation and the Way Forward. African Journal of Environmental Assessment and Management (AJEAM), 8, 74-99.
- 6. Manyele, S.V. and Mujuni, C.M. (2010) Current Status of Sharps Waste Management in Lower Level Health Facilities in Tanzania. Tanzania Health Research Journal, 12, 257-264.
http://dx.doi.org/10.4314/thrb.v12i4.53362 - 7. Blackman Jr., W.C. (1996) Basic Hazardous Waste Management. 2nd Edition, Lewis Publishers, Boca Raton.
- 8. Oppelt, E.T. (2007) Incineration of Hazardous Waste—A Critical Review. Journal of the Air Pollution Control Association, 37, 558-586.
- 9. Kaseva, M.E. and Mato, R.R.A.M. (1999) Critical Review of Industrial and Medical Waste Practices in Dar es Salaam City. Resource Conservation and Recycling, 25, 271-287.
http://dx.doi.org/10.1016/S0921-3449(98)00068-8 - 10. Manyele, S.V. and Anicetus, H. (2006) Management of Medical Waste in Tanzanian Hospitals. Tanzania Health Research Bulletin, 8, 177-182.
- 11. Allsopp, M., Costner, P. and Johnston, P. (2001) State of Knowledge of the Impacts of Waste Incinerators on Human Health. Environ Science and Pollution Research, 8, 141-145.
http://dx.doi.org/10.1007/BF02987308 - 12. Gidarakos, E., Petrantonaki, M., Anastasiadou, K. and Schramm, W. (2009) Characterization and Hazard Evaluation of Bottom Ash Produced from Incinerated Hospital Waste. Journal of Hazardous Materials, 172, 935-942.
http://dx.doi.org/10.1016/j.jhazmat.2009.07.080 - 13. Sharifah, A.S.A.K., Abidin, H.Z., Sulaiman, M.R., Khoo, K.H. and Ali, H. (2008) Combustion Characteristics of Malaysian Municipal Solid Waste and Predictions of Air Flow in Rotary Kiln Incinerator. Journal of Material Cycles and Waste Management, 10, 116-123.
http://dx.doi.org/10.1007/s10163-008-0207-3 - 14. Kagonji, I.S., Manyele, S.V. and Mrisho, J. (2011) Assessment of a Double Chamber Incinerator Performance Based on Ash Characteristics. Engineering, 3, 1045-1053.
http://dx.doi.org/10.4236/eng.2011.310130