Engineering
Vol. 5 No. 9 (2013) , Article ID: 36388 , 8 pages DOI:10.4236/eng.2013.59091
Comparison of Measured and Dynamic Analysis Vertical Accelerations of High-Speed Railway Bridges Crossed by KTX Train
Structural Engineering Research Division, Korea Institute of Construction Technology, Goyang, South Korea
Email: hiyoon@kict.re.kr
Copyright © 2013 Hyejin Yoon et al. This is an open access article distributed under the Creative Commons Attribution License, which permits unrestricted use, distribution, and reproduction in any medium, provided the original work is properly cited.
Received July 6, 2013; revised August 6, 2013; accepted August 13, 2013
Keywords: High-Speed Railway Bridge; Vertical Acceleration; Dynamic Response
ABSTRACT
Since high-speed railway bridges are subjected to cyclic loading by the continuous wheel loads traveling at high speed and regular spacing, their dynamic behavior is of extreme importance and has significant influence on the riding safety of the trains. To secure the riding safety of the trains, advanced railway countries have limited the vertical acceleration of the bridge slab below critical values at specific frequency domains. Since these limitations of the vertical acceleration constitute the most important factors in securing the dynamic safety of the bridges, these countries have opted for a conservative approach. However, the Korean specifications limit only the size of the peak acceleration without considering the frequency domain, which impede significantly rational evaluation of the high-speed railway bridges in Korea. In addition, the evaluation of the acceleration without consideration of the frequency domain is the cause of disagreement between the dynamic analysis and measurement results. This study conducts field monitoring and dynamic analysis on high-speed railway bridges to gather the acceleration signals and compare them. Significant difference in the size of the vertical acceleration was observed between the measured and dynamic analysis accelerations when discarding the frequency domain as done in the current specifications. The comparison of the accelerations considering only low frequencies below 30 Hz showed that the dynamic analysis reflected accurately the measured vertical acceleration.
1. Introduction
Europe has implemented continuously research on the dynamic behavior of railway bridges since 1950s. The D214 Project conducted by the European Rail Research Institute (ERRI) Committee provided the fundamental data that served as basis for the preparation of the specifications related to the dynamic behavior of high-speed railway bridges in the Eurocode and UIC [1]. Especially, the vibration acceleration specification of the bridge slab constitutes the most important part for securing the dynamic stability if the high-speed railway bridge. Excessive acceleration occurring in the slab of the railway bridge may provoke resonance, loss of the fastening force of the ballast, reduction of contact force between the ballast systems, stiffness loss and movement of the track, uplift of the bearing, etc. [2]. ERRI conducted the laboratory tests on gravel ballast track models. They found out that an acceleration of the bridge slab larger than 0.7 g provoked vertical settlement and serious degradation of the horizontal resistance of the ballast. Accordingly, a limit value of 0.35 g was suggested for the vibrational acceleration of the ballasted track slab by applying a safety factor of 2. Besides, a value of 0.50 g was proposed for bridges without risk of loss of fastening force of the ballast [3]. Based upon the research results of ERRI D214, Eurocode [4] and UIC [5] proposed limit criteria for the vertical acceleration of the high-speed railway bridge. Eurocode limits the acceleration of the bridge to prevent the instability of the track and secure riding safety. These values are 0.35 g for gravel ballast tracks and 0.50 g for concrete slab ballast. Eurocode specifies to apply the following criterion for the check of the acceleration [4].
 . (1)
. (1)
where,  is the first fundamental frequency of the considered member (Hz); and,
  is the third frequency of the member (Hz). Similarly to the Eurocode, UIC specifies to maintain the acceleration of the slab below 0.35 g and 0.5 g at frequency smaller than 30 Hz for the gravel ballast and concrete slab ballast, respectively. In addition, the dynamic analysis using mode superposition shall not only consider the frequencies up to 1.5 times the first mode frequency but also include at least the third mode [5].
In Korea, research was implemented actively on the dynamic behavior and dynamic characteristics of highspeed railway bridges after the construction of the Gyeongbu Line, the first high-speed railway line, but without providing the fundamental dynamic properties that could serve as basis for all types of specifications. A review of the specifications used for the design of the high-speed railway bridges from the Gyeonbu Line to date reveals that BRDM [6] applied for the Gyeongbu Line and the High-Speed Railway Design Code [7] were followed by the Honam High-Speed Railway Design Guidelines [8] for the passenger-dedicated high-speed railway line, and the current Railway Design Code [9]. These regulations limit the vertical acceleration of the slab of high-speed railway bridges to 0.35 g and 0.5 g for gravel ballast and concrete ballast, respectively. However, these specifications regulate only the size of the peak vertical acceleration of the bridge slab as the Eurocode but without considering the frequency domain. Since the acceleration response varies sensitively with the frequency at which the acceleration signal is measured, the effective frequency domain shall be imperatively considered during the comparison with the dynamic analysis results [3]. The current specifications in Korea do not propose the frequency domain necessary for the evaluation of the acceleration, which makes it difficult to perform rational comparison of the accelerations obtained by dynamic analysis and measurement. This study conducted field monitoring and moving load analysis to gather the acceleration responses of high-speed railway bridges and compare the measured signals and analysis results with respect to the eventual consideration of the frequency domain.
2. Acquisition of Acceleration Response
2.1. Selected Bridges
Field monitoring and moving load dynamic analysis were performed on selected bridges under operation in Korea to compare the measured accelerations and dynamic analysis results according to the crossing of the high-speed train. The bridges were selected considering the type of their track. Table 1 arranges the characteristics of Gomo viaduct, a PSC beam bridge with gravel ballast. Table 2 arranges the features of Seongdong viaduct, a PSC box bridge applying concrete ballast.
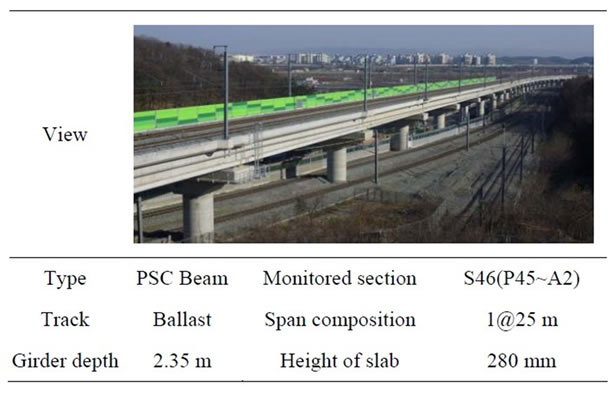
Table 1. View and dimensions of Gomo viaduct.
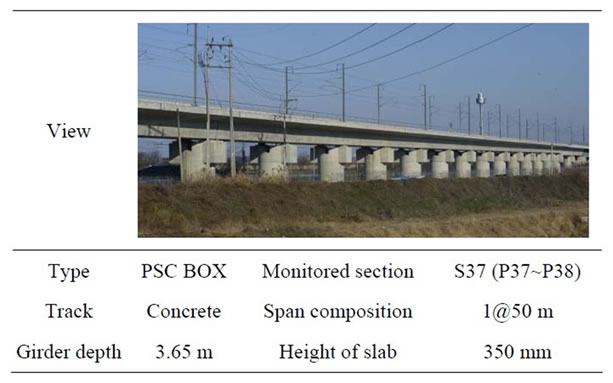
Table 2. View and dimensions of Seongdong viaduct.
2.2. Field Monitoring
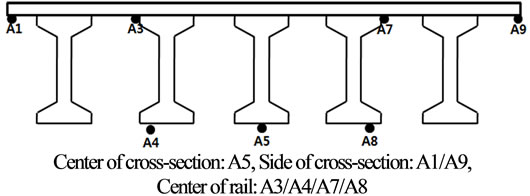
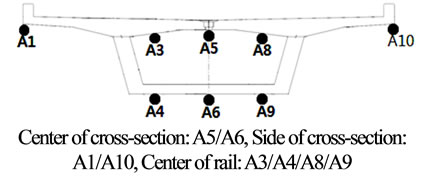
Accelerometers were installed to acquire the vertical acceleration responses of the slabs during the crossing of the KTX train. The accelerometers were disposed at midspan of the bridges at the center and sides of the crosssection as well as at the center of the rails. Figures 1 and 2 illustrate the layouts of the accelerometers in Gomo viaduct and Seongdong viaduct, respectively. The sampling rate of the accelerometers is 250 Hz. Monitoring was done during one day and the trains operated during that period are listed in Tables 3 and 4. For Gomo viaduct, 48 trains were measured with speeds ranging between 107 and 130 km/h and, for Seongdong viaduct, 47 trains with speeds ranging between 160 and 185 km/h.
2.3. Dynamic Analysis
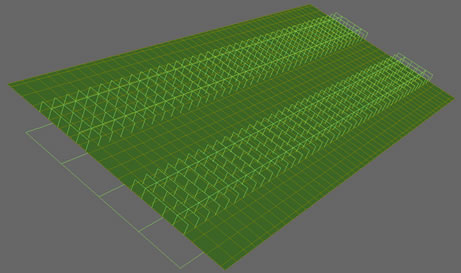
Moving load dynamic analysis was performed to obtain the dynamic responses of the selected bridges crossed by the KTX train. Three-dimensional modeling of the bridges considering the bridge-track-train interaction and including the track structure was achieved for accurate analysis. In the model of Gomo PC beam viaduct of Figure 3(a), the deck is modeled by means of 4-node shell elements and the girder and cross beams by beam elements. Beam-type constraints are applied for the con-
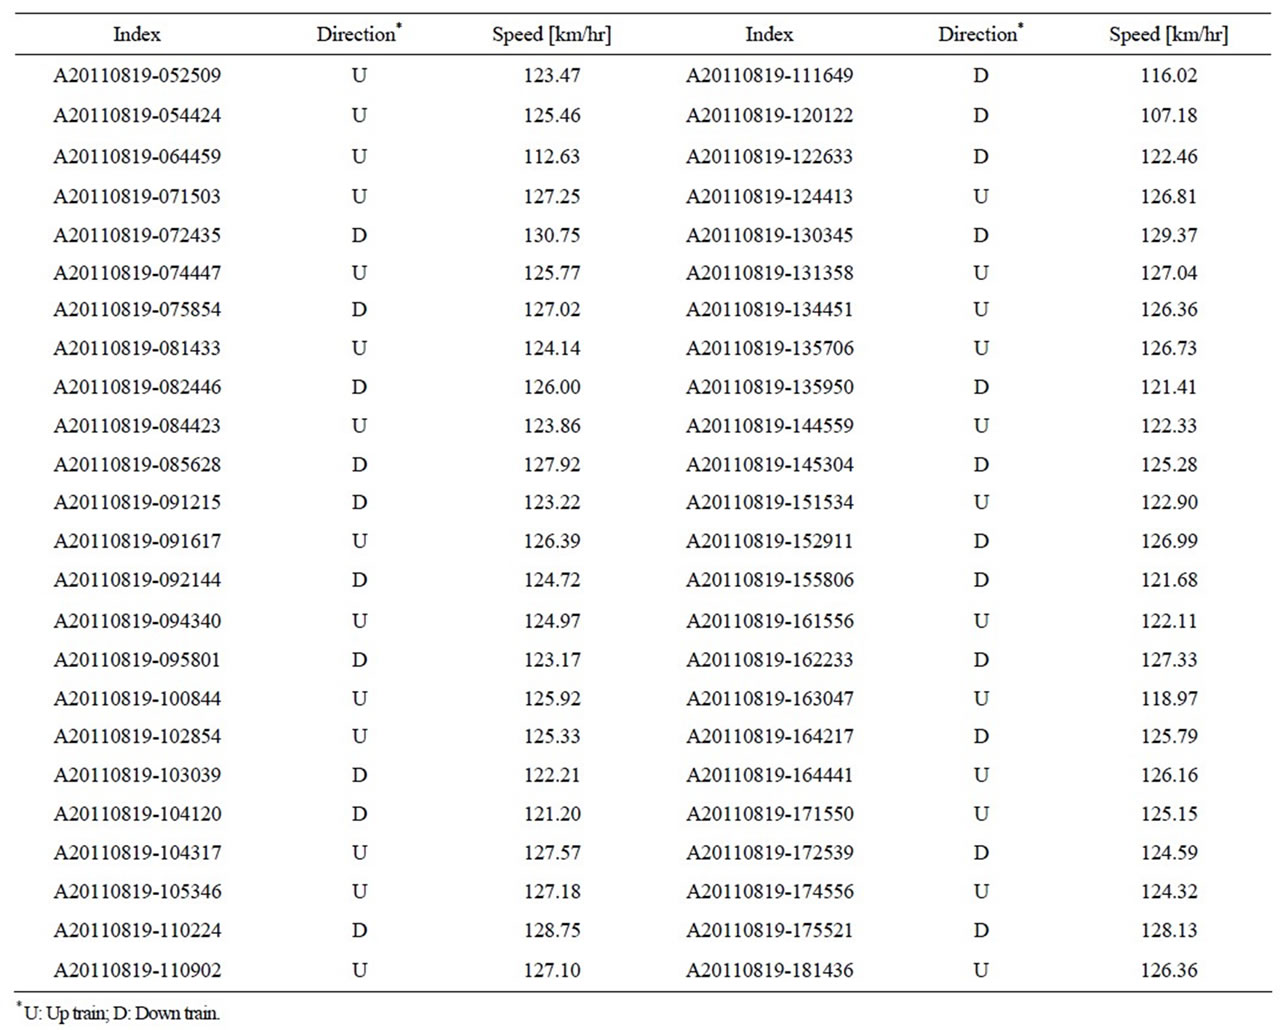
Table 3. Trains monitored on Gomo viaduct.
 (a)
(a)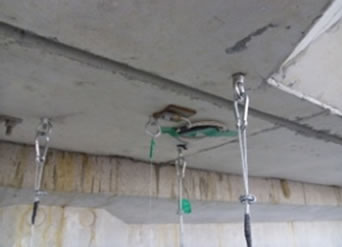 (b)
(b)
Figure 1. Acceleration measurement in Gomo viaduct. (a) Layout of accelerometers; (b) View of installed accelerometers.
 (a)
(a)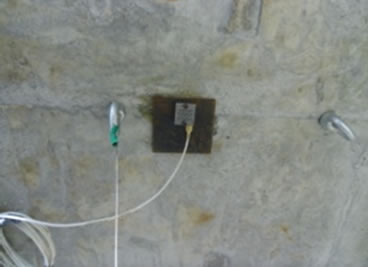 (b)
(b)
Figure 2. Acceleration measurement in Seongdong viaduct. (a) Layout of accelerometers; (b) View of installed accelerometers.

Table 4. Trains monitored on Seongdong viaduct.
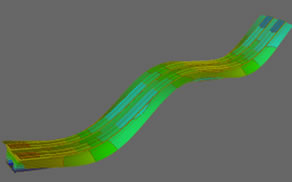
nection between the girder and deck considering the depth of the girder. Beam-type constraints are also adopted for the bridge bearings considering the distance to the girder. In the model of Seongdong PSC box girder viaduct of Figure 3(b), the deck is modeled by means of 4-node shell elements and the girder by 8-node solid elements. The parapet of the deck is represented as by masses and its stiffness is neglected.
The KTX convoy composed of 20 coaches is modeled by moving concentrated loads. The speed of the train is varied by step of 10 km/h up to 420 km/h, corresponding to 1.1 times the design speed of the Railway Design Code. Moreover, static moving load analysis corresponding to the speed of 0 km/h, the resonance and subsidiary resonances speeds relative to the first bending mode, which has critical effect on the responses, and the resonance and non-resonances speeds relative to the first torsional mode are included in the analysis. In order to obtain reliable results from the moving load analysis, the time interval is selected to satisfy the specifications of the Railway design Code and Eurocode. The dynamic analysis program developed by the Korea Institute of Construction Technology is used for the analysis.
3. Analysis of Results
3.1. Analysis of Fundamental Frequencies
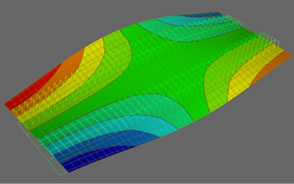
The natural frequencies computed by the FFT analysis of the accelerations obtained by measurement and analysis were compared to verify the validity of the bridge models. Figures 4 and 5 present the vibration modes and natural frequencies resulting from eigenvalue analysis. The fundamental frequencies of Gomo viaduct and Seongdong viaduct are 7.38 Hz and 3.77 Hz, respectively. In addition, the analysis of the natural frequencies from the acceleration signals measured at 8 points selected arbitrary
 (a)
(a)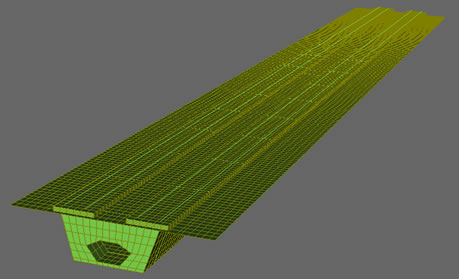 (b)
(b)
Figure 3. Bridge models. (a) Gomo viaduct; (b) Seongdong viaduct.
 (a)
(a)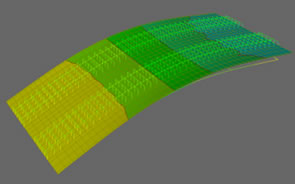 (b)
(b)
Figure 4. Eigenvalue analysis results (Gomo viaduct). (a) 1st mode (7.38 Hz); (b) 2nd mode (9.56 Hz).
 (a)
(a)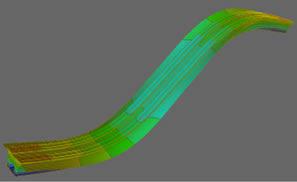 (b)
(b)
Figure 5. Eigenvalue analysis results (Seongdong viaduct). (a) 1st mode (3.77 Hz); (b) 2nd mode (5.34 Hz).
in each bridge gave values of 7.660 Hz for Gomo viaduct and 3.662 Hz for Seongdong viaduct (Table 5). The deviation in the natural frequency estimated from eigenvalue analysis and from the measured signals reaches 3.66% for Gomo viaduct and 2.95% for Seongdong viaduct and demonstrates the validity of the bridge models of this study.
3.2. Acquisition of Peak Acceleration by Measurement and Dynamic Analysis
Investigation is conducted for the acceleration signals
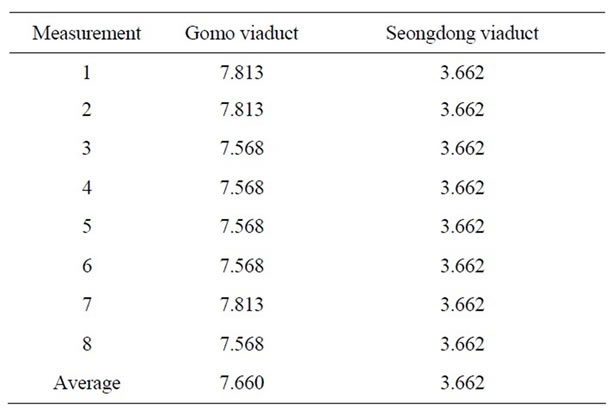
Table 5. Measured natural frequencies.
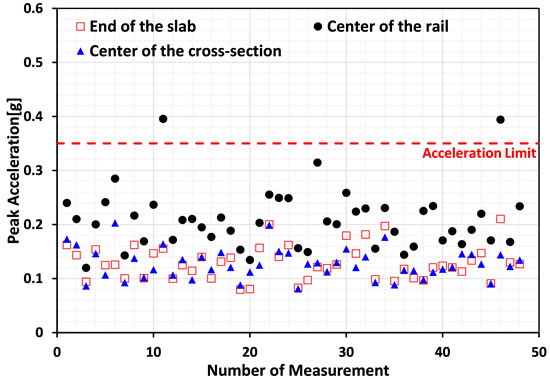
measured at the end of the slab, center of the rail and center of the cross-section in the direction of the train among the acceleration signals acquired at various points in the bridge slab. Figure 6 plots the peak accelerations per measurement point acquired at sampling rate of 250 Hz. The largest response in Gomo PSC beam viaduct was measured at the center of the rail whereas the responses at the side and center of the cross-section have similar values. For Seongdong viaduct, the PSC box bridge, the largest response was measured at the center of the cross-section while the responses at the side of the cross-section and center of the rail have similar values.
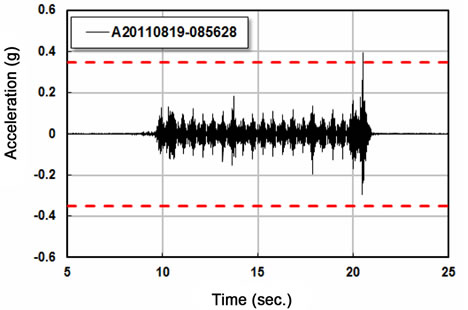
Besides, responses exceeding the limit of 0.35 g for the acceleration in bridges with gravel ballast track were observed in Gomo viaduct. Figure 7 plots the time histories of the acceleration in the cases where the limit value is exceeded. It can be seen that the vertical acceleration of the bridge slab exceeds the limit value only once during the crossing of the KTX train, which is difficult to be interpreted as degrading the safety of the bridge. Moreover, no vertical acceleration exceeding the limit values could be observed when considering only the low frequency domain known to affect practically the bridge.
On the other hand, Figure 8 presents the locations of the acceleration responses for the comparison of the dynamic analysis results with the measured acceleration signals. These locations are the side and center of the cross section and the center of the rail in the riding direction of the train. Figure 9 plots the peak acceleration responses per riding speed. Here, the frequency domain was selected with respect to the time interval necessary for the analysis.
3.3. Comparison of Accelerations
The current Railway Design Code in Korea does not consider the frequency domain during the evaluation of the measured acceleration. Besides, even if the Code specifies to include the modes affecting the responses of the bridge during the dynamic analysis by mode super-
 (a)
(a) (b)
(b)
Figure 6. Peak accelerations. (a) Gomo viaduct; (b) Seongdong viaduct.
 (a)
(a)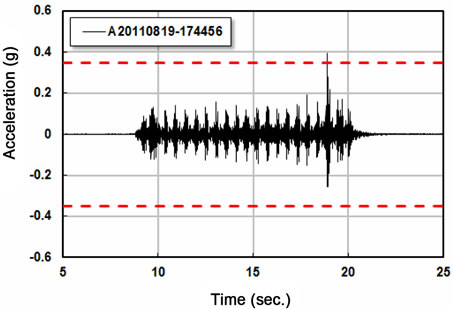 (b)
(b)
Figure 7. Time histories of acceleration exceeding the limit values (Gomo viaduct). (a) A20110819-085628; (b) A20110 819-174456.
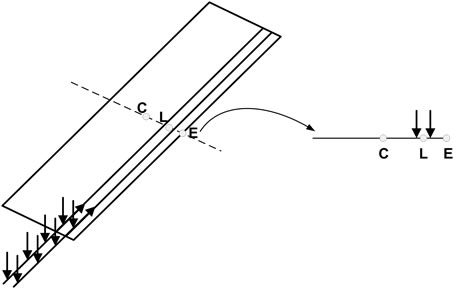
Figure 8. Location of acceleration responses.
 (a)
(a)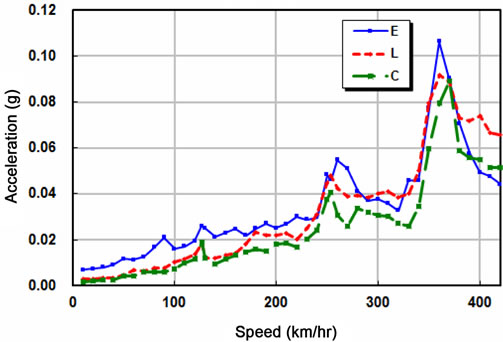 (b)
(b)
Figure 9. Moving load analysis results. (a) Gomo Viaduct; (b) Seongdong Viaduct.
position, the absence of the consideration of the frequency domain in the time domain dynamic analysis renders it difficult to achieve rational evaluation of the acceleration. This means that it is difficult to compare the measured acceleration responses and those obtained from dynamic analysis for the same bridge.
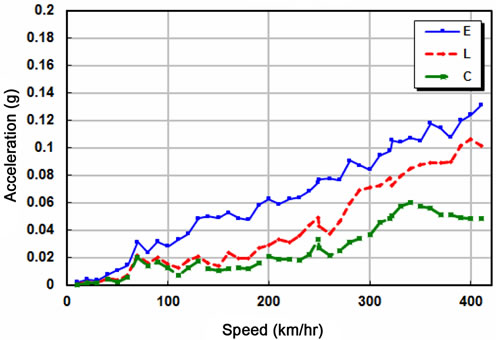
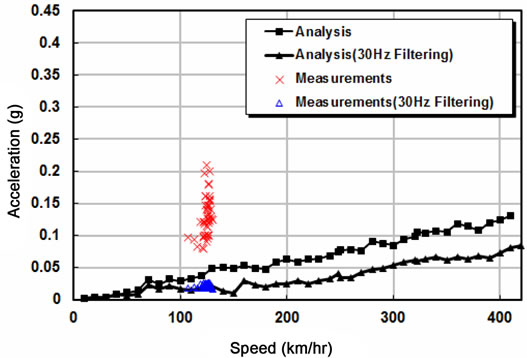
Figures 10 and 11 compare the peak accelerations obtained from measurement and by moving load analysis according to the consideration or not of the frequency domain. Here, the frequencies are limited below 30 Hz to account only for the low frequency contents having real influence on the behavior of the bridges as specified by the Eurocode. To that goal, low pass filtering was performed. It can be observed that the size of the acceleration response differs significantly according to the eventual consideration of the frequency domain. Moreover,
 (a)
(a) (b)
(b)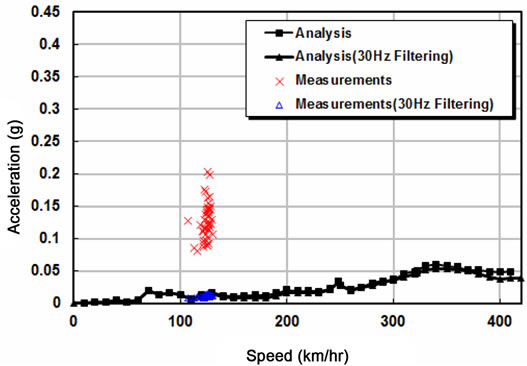 (c)
(c)
Figure 10. Gomo viaduct. (a) Loaded end (E); (b) Loaded point (L); (c) Center of cross-section (C).
the variation of the measured acceleration according to the eventual consideration of the frequency domain appears to be larger than that of the analytic acceleration. This indicates that the frequency domain shall be considered to evaluate the measured acceleration.
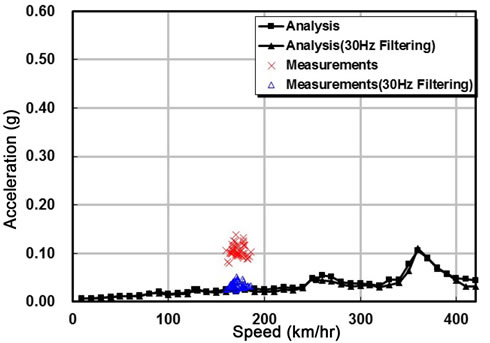
In addition, the agreement between the measured acceleration and the results of the moving load analysis is examined when the frequency domain is limited below 30 Hz. It appears that the measured and analytic accelerations exhibit considerable difference when the frequency domain is not considered. However, the low pass filtering below 30 Hz results in good agreement between both acceleration responses.
 (a)
(a)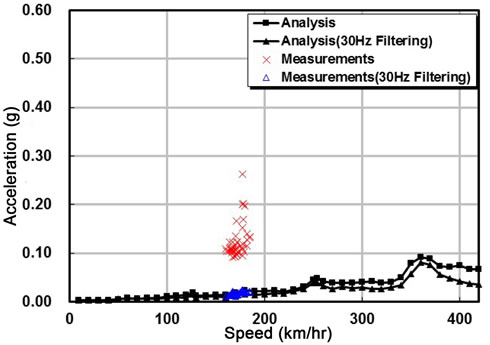 (b)
(b)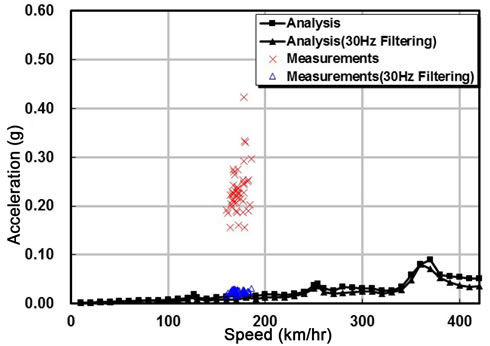 (c)
(c)
Figure 11. Seongdong viaduct. (a) Loaded end (E); (b) Loaded point (L); (c) Center of cross-section (C).
4. Conclusion
The current Railway Design Code in Korea provides limitations only on the peak acceleration without considering the frequency domain for the evaluation of the acceleration performed to secure the dynamic safety of the railway bridge. Such approach is an important factor degrading the reliability of the evaluation of high-speed railway bridges and is also inducing disagreement between the results of the dynamic analysis and the measured accelerations. This study conducted field monitoring and moving load analysis on 2 high-speed railway bridges operating in Korea to acquire their acceleration responses. Accelerometers were installed in the center and sides of the cross-section and center of the rails at midspan of the bridges and the acceleration signals were gathered at sampling rate of 250 Hz. Three-dimensional bridge models considering the bridge-track-train interaction and reflecting the track structure model were established to conduct accurate moving load analysis. The validity of the bridge models was verified through comparison of the natural frequencies obtained by FFT analysis of the measured accelerations and the dynamic analysis accelerations. Since the acceleration response includes various frequency contents, the size of the response varies according to the considered frequency domain. Therefore, low pass filtering was carried out to consider only the acceleration responses caused by frequencies below 30 Hz corresponding to the frequency domain influencing actually the behavior of the bridge slab. The size of the response was seen to reduce when considering only the measured and analytic accelerations with frequency below 30 Hz. Especially, the measured acceleration experienced significant reduction and was more sensitive to the effect of the frequency domain. Moreover, the measured acceleration and dynamic analysis acceleration exhibited considerable difference when the frequency domain was not considered. However, good agreement between the measured accelerations and moving load analysis results was achieved when executing low pass filtering at 30 Hz. Consequently, the frequency domain shall be considered for the comparison of the measured accelerations and the accelerations obtained from dynamic analysis. Therefore, rational criteria considering the frequency domain shall be established to revise the limitations related to the acceleration of the high-speed railway bridge in Korea and provide valid evaluation of the acceleration.
5. Acknowledgements
This research was supported by a grant from a Strategic Research Project (The Development of Design Core Technology on the Girder and Tethering System for Submerged Floating Bridge Construction) funded by the Korea Institute of Construction Technology and from Research Project (Research for the Improvement of Global Competitiveness in Railway Construction) funded by Korea Rail Network Authority.
REFERENCES
- ERRI Specialists’ Committee D214, “Rail Bridges for Speeds > 2000km/h, Final Report: Part B Proposed UIC Leaflet,” European Rail Research Institute, 1999.
- ERRI Specialists’ Committee D214, “Rail Bridges for Speeds > 2000km/h, Final Report: Part A Synthesis of the Results of D214 Research,” European Rail Research Institute, 1999.
- ERRI Specialists’ Committee D214, “Rail Bridges for Speeds > 2000km/h-Confirmation of Values against Experimental Data,” European Rail Research Institute, 1999.
- EUROCODE 1 Part 2, “Actions on Structures: General Actions—Traffic Loads on Bridges, European Committee for Standardization.
- UIC(International Union of Railways), “Design Requirement for Rail Bridges Based on Interaction Phenomena between Train and Bridge,” 2nd Edition, 2009
- SYSTRA, “Bridge Design Manual(BRDM) Final Report,” Korea High Speed Rail Construction Authority (KHRC), 1995.
- Korea Railway Network Authority, “High Speed Railway Design Criteria (Vol. Roadbed),” Ministry of Construction & Transportation, 2005.
- Korea Rail Network Authority, “Design Guidelines for Honam High Speed Railway,” Korea Rail Network Authority, 2007.
- Korea Railway Network Authority, “Rail Design Standard,” Korea Railway Network Authority, 2011.