Engineering
Vol. 3 No. 9 (2011) , Article ID: 7334 , 7 pages DOI:10.4236/eng.2011.39115
Stress Analysis of Crane Hook and Validation by Photo-Elasticity
Department Mechanical Engineering, Visvesvaraya National Institute of Technology, Nagpur, India
E-mail: rashmiu71@rediffmail.com
Received July 27, 2011; revised August 12, 2011; accepted August 26, 2011
Keywords: Photo-Elasticity, Crane Hook, Finite Element Method, Curved Beam, Stress Optic Law
ABSTRACT
Crane Hooks are highly liable components and are always subjected to failure due to accumulation of large amount of stresses which can eventually lead to its failure. To study the stress pattern of crane hook in its loaded condition, a solid model of crane hook is prepared with the help of CMM and CAD software. Real time pattern of stress concen-tration in 3D model of crane hook is obtained. The stress distribution pattern is verified for its correctness on an acrylic model of crane hook using Diffused light Polariscope set up. By predicting the stress concentration area, the shape of the crane is modified to increase its working life and reduce the failure rates.
1. Introduction
Crane Hooks are highly liable components that are typically used for industrial purposes. It is basically a hoisting fixture designed to engage a ring or link of a lifting chain or the pin of a shackle or cable socket and must follow the health and safety guidelines [1-4]. Thus, such an important component in an industry must be manufactured and designed in a way so as to deliver maximum performance without failure. Thus, the aim of the project is to study the stress distribution pattern of a crane hook using finite element method and verify the results using Photo elasticity.
2. Failure of Crane Hook
To minimize the failure of crane hook [5], the stress induced in it must be studied. Crane is subjected to continuous loading and unloading. This causes fatigue of the crane hook but the fatigue cycle is very low [6]. If a crack is developed in the crane hook, it can cause fracture of the hook and lead to serious accident. In ductile fracture, the crack propagates continuously and is more easily detectible and hence preferred over brittle fracture. In brittle fracture, there is sudden propagation of the crack and hook fails suddenly [7]. This type of fracture is very dangerous as it is difficult to detect.
Strain aging embrittlement [8] due to continuous loading and unloading changes the microstru-cture. Bending stress and tensile stress, weakening of hook due to wear, plastic deformation due to overloading, and excessive thermal stresses are some of the other reasons for failure. Hence continuous use of crane hooks may increase the magnitude of these stresses and ultimately result in failure of the hook.
3. Methodology of Stress Analysis
The analysis is carried out in two phase: 1) Finite element stress analysis of an approximate (acrylic) model and its verification by photo elasticity theory 2) Analytical analysis assuming hook as a curved beam and its verification using Finite element analysis of the exact hook. To establish the finite element procedure a virtual model similar to the acrylic mode is prepared in ANSYS and the results of stress analysis are cross checked with that of photo elasticity. After establishing the procedure a virtual model similar to actual crane hook sample is created using CAD software and the results of finite element analysis are now verified with that of analytical method.
4. Finite Element Analysis (FEA)
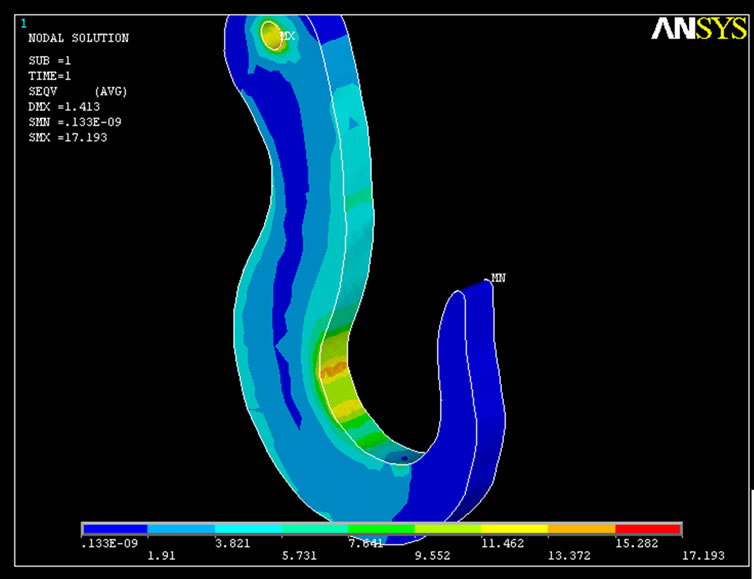
Finite element method [9,10] has become a powerful tool for numerical solution of a wide range of engineering problems. For the stress analysis of the acrylic model of crane hook the outer geometry or profile of the model is drawn in ANSYS 11.0. It is then extruded to 9.885 mm to form a 3-D model of hook. Here 9.885 is the average thickness of the model. Material properties and element type are fed and the model is meshed using smart size option with the global size of the element as 3. Loading and constraint are applied to the meshed model as shown in the Figure 1 and the finite element model is then solved. Principal stress and von mises stress patterns are thus obtained as shown in Figure 2.
5. Theory of Photo Elasticity
For the verification of the results obtained from FEM, the experimentation is conducted using the concept of photo elasticity. The concept is used to determine stress distribution and stress concentration factors in irregular geometries. The method is based on the property of birefringence, which is exhibited by certain transparent materials. Birefringence is a property by virtue of which a ray of light passing through a birefringent material experiences two refractive indices. Thus, a crane hook model made out of such material is selected for the.
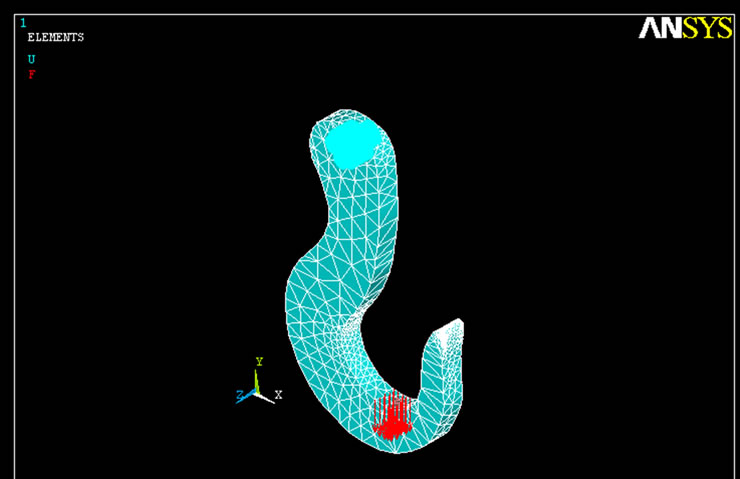
Figure 1. Meshed constraint model.
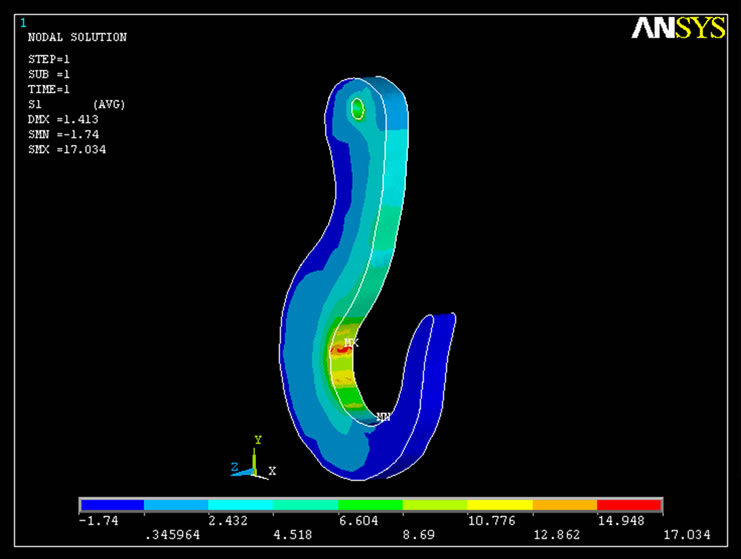
Figure 2. Principle stresses in the model.
study. The model has geometry similar to that of the structure on which stress analysis is to be performed. This ensures that the state of stress in the model is similar to that of the structure.
5.1. Stress Optic Law
When plane polarized light passes through a photo elastic material, it resolves along the two principal stress directions and each of these components experiences different refractive indices [11]. The difference in the refractive indices leads to a relative phase retardation between the two component waves. The magnitude of the relative retardation is given by the stress optic law:
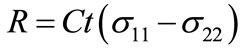
where R is the induced retardation, C is the stress optic coefficient, t is the specimen thickness, σ11 is the first principal stress, and σ22 is the second principal stress.
The two waves are then brought together in a polariscope set up. Thus, the state of stress at various points in the material can be determined by studying the fringe pattern.
Calibration of disc is done to find the material fringe value fσ. An acrylic model of disc is taken and subjected to compressive load in the circular polariscope setup. Figure 3 shows fringe pattern on a loaded disc. Values of loads are noted down for various fringe orders
Using the formula fσ = 8P/πDN = 11.15
where P = Load applied at particular fringe value,
N = Fringe order at corresponding load
D = diameter of the disc = 7.01 cm
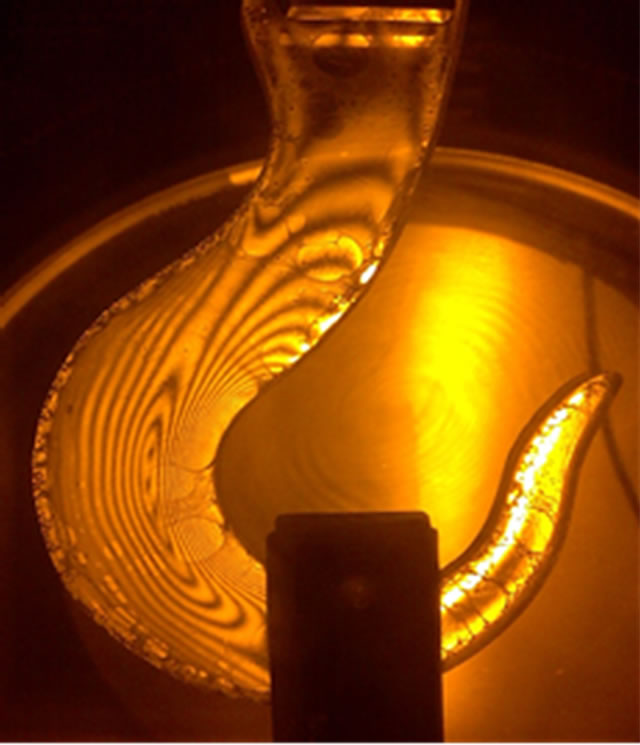
Figure 3. stress pattern of photo elastic model under sodium light.
Stress magnitude at a point is given by: (σ1 – σ2)/2 = N fσ/t
where σ1 = major principal stress, σ2 = minor principal stress, t = thickness of hook.
6. Results
For the approximate model of crane hook, stresses induced during finite element analysis are compared with that of photo elasticity experiment. For the acrylic model of crane hook the results are as under:
ANSYS v/s Experimental
As shown in Figure 4, maximum principal stress
 (a)
(a)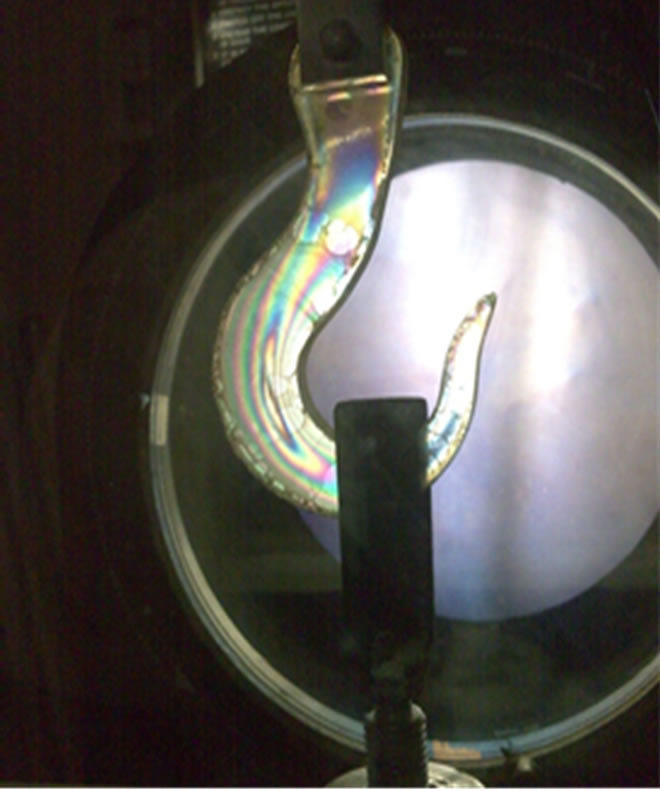 (b)
(b)
Figure 4. Stress distribution pattern for acrylic model (a) Using fem; (b) Using photo-elasticity.
value obtained from ANSYS = 12.35 N/mm2 while that obtained experimentally = 11.121 N/mm2. The results are closely in agreement with a very small percentage error = 5.76%.
Possible reasons for variation might be due to the fact that it is difficult to find the magnitude of stress exactly on the plane of the fringe closest to inner surface and thus the value 12.35 may not be accurate. Figure 5 shows the exact location of maximum stress on the approximate model of crane hook as obtained from ANSYS software.
The above results confirm that the FEA procedure is well established and can be used for complex and accurate models also. Hence in the second phase of the study, analytical calculations are carried out for the exact model of crane hook and the results are validated from that of ANSYS.
7. Analytical Method
Since the crane hook is a curved beam [12], simple theory of bending for shallow, straight beam does not yield accurate results. Stress distribution across the depth of such beam, subjected to pure bending, is non linear (to be precise, hyperbolic) and the position of the neutral surface is displaced from the centroidal surface towards the centre of curvature. In case of hooks as shown in Figure 6, the members are not slender but rather have a sharp curve and their cross-sectional dimensions are large compared to their radius of curvature.
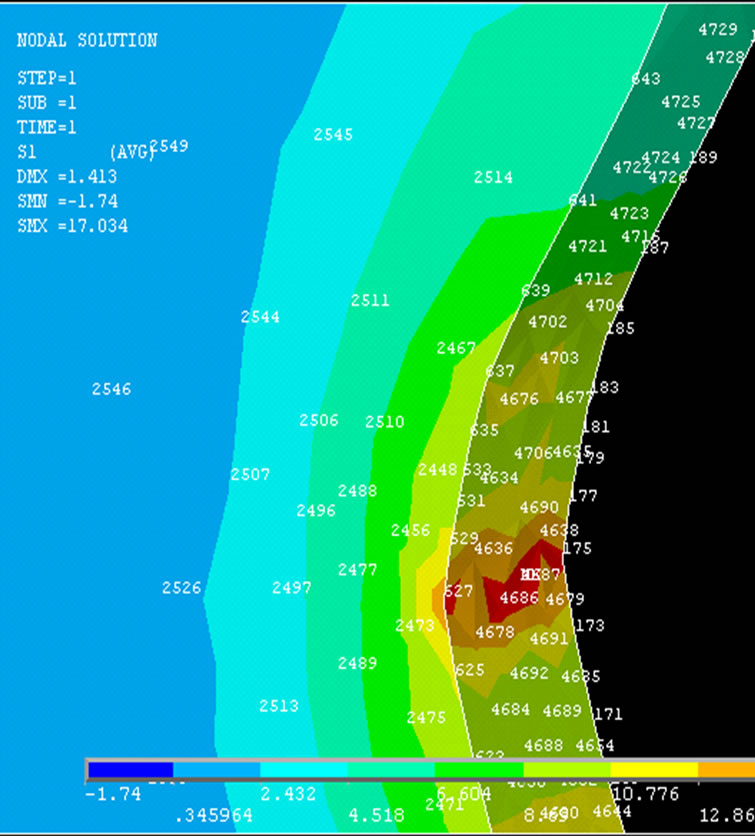
Figure 5. Variations due to limitations.
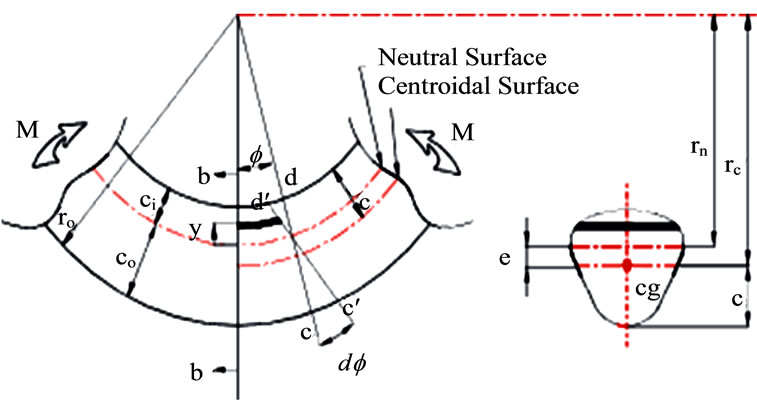
Figure 6. Curved beam with its cross section area.
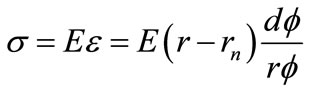
The strain at a radius r =
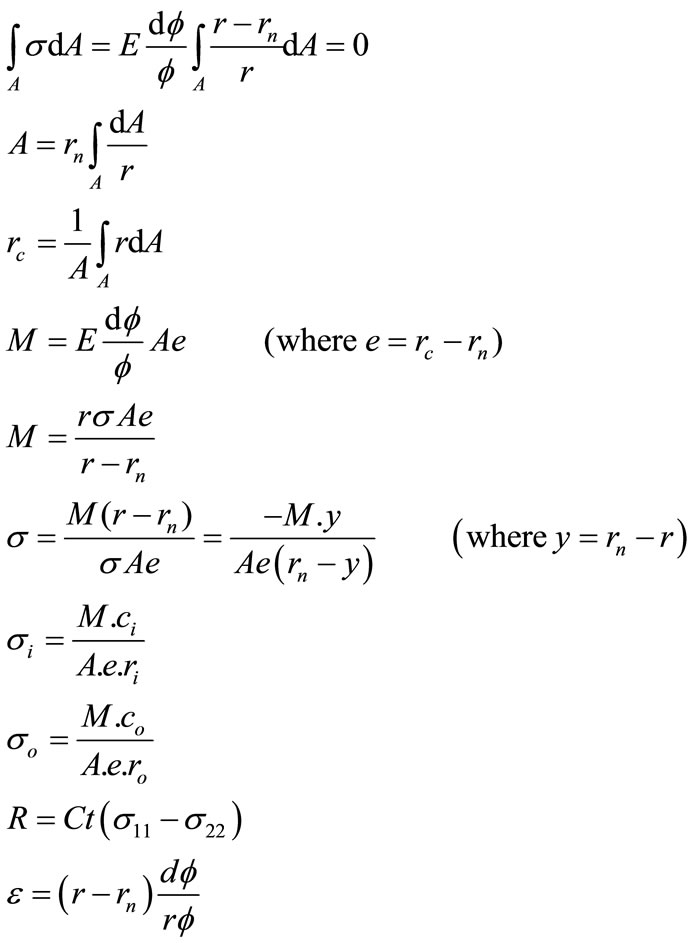
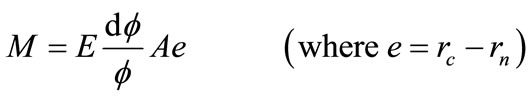
The strain is clearly zero at the neutral axis and is maximum at the outer radius of the beam. Using the relationship of stress/strain = E, the normal stress is simply.
The location of the neutral axis is obtained by equating the product of the normal stress and the area elements over the whole area to 0
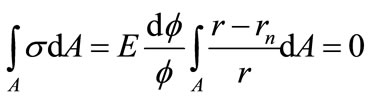
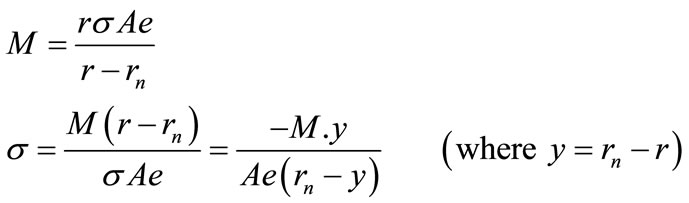
reduces to
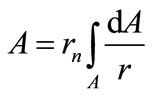

ThereforeThe stress resulting from an applied bending moment is derived from the fact, that the resisting moment is simply the integral of the product of moment arm over whole section from the neutral axis and σdA. The maximum stress occurs at either the inner or outer surface.
The centroid of the section is
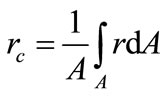
Therefore,
The maximum stress occurs at either the inner or outer surface:
Stress at inner surface
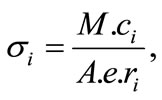
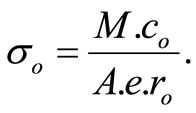
Stress at outer surface
The curved beam flexure formula is in reasonable agreement for beams with a ratio of curvature to beam depth (rc/h) > 5 (rectangular section). As this ratio increases, the difference between the maximum stress calculated by curved beam formula and the normal beam formula reduces. The above equations are valid for pure bending. In case of crane hooks, the bending moment is due to forces acting on one side of the section under consideration. For calculations the area of cross section is assumed to be trapezoidal [13]. Values of stresses as shown in Figure 7 are found out at the A-A section as it is the section where maximum stress is induced.
8. Finite Element Method for the Exact Model
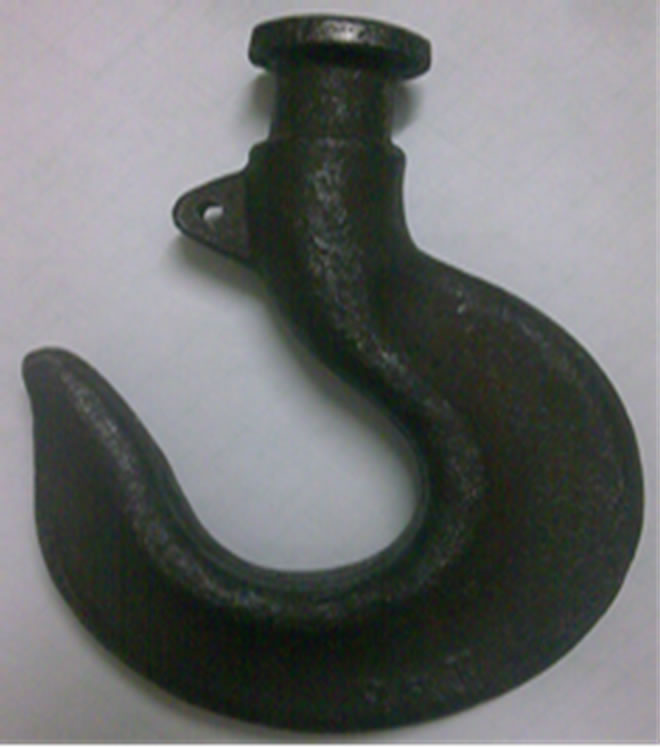
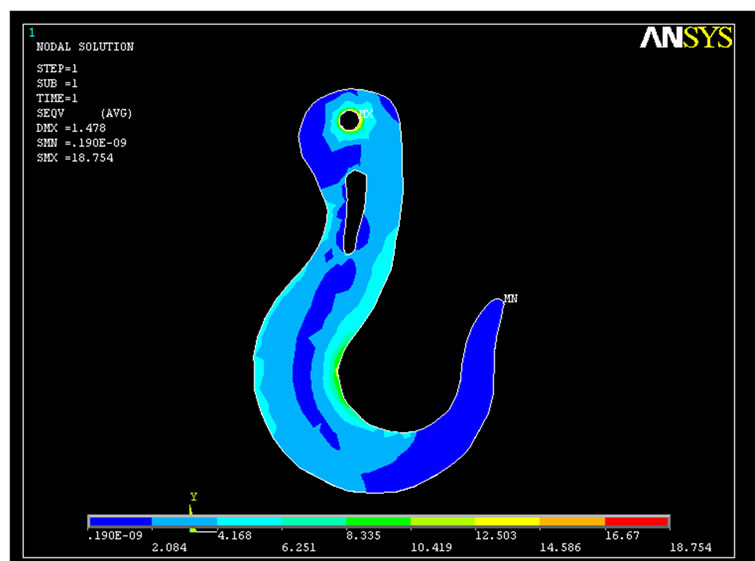
A crane hook prepared by forging, as shown in Figure 8(a), is procured for the modeling in ANSYS software. Using digital Coordinate Measuring Machine (CMM) the cloud points are obtained and the model is prepared in
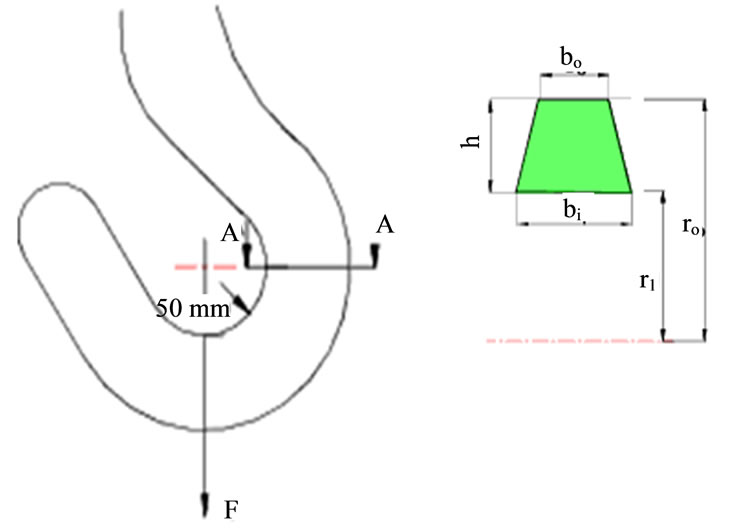
Figure 7. Analysis of crane hook.
Pro-E software. The virtual model prepared in Pro-E software is imported in ANSYS environment. Following the steps of FEM as discussed earlier the stress analysis is conducted for the actual model in ANSYS environment and the results are obtained. Figure 8(b) shows the magnitude and location of stress.
9. Results
The induced stresses as obtained from analytical calculations, explained in the Section 7, are compared with results obtained by FEA software.
ANSYS v/s analytical
Max value obtained analytically=12.35 N/mm2 while value obtained from ANSYS = 13.372 N/mm2
The results are in close harmony with a small percentage error = (13.372 – 12.35)/12.35 = 8.26%
Possible reasons for variation might be the due to the assumption that 1) Loading is considered as point loading in analytical calculation while it is taken on a bunch of nodes in ANSYS. 2) Cross sectional area is assumed to be trapezoidal and 3) Plane sections remain plane after deformation.
Using analytical calculations the stress variation yields the results as shown in Figure 9.
Maximum tensile stress is 150.72 N/mm2 on the inner surface of the crane hook and on the outer surface of the hook, compressive stress is 44.23 N/mm2. As shown in Figure 9, the stress goes on decreasing from a max value to zero and again increases from zero to a certain value.
Innermost point of section:
• Max stress by ANSYS= 135.46 N/mm2; Max stress analytically= 150.72 N/mm2
• % error= (150.72 – 135.46)/135.46 = 10.12%
• Outermost point of A-A section:
• Stress by ANSYS= 43.728 N/mm2; Stress analytically = 44.23 N/mm2;
• % error = (44.23 – 43.728)/43.728 = 1.01 %
 (a)
(a)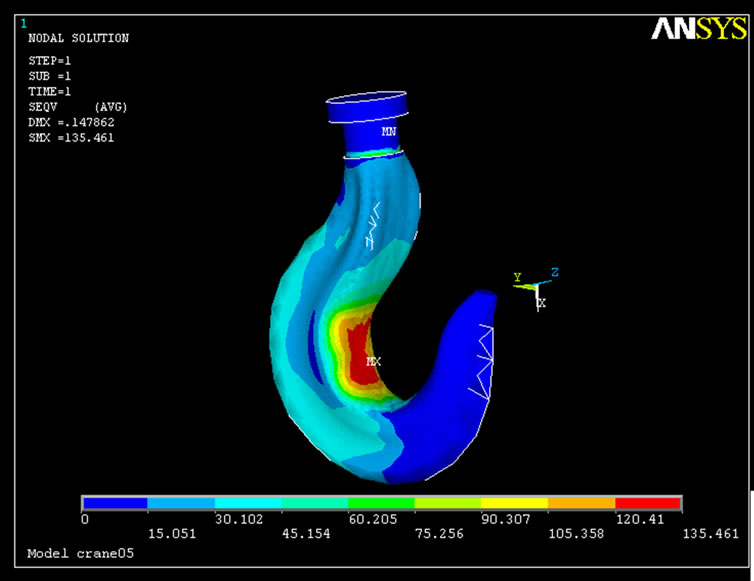 (b)
(b)
Figure 8. (a) Actual crane hook; (b) Stresses obtained using fem.
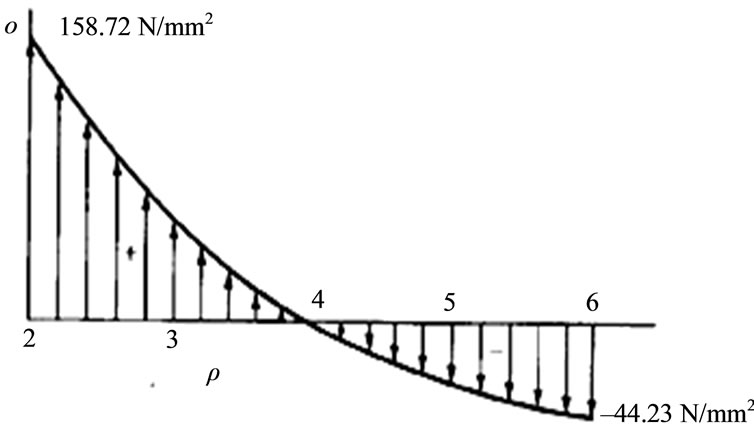
Figure 9. Variation of Stress with depth for the actual model.
• Reasons for variation:
Various assumptions made during the analytical calculations (discussed earlier).
Profile of the hook obtained from Pro-E Modeling software may not be exactly the same as actual one.
10. Conclusions
The complete study is an initiative to establish a FEA procedure, by validating the results, for the measurement of stresses. For reducing the failures of hooks the estimation of stresses, their magnitudes and possible locations are very important. Analytical calculation becomes complex as the newer designs are too complicated.
Suggestions to reduce failure
Manufacturing process: Forging is preferred to casting as the crane hooks produced from forging are much stronger than that produced by casting. The reason been in casting the molten metal when solidifies, it has some
 (a)
(a)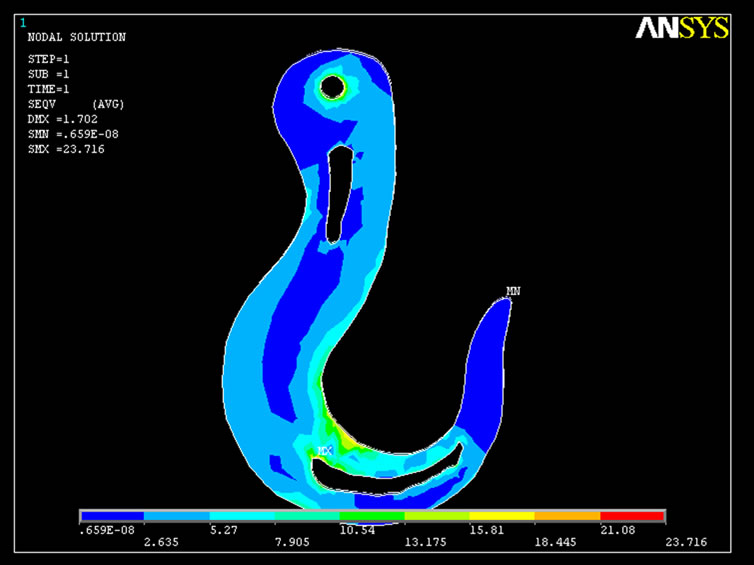 (b)
(b)
Figure 10. (a) Hook with Material Removed; (b) Hook with Material Removed.
residual stresses due to non uniform solidification. Thus casted crane hooks cannot bear high tensile loads.
Grain size: The stress bearing capacity depends on the homogeneity of the material i.e. the relative sizes of the grains in various areas of the component. Smaller the grain size better is the stress bearing capacity. So grain refinement process such as normalizing is advisable after forging.
Processes such as welding should be avoided as they increase the stress concentration points which eventually lead to failure.
Removal of metal from the hook body is not feasible as it increases the amount of stresses in the hook. This is validated by the following illustration:
It is clear from the Figure 10(a) that removal of a small amount of material from minimum stress concentration areas increases the stress slightly though reducing the cost of material.
The Figure 10(b) validates the fact that when considerable amount of material is removed stresses increase by a good enough margin which is not at all feasible.
Design improvement: From the stress analysis we have observed the cross section of max stress area. If the area on the inner side of the hook at the portion of max stress is widened then the stresses will get reduced. Analytically if the thickness is increased by 3 mm, stresses are reduced by 17%. Thus the design can be modified by increasing the thickness on the inner curvature so that the chances of failure are reduced considerably.
11. REFERENCES
- ASME Standard B30.2, “Overhead Gantry Cranes (Top Running Bridge, Single or Multiple Girder, Top Running Trolley Hoist),” 2005.
- ASME Standard B30.9, “Slings Safety Standard for Cableways, Cranes, Derricks, Hoists, Hooks, Jacks and Slings,” 2006.
- ASME Standard B30.10, “Hooks Safety Standard for Cableways, Cranes, Derricks, Hoists, Hooks, Jacks and Slings,” 2009.
- Department of Labour of New Zealand, “Approved Code of Practice for Cranes,” 3rd Edition, 2009.
- B. Ross, B. McDonald and S. E. V. Saraf, “Big Blue Goes Down. The Miller Park Crane Accident,” Engineering Failure Analysis, Vol. 14, No. 6, 2007 pp. 942-961.
- Fatigue Cycle. http://www.public.iastate.edu/~gkstarns/ME417
- J. Petit, D. L. Davidson and S. Suresh, “Fatigue Crack Growth under Variable Amplitude Loading,” Springer Publisher, New York, 2007.
- Y. Yokoyamal, “Study of the Structural RelaxaTion-Induced Embrittlement of Hypoeutectic Zr–Cu–Al Ternary Bulk Glassy Alloys,” Acta Materialia, Vol. 56, No. 20, 2008 pp. 6097-6108. doi:10.1016/j.actamat.2008.08.026
- S. S. Bhavikatti, “Finite Element Analysis,” New Age International, New Delhi, 2007.
- P. Seshu, “Textbook of Finite Element Analysis,” PHI Learning Pvt. Ltd., New Delhi, 2004
- J. W. Dally and W. F. Riley, “Experimental Stress Analysis,” Springer Publisher, New York, 1993.
- Curved Beam Analysis. http://www.roymech.co.uk/Useful_Tables/Beams/Curved_beams.html
- H. A. Rothbart, “Mechanical Design Handbook: Measurement, Analysis, and Control of Dynamic Systems,” McGraw-Hill, Columbus, 2006.
Nomenclature
σ = normal stress; ε = strain; E = Modulus of Elasticity; A = area of whole section; e = eccentricity; M = Bending Moment; y = distance from neutral axis; co = distance of neutral axis from outer surface; ci = distance of neutral axis from inner surface; r = radius of curvature at any distance
rn = radius of curvature at neutral axis; rc = radius of curvature at centroidal axis; ro = radius at the outer surface; ri = radius at the inner surface