Engineering
Vol. 3 No. 4 (2011) , Article ID: 4599 , 4 pages DOI:10.4236/eng.2011.34044
Experimental Study on Indoor Thermal Stratification in Large Space by under Floor Air Distribution System (UFAD) in Summer
1University of Shanghai for Science and Technology, Shanghai, China
2Shanghai University of Engineering Science, Shanghai, China
E-mail: wangxinshiyun@126.com
Received December 27, 2010; revised January 13, 2011; accepted March 23, 2011
Keywords: UFAD system, thermal stratification, temperature gradient, large space, control parameter
ABSTRACT
A ventilation method of down-supply up-return has grown popular in large space in recent years for comfort ventilation with low thermal load, especially in China, including gymnasium, factory space, and exhibition hall, etc. The undisturbed flow pattern in the space gives a gradient in temperature, and the vertical thermal stratification appears markedly in large space. The object for this paper is to understand the behaviour of an under floor air distribution system in a ventilated space. The thermal stratification characteristics in a real UFAD experimental space were measured. The effects of different supply conditions on the thermal stratification characteristics are investigated based on the experimental results. The relations between space air stratification and the control parameter is predicted. It can be indicated that there are 4 zones composing the vertical thermal stratification. And different zone has different control parameter.
1. Introduction
A ventilation method of down-supply up-return has become popular in large space in recent years, especially in China [1], including gymnasium, factory space, and exhibition hall. Cool air with low velocity in this ventilation system is introduced at the lower part of the space and spreads out above the floor. Compared to the traditional mixing ventilation, this underfloor air distribution system has the possibilities of creating both high temperature effectiveness and high-ventilation effectiveness. The undisturbed flow pattern in the space gives a gradient in temperature, and the vertical thermal stratification appears markedly in large space. The temperature gradient is always positive, increasing temperature up to the ceiling, which is at a higher temperature than the floor.
As floor-to-ceiling air flow pattern results in thermal stratification, space cooling load is reduced. Many studies have been devoted to analyzing energy use of UFAD systems [2-5]. However, thermal stratification is a also very important issue for energy saving, and the control of the air stratification is critical to the design and operation of UFAD systems. Increasing stratification may save energy, while decreasing stratification may improve occupant comfort.
In [3], the temperature gradient is of great interest as a person does not like to be exposed to large temperature differences between the feet and the head. This difference has a maximum of 3˚C, but it is often said that this is excessive and that 2˚C is more likely to be a comfort limit. This puts a restraint on the use of displacement ventilation. When the cooling load is high, the amount of air needed to keep the temperature radiant below this limit will be too large and cause problems with air handling and distribution.
Wan and Chao [6] found that the temperature stratifycation in the enclosure with underfloor ventilation systems highly depended on the thermal length scale of the floor supply jets. When the thermal length scale of the floor supply jet was ≥1, temperature stratification was minor for all tested heat densities and air distribution methods. Significant vertical temperature gradients occurred when the jet thermal length scale was ≤1.
Hunt and Cooper [7] developed a simplified model of an UFAD system consisting of a single source of heat and a single cooling diffuser in a ventilation space. This study shows that the control parameters on the thermal stratification are the buoyancy flux of the heat source, the volume flux and momentum flux of the cooling diffuser.
H. Xing [8] concerned with the difference in the air quality that is perceived by the occupants (breathing zone) and that existing in the occupied zone as a whole. An environmental chamber with displacement ventilation system has been used to carry out the measurements with the presence of a heated mannequin and other heat sources. Measurements of the age of air distribution, the air exchange index and the ventilation effectiveness were carried out at different points in the chamber for different room thermal loads.
Huijuan Xing [9] investigates the relationship between the neutral height for air distribution and the ventilation load in a room with displacement ventilation. An environmental chamber equipped with a displacement ventilation system has been used to carry out the neutral height measurements with the presence of a heated mannequin and other heat sources in the chamber. The total room load used was varied from 104 to 502 W, i.e., corresponding to a ventilation load from 10 to 60 W/m2.
Although a lot of studies have been reported on air flow characteristics in UFAD rooms, insufficient data are available on the quantitative relation between air temperature characteristics and the control parameters. The motivation for this study is to understand the behaviour of an under floor air distribution system in a ventilated room. The air thermal characteristics in a real UFAD experimental space were measured. The effects of different supply conditions on the air thermal characteristics are investigated. Quantitative prediction of the relations between space air stratification and the control parameter is presented.
2. Experiment Summary
2.1. Introduction of the Experiment Space
As shown in Figure 1, experimental space is used to play table tennis in the University of Shanghai for science and technology. There is a typical pitched roof of this building. The top height of the roof is 8.75 m, and the lower point of the roof is 6 m. The space covers an area of 20 × 14.8 square meter. The cooling air is supplied by eight semi-cylindrical supply air outlets of 600 mm diameter, which were laid symmetrically on low-side of the north wall and south wall. The air is either returned by eight return air louvers of 400mm diameter arranged symmetrically at the height of 4.6 m above, or by four 900 × 600 mm return air inlets installed in the west wall.
2.2. Experimental Program
The purpose of the experiment is to measure the indoor vertical temperature distribution and analyze the effects of different supply conditions on the air thermal characteristics. The main test objects are the outdoor climate, vertical temperature distributions, wall temperature, and so on, which were measured by mini-weather station, thermocouples and an infrared camera etc.
Field-measurements of the indoor vertical temperature distribution have been carried out in diffe-rent conditions with UFAD system in 2009, as shown in Table 1. The layout of measuring points is showed in Figure 2.
3. Analysis on Indoor Thermal Characteristics with UFAD System
3.1. Four Zones of the Vertical Thermal Distribution
From the experimental results of the vertical thermal distribution under 6 different testing conditions, 4 zones are considered to compose the vertical thermal stratification. They are: 1) bottom cooler zone; 2) lower narrow zone; 3) transitional zone; and 4) upper warmer zone, shown in Figure 3. The temperature gradient in the bottom cooler zone 1 is relatively unmarked, the temperature gradient in the lower narrow zone 2 is most distinct, the temperature in the zone 2 is changed abruptly and increased linearly in the vertical direction. Zone 3 can be considered as the transitional region between the lower cooler zone and the upper warmer zone. Zone 4 is an unair-conditioned region in the space, and the temperature in the zone 4 is much higher than other zones.
3.2. Effect of Ar on Temperature Gradient of the Bottom Cooler Zone
Ar is a major control parameter for the air temperature, but has little effect on the temperature gradient in the bottom cooler zone, shown in Figure 4. In the experimental space, the maximal temperature difference under the height of 1.3 m is only 0.39˚C with different Ar values, which indicates that the temperature distribution in the bottom cooler zone is relatively uniform. In Figure 4, the temperature values can be increased with Ar decreasing in zone 1. In case 2 and case 6, larger the temperature difference between the supply air and the indoor air, lower the temperature in zone 1. Although the highest supply air velocity of the case 3, but not cooler air temperature of zone 1. From the experimental results, the temperature difference between the supply air and the air temperature of zone 1 has more effect on the air temper-
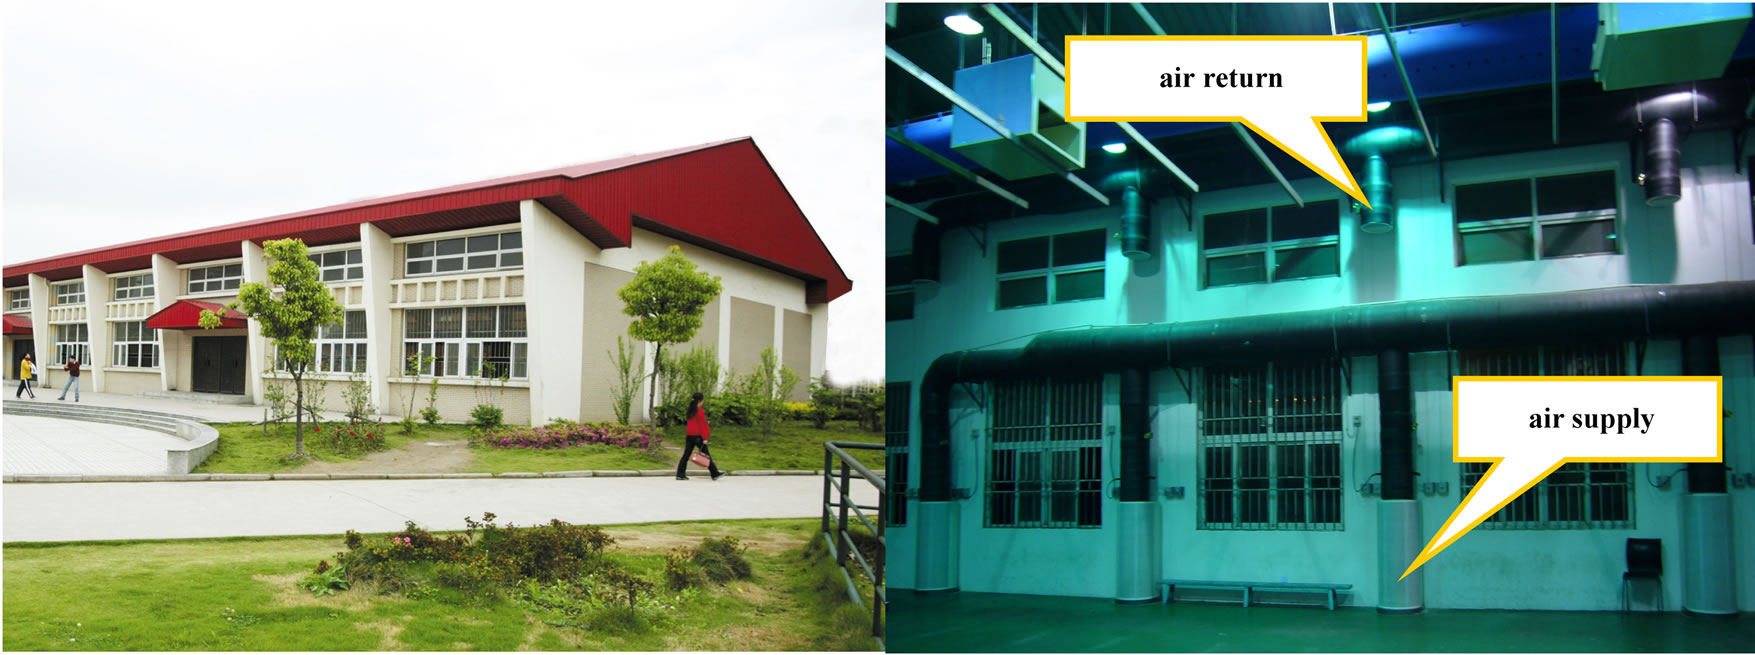
Figure 1. outward appearance and inward mechanical ventilation of the experimental building.

Table 1. different testing conditions.
ature in zone 1, compared to the supply air velocity.
3.3. Effect of Ceiling Temperature on Temperature Gradient of the Upper Warmer Zone
The ceiling temperature is another major control parameter for the air temperature, and also has more evident effect on the temperature gradient of the upper warmer zone, shown in Figure 5. In the experimental space, the upper region above the height of 4.3 m can be considered as the upper warmer zone. The temperature distribution in this zone is mainly caused by the ceiling temperature. Ceiling temperatures of 6 testing cases are shown in Table 1. The ceiling temperature difference between the case4 and the case 5 is 3.70˚C, the average air temperature of the upper warmer zone in the case 5 has an increase of 2.75˚C consequently, but the air temperature of the bottom cooler zone is just increased by 0.85˚C unmarked. The temperature gradient of case4 is 1.64˚C/m, and the temperature gradient of case5 is increased by 49%, 2.45˚C/m, when the ceiling temperature increases. From the experimental data, it can be concluded that the ceiling temperature plays the strong point to the temperature and the temperature gradient of the upper warmer zone, but has little effect on the bottom cooler zone.
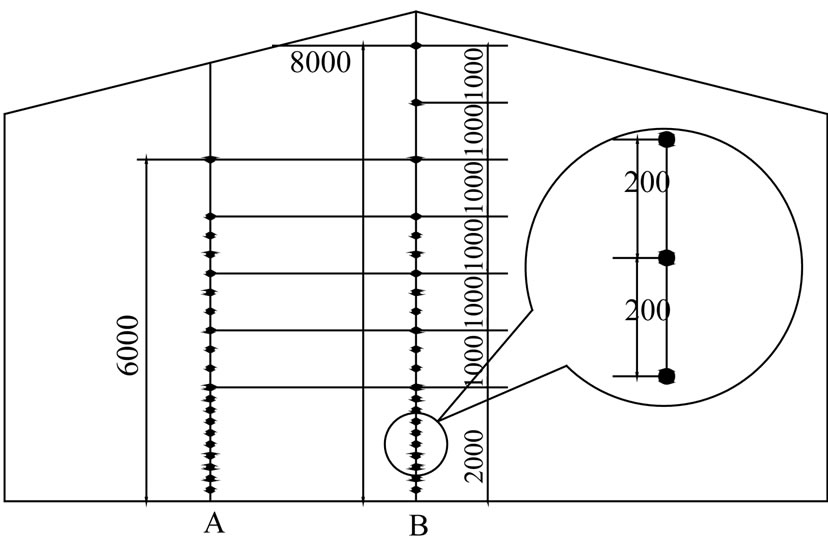
Figure 2. positions of testing points in the experimental space.
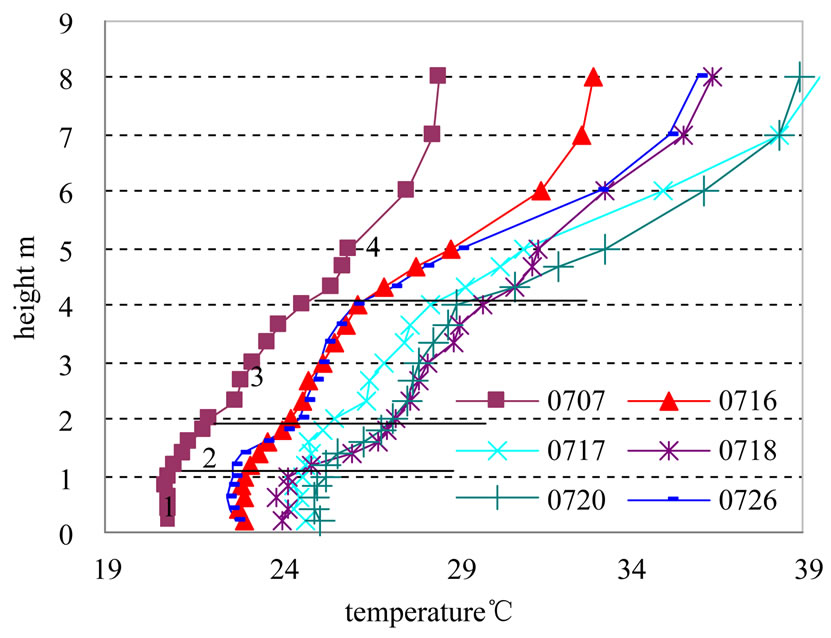
Figure 3. vertical temperature distribution of all cases.

Figure 4. vertical temperature distribution of case 2, case 3 and case 6.
3.4. Effect of Airflow Distribution on the Temperature Gradients of the Lower Narrow Zone and the Transitional Zone
From Figure 6, the experimental results indicate that airflow distribution is the other control parameter for the indoor temperature distribution. In case 6, the cooling air is supplied by eight semi-cylindrical supply air outlets of 600 mm diameter, and returned by eight return air louvers of 400 mm diameter arranged symmetrically at the height of 4.6 m above. And in case 4, the air is returned by four 900 × 600 mm return air inlets installed in the west wall. The airflow distribution of the case 6 is downsupply up-return, and the airflow distribution of the case 4 is down-supply down-return. In Figure 6, the temperature gradients of the bottom cooler zone 1 and the upper warmer zone 4 are similar in case4 and case6. But the temperature gradients of lower narrow zone 2 and transitional zone 3 are evident different. Temperature
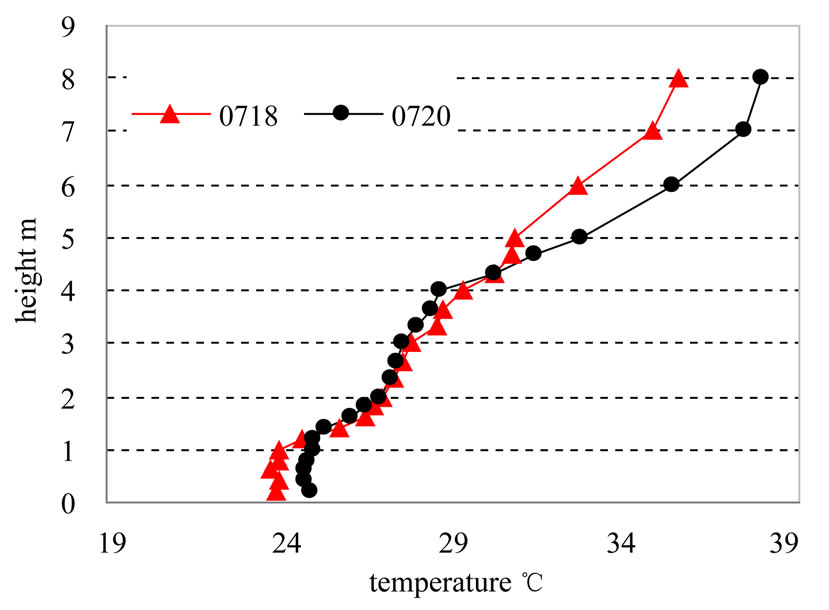
Figure 5. vertical temperature distribution of case 4 and case 5.
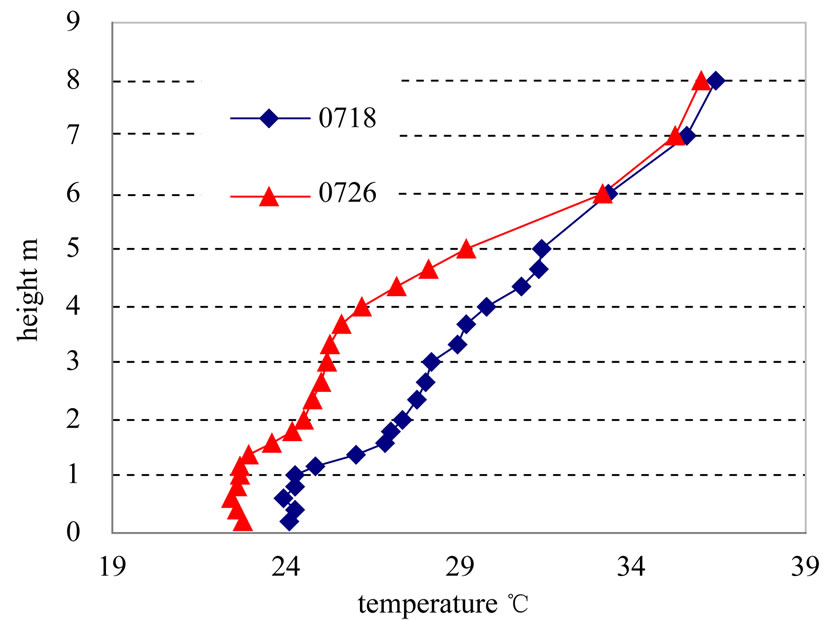
Figure 6. vertical temperature distribution of case 4 and case 6.
gradient difference between case 4 and case 6 is caused by the different airflow distribution.
In case 4, the increase of the temperature value is a slower action, on the contrary, the increase action in case 6 is relatively much sharper caused by the up-return airflow. In case4, the temperature gradient from 1.2 m to 2.0 m is 3.08˚C/m; the temperature gradient in case6 is 2.33˚C/m. In case4, the temperature gradient from 2.0 m to 4.0 m is 1.23˚C/m; the temperature gradient in case 6 is 0.82˚C/m. It can be indicated that the indoor airflow distribution is the other control parameter for the thermal stratification, especially for the lower narrow zone 2 and transitional zone 3.
3.5. Effect of Outside Temperature on Temperature Gradient
Outside temperature is another major control parameter for the indoor air temperature, but has little effect on the
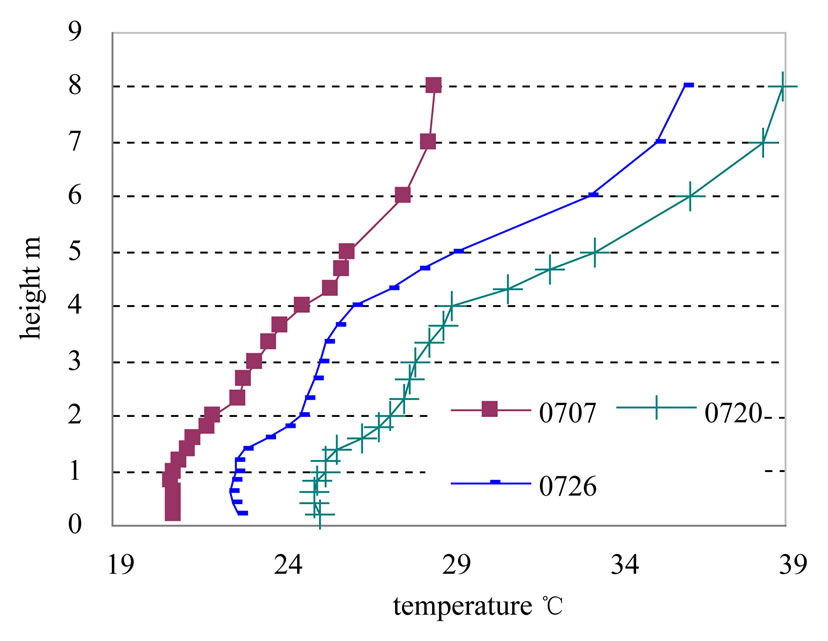
Figure 7. vertical temperature distribution of case 1 case 5 and case 6.
temperature gradient, shown in Figure 7. Outside temperatures and solar radiations of 6 testing cases are shown in Table 1. In Figure 7, the indoor air temperature is increased by the increasing outside temperature, and the indoor vertical temperature gradient is affected slightly. In case 5, the temperature gradient is similar to that of the case 6. The outside temperature of the case1 is similar to that of the case 6, but the solar radiation is much lower. In case1, the temperature gradients of the zone 1, 2 and 3 are similar to these of the case 6, but the temperature gradient of the zone 4 is evidently different due to the lower solar radiation. From the experimental data, it can be concluded that the outside temperature has an evident effect on the indoor vertical temperature, and the temperature gradient of the zone 4 is affect not only by the outside temperature, but also by the solar radiation.
4. Conclusions
The purpose of the experiment is to measure the indoor vertical temperature distribution and analyze the effects of control parameters on the air thermal stratification characteristics. From the experimental results, 4 zones can be considered to compose the vertical thermal stratification. They are: bottom cooler zone 1; lower narrow zone 1; transitional zone 3; and upper warmer zone 4, shown in Figure 3.
The experimental results illuminate that different zone has different control parameter. Temperature difference between the supply air and the air temperature of zone 1 is a control parameter for temperature gradient of the bottom cooler zone 1; ceiling temperature is a control parameter for temperature gradient of the upper warmer zone 4; airflow distribution is a control parameter for the temperature gradients of the lower narrow zone 2 and the transitional zone 3. Outside temperature is another major control parameter for the whole indoor air temperature, but has little effect on the temperature gradient.
5. Acknowledgement
The authors would like to thank the National Natural Science Foundation of China (No. 50478113) and the key project of Shanghai Education Committee (J50502), and “Special Research Fund in Shanghai Colleges and Universities to Select and Train Outstanding Young Teachers (slg09011)” for the support of this research work.
6. REFERENCES
- X. Wu and W. F. Wu, “Review and View on the Research and Application of Displacement,” Buiding Energy & Environment, Vol. 23, No. 5, 2004, pp. 24-29;
- A. Alajmi and W. El-Amber, “Saving Energy by Using Underfloor-Air-Distribution (UFAD) System in Commercial Buildings,” Energy Conversion and Management, Vol. 51, No. 8, 2010, pp. 1637-1642. doi:10.1016/j.enconman.2009.12.040
- IS01984, “International Standard 7730, Moderate Thermal Environments Determination of the PMV and PPD Indices and Specification of the Conditions for Thermal Comfort,” Geneva International Standards Organisation 1984.
- F. S. Bauman, “Heat Transfer Pathways in Underfloor Air Distribution (UFAD) Systems,” ASHRAE Transactions, Vol. 112, 2006, pp. 567-580.
- Q. X. Kong, “Numerical Study on Temperature Stratification in a Room with Underfloor Air Distribution System,” Energy and Buildings, Vol. 40, No. 4, 2008, pp. 495-502. doi:10.1016/j.enbuild.2007.04.008
- M. Wan and C. Chao, “Numerical and Experimental Study of Velocity and Temperature Characteristics in a Ventilated Enclosure with Underfloor Ventilation Systems,” Indoor Air, Vol. 15, No. 5, 2005, pp. 342-355. doi:10.1111/j.1600-0668.2005.00378.x
- G. R. Hunt, P. Cooper and P. F. Linden, “Thermal Stratification Produced by Plumes and Jets in Enclosed Spaces,” Building and Environment, Vol. 36, No. 7, 2001, pp. 871-882. doi:10.1016/S0360-1323(01)00013-0
- H. Xing and A. Hatton, “A Study of the Air Quality in the Breathing Zone in a Room with Displacement Ventilation,” Building and Environment, Vol. 36, No. 7, 2001, pp. 809-820. doi:10.1016/S0360-1323(01)00006-3
- H. J. Xing and H. B. Awbi, “Measurement and Calculation of the Neutral Height in a Room with Displacement Ventilation,” Building and Environment, Vol. 37, No. 10, 2002, pp. 961-967. doi:10.1016/S0360-1323(01)00079-8