Applied Mathematics
Vol.4 No.5A(2013), Article ID:31911,11 pages DOI:10.4236/am.2013.45A010
FEM Study of the Strain Kinematics in the 3D Nanofibrous Structure Prepared by the Electrospinning Process
1Institute for Nanomaterials, Advanced Technologies and Inovation, Technical University of Liberec, Liberec, Czech Republic
2Department of Nonwovens, Technical University of Liberec, Liberec, Czech Republic
3Department of Machine Elements and Mechanism, Technical University of Liberec, Liberec, Czech Republic
Email: michal.petru@tul.cz
Copyright © 2013 Michal Petrů et al. This is an open access article distributed under the Creative Commons Attribution License, which permits unrestricted use, distribution, and reproduction in any medium, provided the original work is properly cited.
Received March 1, 2013; revised April 23, 2013; accepted April 30, 2013
Keywords: FEM; Strain; 3D Nanofibrous Structure; Electrospinning; Gas Flow
ABSTRACT
Finite element model (FEM) was used for the study and description of the arising 3D nanofiber structure strain caused by the pressure of the flowing gas. Computer simulation using an adaptive networking through implicit FEM algorithm can be utilized for a significant improvement of the study of anisotropic strain in the deformed 3D nanostructure. The created model is based on the empirical Laplace-Poisson differential equation for the flow, where gas particles are moving with certain kinetic energy. The kinetic energy depends on the speed, time and temperature and affects the resulting strain of 3D nanofiber structure. The simulation results were compared to the results obtained from the image analysis of real samples and showed that this FEM model can determine individual phases of structure strain. The comparison shows that the developed FEM model can be an important tool in the study of the strain in the arising 3D nanofiber structure and it can provide valuable information for optimization of 3D nanofiber structure production by the electrospinning process.
1. Introduction
The production of nanofibers became the center of interest of the many research departments in the last decade. Even though this principle is known for a long time, the first patent of A. Formhals was published in 1934 [1]; this process has not been mastered in terms of productivity for a long time. The turning point was brought by the new method of electrospinning—NanospiderTM principle, which significantly increased the process productivity. Simultaneously with the development of the nanofiber preparation technology the applications of nanofiber layers were also developed. The nanofiber layers are characterized by the almost isotropic arrangement, the contact points are linked with straightened fibers. The distance among the fiber contacts in the surface of fabric is relatively large, but the distance of each layer, which can be viewed and distinguished in the cross section of nanofiber material is relatively low. Consequently, the fiber layer is relatively compact and has a large specific density. There are procedures that can change the arrangement of nanofibers in the layer. In [2] authors describe the finite element method (FEM) model of four different collectors for the preparation of the desired structures, including required alignment of the fibers. The simulation was performed and analyzed in the Ansys Maxwell 3d. Also the analysis of two fibers was accomplished. The results can be used for optimization of the fiber structure by the help of different arrangement of collectors. In [3] the simulation of electrostatic field of coil, which is used for needless electrospinning from the liquid surface is described. The dependencies of distance between the coil winding and electrical intensity are calculated. The simulation is used for optimization of the coil design. The Comsol 3.5 software was used for simulation in this study. Authors in the article [4] focused on preparation of nanofibers from polypropylene. They irradiated the material with laser beam when passing through jet with supersonic flow of the air. The work includes FEM simulation of the jet formed from three different orifices in ANSYS CFZ 11.0. The simulation shows the distribution of air velocities, which is very important for the creation of nanofibers. In the [5] authors describe the simulation of electrical field distribution in process of bubble electrospinning. In this method Taylor cones can be created more easily by the help of pressured gas which flows through the electrospun liquid. Taylor cones are created directly on the bubbles. For better understanding an electrical field distribution around the bubble was computed. The simulation was performed in the of ANSYS 11.0. Above mentioned simulations are dealing with the flow of the gas or by the shape of electrical field. In this article an increase of thickness was simulated as combination of gas flow from jet through the porous layer of nanofiber structure together with the influence of electrostatic forces. These processes were causing the change in the fiber orientation in the planar layer. The orientation of fibers perpendicular to the plane determined the bulkiness, porosity and mechanical properties such as stiffness, flexibility, compressibility, and especially permeability. This paper describes a modified electrospinning technology, which allows controlling the change of the layer bulkiness. The process modification consists in the utilization of the additional gas flowing perpendicularly to the surface of fabric and expanding the formed layer. Understanding this process is very important for the control of the obtained layer properties. The process of nanofibrous layer creation was described by FEM model. The input parameters of the process were represented by the real mechanical properties of formed layers and properties of the applied flow. The influence of the surrounding environment is also taken into account. FEM simulation is very practical tool during the study of complex phenomena, especially in the optimization, because it can also help to build the corresponding analytical models [6-9]. During the preparation of the FEM model, the suitable assembly was also solved. The part representing the geometry of the electrode and the nozzle can be considered as a macrostructure, whereas the fiber part composed of nanofibers can be considered as a micro, respectively nano-structure. This should correspond to the dimensions of the finite mesh. In the case of nanofiber mesh the elements should not be larger than 20 nm. For given dimension of model geometry represents millions of elements. For connection of fine mesh with macrostructure, this macrostructure has to have similarly sized elements. Fine mesh of macrostructure would lead to ten millions elements and a failure of the calculation. In the case of the coarse mesh of macrostructure singularity occurs in connections. Therefore, the continuum model instead of the structural model was chosen for the description of the flow in nanostructure. Similar models of flow were described and applied, but not for the flow in the 3D nanostructure.
2. Background: Study of 3D Nanostructure Strain
2.1. Experimental Analysis
Strain study of the 3D nanofiber layer creation have been carried out on the basis of real experiment [10] in the experimental electrospinning device NanoLabTM (Figure 1). The polymer solution of polyamide 6 (PA6) with a concentration of a 12% of acetic acid was used for the electrospinning. The process was carried out at a temperature , humidity 30% and potential gradient of electrostatic field 75 kV and 0,084 mA. Strain in the formed 3D nanofibrous structures is caused by the pressure of applied gas flow that passes through nozzles in the negative electrode (collector), acting in the opposite direction to the nanofibre collection.
The principle is schematically shown in Figure 2. Reorganization of nanofiber layers is caused by the movement of the gas flow. The flow can be characterized by pressure and velocity. In the presented experiment three different gases were used. The flow rate of the individual gases was changed, because of the different specific densities, but output pressure was kept constant. Constant output pressure results in the equivalent deformation of the structure.
The parameters of the flowing media are shown in Table 1. The character of the resulting strain is shown in
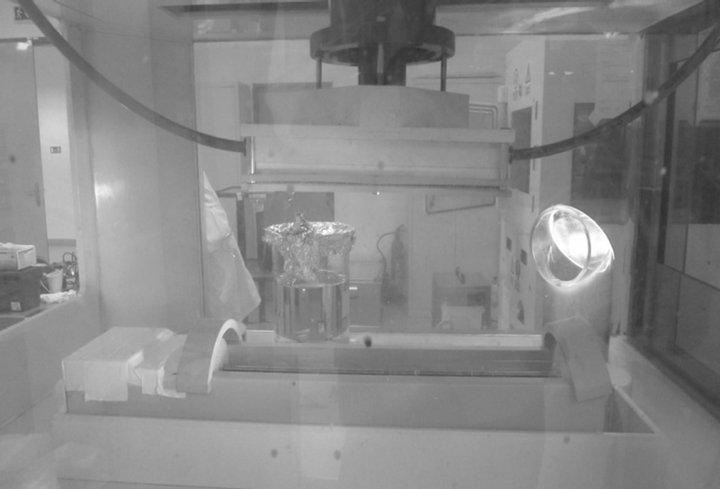
Figure 1. Experiment: Measurements are carried out on the NanoLabTM device.
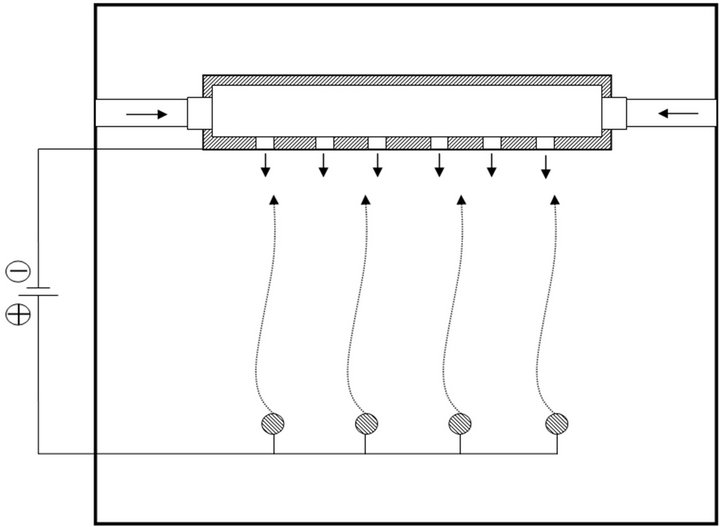
Figure 2. Principle of the electrostatic spinning.
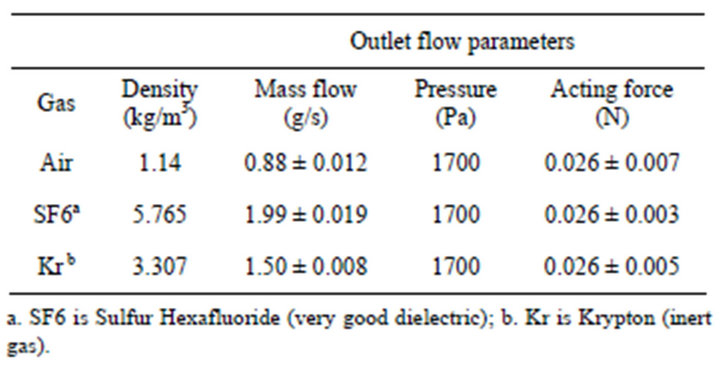
Table 1. Paremeters of the gass flow.
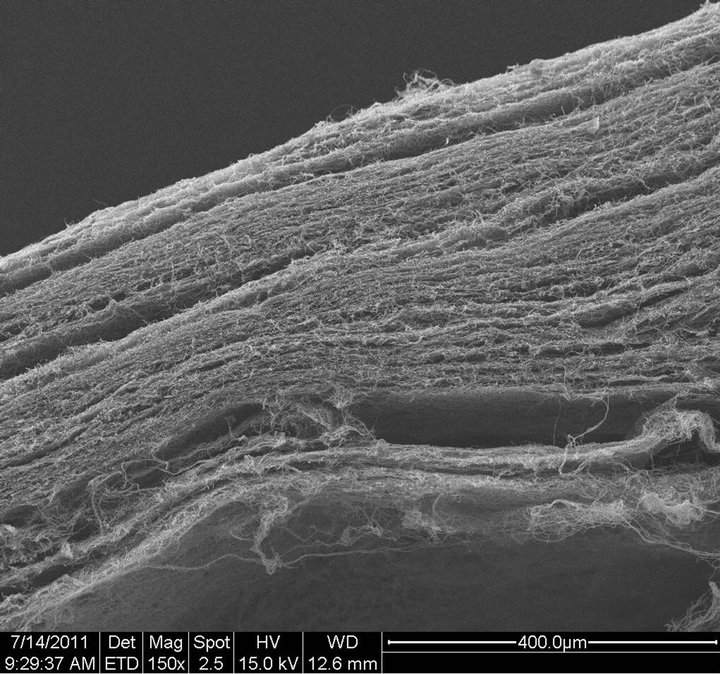
Figure 3. It is shown that acting flow of gas results in regularly wrinkled structure. The gas penetrates and extends layers not only in places of nozzles, but also outside of them because the gas flows also in pores of arising nanofiber layer.
2.2. Governing Equations
Analytical description of the strain distribution in the 3D nanostructure at a given potential and the intensity of the electrostatic field during electrospinning from the strings is very difficult and practically immeasurable. It cannot be treated as the study of the structural deformation [11], but the prediction and theoretical approach it is necessary for the optimization of the process. Therefore, practically the only way how to approximate the strain in the formed 3D nanostructures is by the discrete numerical methods such as FEM. Appropriate model should mainly reflect the studied area. Therefore, it is possible to ignore or simplify the boundary conditions of those model areas, which are not important for direct investigation of the strain. The process of electrospinning is mainly affected by the distribution of the electric field intensity. The intensity can be generally defined as a limit of the force per unit charge according to Equation (1), or through the applied potential gradient at the electrode according to Equation (2).
 . (1)
. (1)
 . (2)
. (2)
where E expresses the electric field, F is acting force, q is unit charge.  is potential, which can be expressed for jth charge as
 , where ε0 is relative permittivity of vacuum
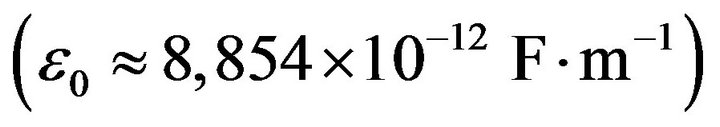 .
.
The flow affecting the resulting nanostructure, especially the geometrical and mechanical properties, can be generally described by the diffusion Laplace-Poisson differential Equation for 2D task (Equation (3)) or in modified form (Equation (4)).
 (a)
(a)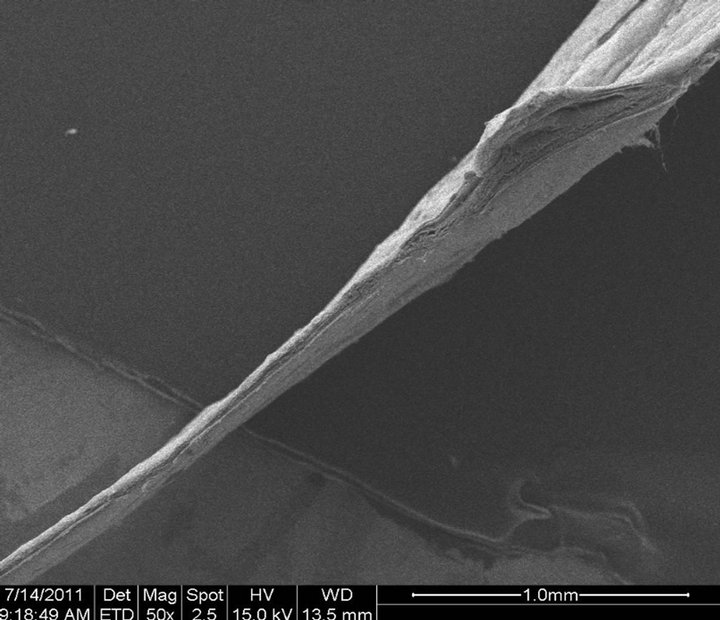 (b)
(b) (c)
(c)
Figure 3. Structure of 3D nanofiber strain caused by the flowing gas: (a) Initiation of structure compression by the flowing air (t > t0, gas flow from nozzle); (b) Final state of compression (tmax = t); (c) Detail of nanofiber structure deformation, where characteristic sinusoidal shape is seen.
 . (3)
. (3)
 . (4)
. (4)
where  is an unknown function describing the nonstationary pressure p, t is time, α, β are material constants of the medium (gas).
Equation (4) is met at each point of the studied area ,
,  with the initial condition that defines the initial value or distribution function
  at time
 . The border Γ of area Ω will be divided into two parts
 , because it is necessary to define the appropriate boundary conditions for the inlet and outlet of medium. Important boundary conditions, which are necessary to be defined in the model, are described by the Equation (5)-(6).
Where Equation (6) expresses [12], Fourier’s law of flow media intensity  on the border with the outer normal
![]() .
.
 , on the part of border
 , (5)
, (5)
 , on the part of border
 , (6)
, (6)
where is the intensity of a function ![]() in a certain time
in a certain time ,
, ![]() is the normal vector towards outward from the
is the normal vector towards outward from the ,
,  is intensity of the flowing gas.
The propagation of the structure transformation is unobservable. We must rely only on the image analysis of the final deformed structures. Therefore the simulation cannot be processed similarly as in the case of strains of other complicated structures. An example of the standard simulation is utilization of the Levenberg-Marquart algorithm [13,14]. During the compression of formed 3D nanostructures it is evident that the individual layers are strained similarly to the porous structure of the compact soil. Therefore it is possible to imagine that such structure could behave in the accordance with the WinklerPasternak model [15-17], which is generally used for the description of a loading of porous structures such as dust, soil, clay, and other structures. Thus the WinklerPasternak model can approximate the strains by the Equation (7).
 . (7)
. (7)
where  is the surface load applied to the 3D nanostructure,
  are constants of Winkler-Pasternak model and
 ![]() describes deflection.
describes deflection.
 (8)
(8)
 (9)
(9)
2.3. Solution of the Problem: Finite Element Method
The relations (1-7) can be directly applied to build Equations for the 2D arrangement of the finite element method, where especially the Galerkin method can be used for this purpose. This method in the described problem gives almost the same results compared to the Ritz method [18,19]. Equation (3) can then be expressed by Equation (8).To build Finite element method simulation (FEM) the first integral of Equation (8) can be modified by the Gauss theorem. After this operation the Equation (9) is in the form.
On the part of border  the boundary condition of the Equation (5) is defined
 . In FEM the function
 ![]() is approximated by each element of the structure of finite element mesh according to the Equation (10).
is approximated by each element of the structure of finite element mesh according to the Equation (10).
 (10)
(10)
where  is a row matrix of the base functions,
  is a column matrix of nodal values of the function
![]() .
.
In conclusion, the basic shape of the first order differential equation by Equation (11) is obtained.
 . (11)
where members  can be expressed by the Equation (12).
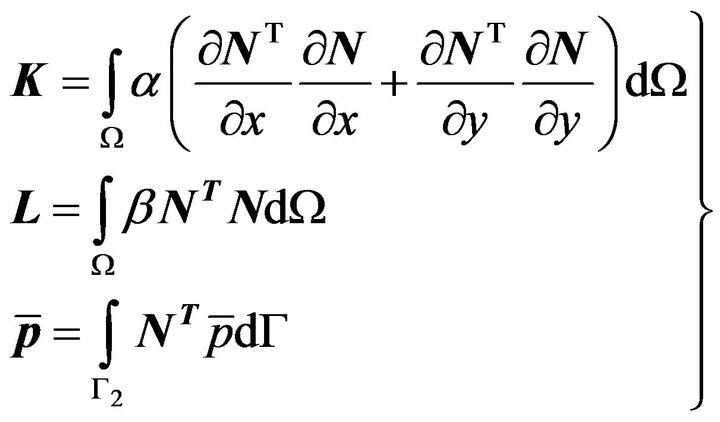 (12)
(12)
Then the Equation (7) which approaches the description of strains using Winkler-Pasternak model can be expressed by using the functional Equation (13).
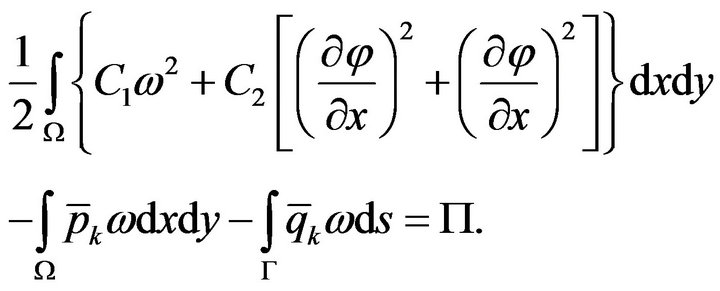 (13)
(13)
where  expresses the force boundary condition. In the case of the flowing medium it is a geometrical boundary condition.
3. FEM Model of 3D Nanostructure Strain
FEM Model Description
FEM model was created in the COMSOL Multi-physics software (Figure 4), which allows the modeling of electric fields, flow in piezomaterials, compression of isotropic and anisotropic materials and other physical phenomenon. This software contains a wide variety of tools for simulation of the various problems, which are described by partial differential equations. This allows the modeling of the vector distribution of momentum of strained nanostructures on the basis of the previous equations. Comsol uses for the calculation the implicit algorithm, where individual states of the analyzed compression are updated gradually in time t to time  according to Equation (14). Physical parameters of the FEM model are seen in Table 2.
 (14)
(14)
where  is vector of nodal displacements for ith iteration in the time
 .
.
Results are influenced by initial and boundary conditions, which are complicated, mainly due to the motion of the gas from the negative electrode towards the nanostructure. Therefore it is important to capture the immediate effect of the air stream with pressure of 1700 Pa and acting force 0.026 N flowing from the nozzle with diameter 1 mm through nanostructure. Surface 2D model with the real dimensional geometry of the fibrous nanostructure was assembled. In the simulation of such process suffers of the problem with the solution convergence. Despite very sophisticated methods of Gauss elimination, the finite solution may iterate with unacceptable error of solution. Therefore it is convenient to use appropriate construction of finite elements with respect to geometry, initial and boundary conditions, etc. already during design of model. For this purpose e.g. the adaptive network can be used Figure 5(a) and Table 3. The aim is to minimize the resulting residues defined by Equation (15) to an acceptable level by an appropriate number of iterations already at the beginning of the calculation. Sometimes, when using adaptive techniques, the critical part is significantly refined, but the stiffness matrix is weakly positive definite.
 . (15)
where  is a residuum of the function
  in the nodal point
 ,
,  expresses the meromorphic function of Laurent series in the area of an isolated singular point (node), and also
  must be met,
 is the residuum of the function
in the kth nodal point zk.
A suitable method usable for solution of this problem is the multigrid method [25] which basically combines iterative and finite methods. The total error of the solution can be divided into singular (local) and global error. The singular error has high frequency with local range and can be reduced by an iterative process. Global low-frequency error has the character of a smooth function and affects practically the entire solved area. Therefore the finite element mesh was created from 2D, Tria
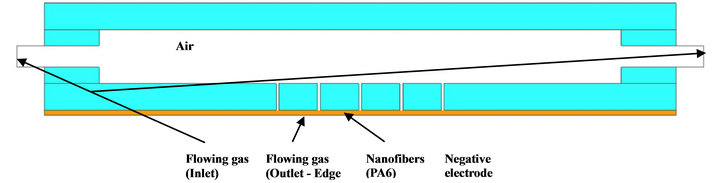
Figure 4. Finite element method model of the 3D nanostructure strain.
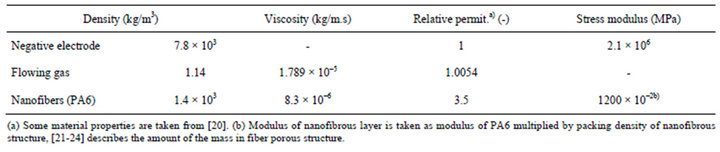
Table 2. Physical parameters of the FEM model.
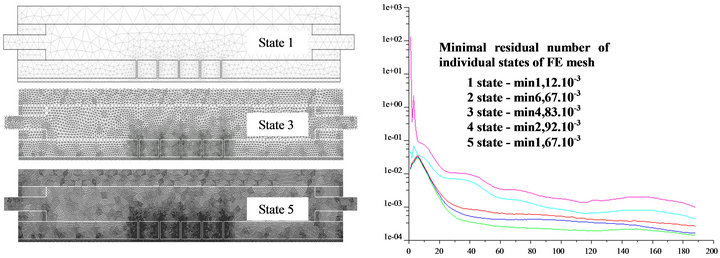
Figure 5. FE meshing of the model in the calculation convergence: Adaptive meshing for the minimization of the residues in the solved area (left), Dependence of the residue number on number of iterations (right).
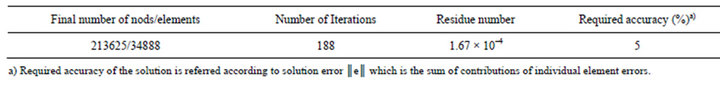
Table 3. Final values of the addaptive FEM meshing.
axis y metric elements (9-node elements). For a sufficiently accurate solution in the geometrically complicated areas (fillets, jet edges) and studied areas of the strain, elements with 0.2 mm size were created by the adaptive technique. The dependence of the convergence of the calculation, which is given by the expression of residual size on number of iterations, is shown in Figure 5(b).
4. Results and Discussions
Through FEM model simulation were obtained results of the pressure forces acting on the structure (Figure 6), where it is seen a non-linear pressure drop from an initial value of 1700 Pa (measured in the axis of the flow) to 600 Pa, at a distance of 400 micron fromthe nozzle. At the distance of 160 micron reaches applied force the value 0.0155 ± 0.0015 N and then falling less sharply which is given by distribution of the gas in the surrounding nanostructures due to its porosity. This dependence has a bi-linear course. Similar courses can be gotten re for the gas velocity flowing through the 3D nanostructure and its mass flow (Figure 7). Gas flow velocity decreases from the initial value of 54 m·s–1 to 32.3 m·s–1 m·s–1 (~40%) and the mass flow values decreases even from 0.49 g·s–1 to 0.233 g·s–1 (~42.5%). Figure 8 expresses the time-dependent structure strain near the nozzle at time t. The course of strain indicates that the expansion of the structure is caused by a combination of tensile and compressive stress. The structure deformation corresponds with the deflection of the membrane, which can generally studied by Winkler-Pasternak model where the membrane deflection is described by Equation (7).
FEM model of the laminar flow of the inert gas (air) from the nozzle in the negative electrode against the nanofiber structure distribution is shown in Figures 9 and 10. The pressure acting by the force 0.026 ± 0.007 N onto surface of 3D inhomogeneous nanofibrous structure causing the deformation of the structure through the reorganization of fibers is depicted by streamlines. The maximum thickness of the real structure formed by the gas flow was determined by the image analysis at 280 ± 20 μm (Figure 1). FEM simulation results showed approximately 70% higher value of 410 ± 30 μm. It can be assumed that when the flow ceases, i.e. when the force acting on the structure is close to zero (limF → 0), the structure will be partially reversibly deformed. From this assumption the fact that the flowing gas causes a certain pre-stressing in the structure can be deduced. After the fade of the gas pressure the pre-stressing causes a thickness reduction of layer. Figure 11 shows a comparison of FEM simulated strain of resulting structure with the real nanostructure. It is clear that the applied pressure causes deformation of the structure, which corresponds to the pressure distribution in the individual parts of the nanostructure. The simulation shows the concave curvature of the layers, what is seen in the real structure too.
5. Conclusion
In this paper a study of the structural strain in 3D nanofiber caused by gas pressure acting on its surface has
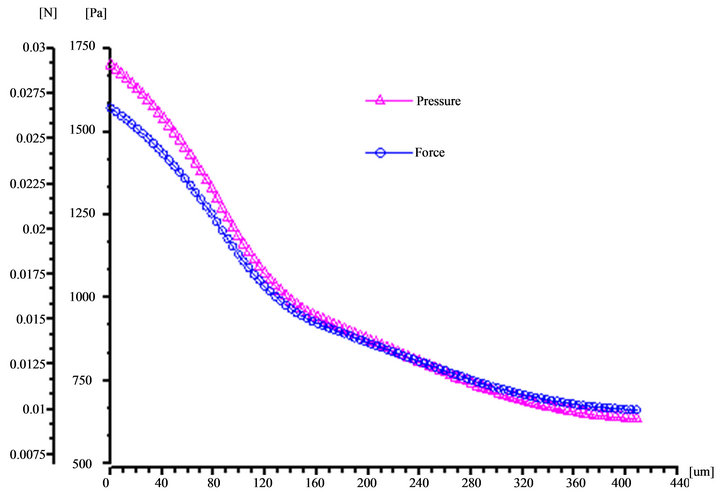
Figure 6. FEM model: Course of pressure and velocity depending on distance from nozzle.
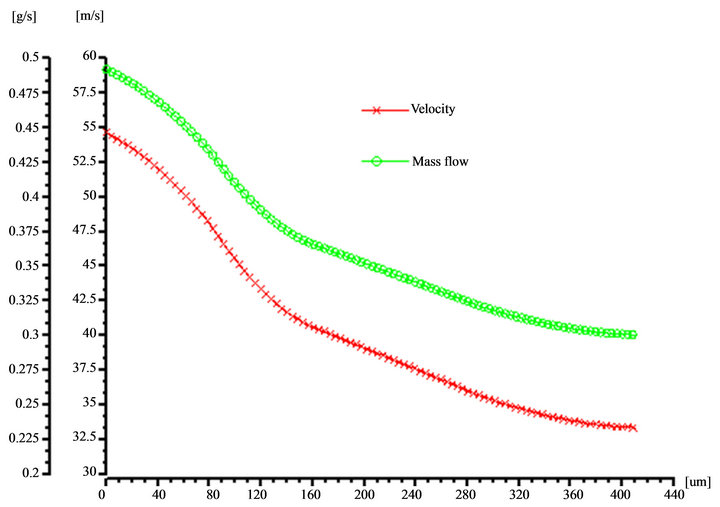
Figure 7. FEM model: Course of velocity and mass flow depending on distance from nozzle.
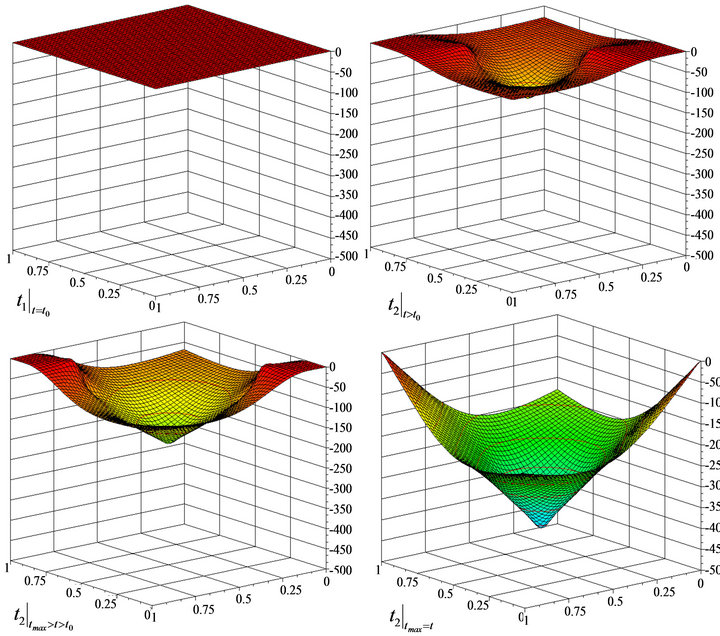
Figure 8. FEM model: Surface strain of 3D nanostructure caused by the flowing gas.

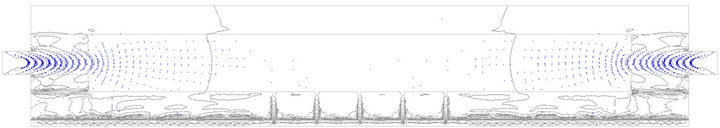
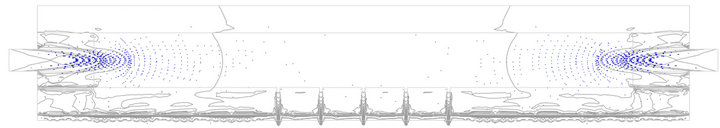
Figure 9. FEM model: vector plot of gas pressure flowing from the nozzle in the time.
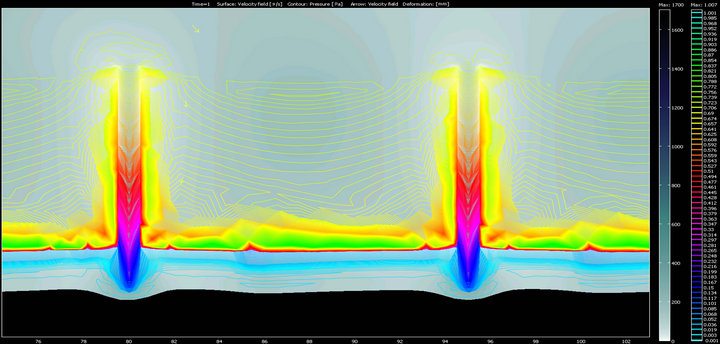
Figure 10. FEM model: Strain in the 3D nanofibrous structure from acting gas flow-distribution of the laminar flow from the nozzle of the negative electrode.
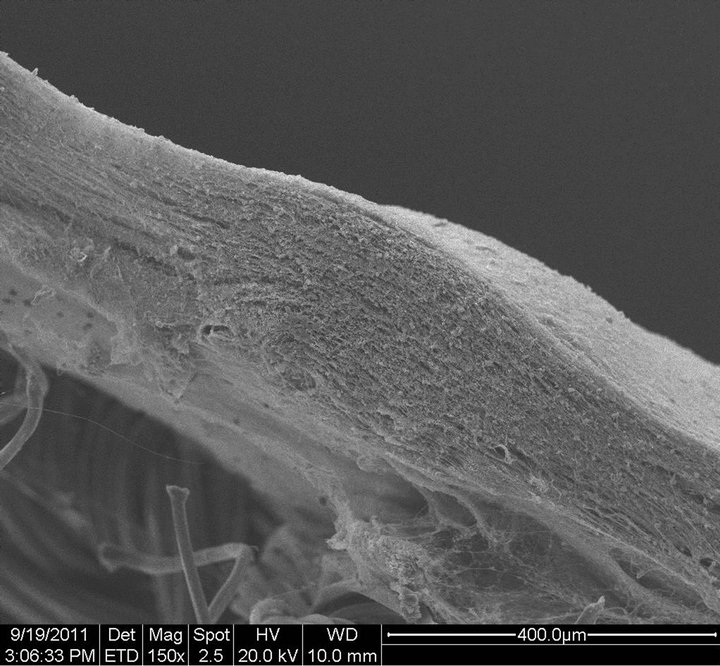
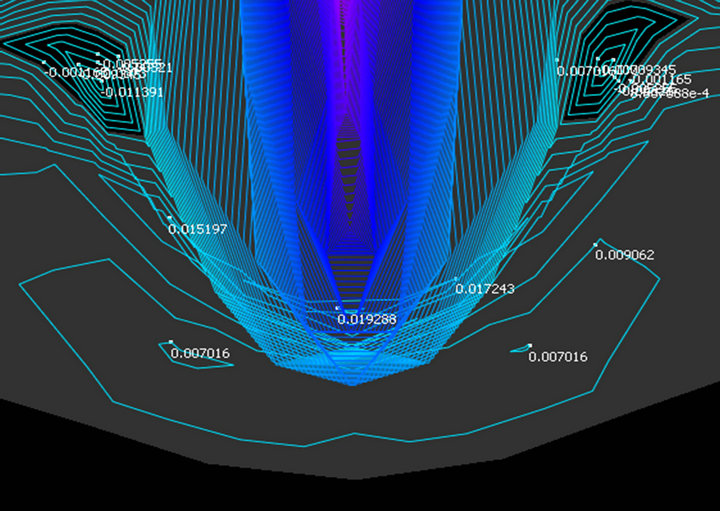
Figure 11. Comparison strain of resulting structure: FEM model (left), real 3D nanostructure (right).
been discussed. FE model with real geometry of the negative electrode, which describes the flow of gas through jets into 3D nanostructures was assembled for the description of the strain distribution. The character and flow of movement is based on the Laplace-Poisson diffusion differential equation. Also the porous structure that represents nanostructure in the model was included. The compression of structure can be defined by this approach using the Winkler-Pasternak model that is generally used for description of the porous materials. A comparison of the FEM model and image analysis of the real strain showed that results are consistent. The construction of the collecting electrode and also production process 3D nanofiber structure can be designed and optimized through the FEM simulation. The course of 3D nanostructure deformation is dependent not only on the value of the pressure of flowing media, but also on the external environment, viscosity, concentration of polymer solution and its type, size and gradient of the input voltage, geometry, but also on the relative permittivity of applied material. If the negative electrode will be made from material with a different dielectric constant, different character of the strain would be achieved, because of the changes in the arrangement in the structure. Presented FEM model boundary conditions are set according to the experimental values. In turn this enables optimization of the spinning process, device geometry, gas flow through the nozzle without the need of complicated experiment.
6. Acknowledgements
The research reported in this paper was supported in part by the Project OP VaVpI Centre for Nanomaterials, Advanced Technologies and Innovation CZ.1.05/2.1.00/ 01.0005 and by the Projects MPO FR-TI1/451, MPO FR-TI3/845 which has been financed by The Ministry of Industry and Trade of the Czech Republic and Project Development of Research Teams of R&D Projects at the Technical university of Liberec CZ.1.07/2.3.00/30.0024 and the project of CREATex (CZ.1.07/2.2.00/28.0321), which has been financed by Europen Social Fund and The Ministry of Education, Youth and Sports of the Czech Republic. This work was supported by ESF operational programme “Education for Competitiveness” in the Czech Republic in the framework of project “Support of engineering of excellent research and development teams at the Technical University of Liberec”, No. CZ. 1.07/2.3.00/30.0065.
REFERENCES
- A. Formhals, “Process and Apparatus for Preparing Artificial Threads,” US patent No. 1.975.504, 1934.
- Y. Wang, et al., “Modeling and Fabrication of Electrospun Polymer Nanofibers with Tailored Architectures for Tissue Engineering Scaffold Applications,” IEEE International Conference on Computational Intelligence for Measurement Systems and Applications, CIMSA ‘09, 11-13 May 2009, pp. 226-229, doi:10.1109/CIMSA.2009.5069954
- X. Wang, H. Niu, X. Wang and T. Lin, “Needleless Electrospinning of Uniform Nanofibers Using Spiral Coil Spinnerets,” Journal of Nanomaterials, Vol. 2012, 2012, Article ID: 785920. doi:10.1155/2012/785920
- A. Suzuki and K. Arino, “Polypropylene Nanofiber Sheets Prepared by CO2 Laser Supersonic Multi-Drawing,” European Polymer Journal, Vol. 48, No.7, 2012, pp. 1169- 1176. doi:10.1016/j.eurpolymj.2012.04.003
- L. Dong, Y. Liu, R. Wang, W. M. Kang and B. W. Cheng, “Mathematical Model of Electric Field Distribution at a Critical State in Bubble Electrospinning, ” Journal of Fiber Bioengineering and Informatics, Vol. 3, No. 2, 2010, pp. 117-120. doi:10.3993/jfbi09201010
- M. Petru, O. Novak and P. Lepsik, “Increase of the Efficiency of the Production Lines for the Spinning of Inorganic Nanofibers by the Electrostatic Field Intensity Optimization,” MM Science Journal, 2012, pp. 382-385. http://www.mmscience.eu/archives/MM_Science_201217.pdf
- D. Herak, A. Kabutey, M. Divisova and S. Simanjuntak, “Mathematical Model of the Mechanical Behavior of Jatropha curcas L. Seed under Compression Loading,” Biosystems Engineering, Vol. 114, No. 3, 2013, pp. 279-288. doi:10.1016/j.biosystemseng.2012.12.007
- M. Petru, O. Novak, D. Herak and S. Simanjuntak, “Finite Element Method Model of the Mechanical Behavior of Jatropha curcas L. Seed under Compression Loading,” Biosystems Engineering, Vol. 111, No. 4, 2012, pp. 412- 421. doi:10.1016/j.biosystemseng.2012.01.008
- M. Petru, O. Novak and P. Lufinka, “Study and Analysis of Transmissibility of Car Seat with Non Polyurethane Material,” Proceedings of 50th Annual Conference on Experimental Stress Analysis, Tabor, 4-7 June 2012, pp. 321-326.
- D. Vejrych and L. Sevcik, “Assesing the Distribution of Deformation in Layers in 3D Nanostructures Spinning into Another Space,” Proceedings of the 5th International Mechanical Engineering Forum, Prague, 20-22 June 2012, pp. 962-970.
- M. Dekys and O. Broncek, “Measuring Strain of the Lattice Towers,” Communications: Scientific Letters of the University of Zilina, Vol. 14, No. 3, 2012, pp. 39-42. http://www.uniza.sk/komunikacie/archiv/2012/3/3_2012en.pdf
- Z .Bittnar and J. Sejnoha, “Numerical Methods in Structural Mechanics,” Pitman Monographs and Surveys in Pure and Applied Mathematics, Thomas Telford Publications, London, 1996.
- K. Levenberg, “A Method for the Solution of Certain Non-Linear Problems in Least Squares,” Quarterly of Applied Mathematics, Vol. 2, 1944, pp. 164-168.
- D. Marquardt, “An Algorithm for Least-Squares Estimation of Non-Linear Parameters,” SIAM Journal of Applied Mathematics, Vol. 11, No. 2, 1963, pp. 431-441. doi:10.1137/0111030
- J. Jedrysiak, “Free Vibrations of Thin Periodic Plates Interacting with an Elastic Periodic Foundation,” International Journal of Mechanical Sciences, Vol. 45, No. 8, 2003, pp. 1411-1428. doi:10.1016/j.ijmecsci.2003.09.011
- I. E. Avramidis and K. Morfidis “Bending of Beams on the Three-Parameter Elastic Foundation,” International Journal of Solids and Structures, Vol. 43, No. 2, 2006, pp. 357-375. doi:10.1016/j.ijsolstr.2005.03.033
- S. K. Papachristou and D. S. Sophianopoulos, “Buckling of Beams on Elastic Foundation Considering Discontinous (Unbonded) Contact,” International Journal of Mechanics and Applications, Vol. 3, No. 1, 2013, pp. 4-12.
- K. Rektorys, “Varitional Methods in Mathematics, Science and Engineering,” 2th Edition, D. Reidel Publishing Company, Boston, 1980.
- M. Krizek and P. Neittanmaki, “Finite Element Approximation of Variational Problems and Applications,” Pitman Monographs and Surveys in Pure and Applied Mathematics, 50. Longman Scientific and Technical Publications, Copublished by John Wiley and Sons, Inc., New York, 1990.
- M. Komarek and L. Martinova, “Design and Evaluation of Melt-Electrospinning Electrodes,” Proceedings of 2nd NANOCON International Conference, Olomouc, 12-14 October 2010, pp. 72-77.
- B. Neckar and D. Das, “Modelling of Fibre Orientation in Fibrous Materials,” Journal of the Textile Institute, Vol. 103, No. 3, 2012, pp. 330-340. doi:10.1080/00405000.2011.578357
- C. C. Tsai, et al., “Nanoporous Artificial Proboscis for Probing Minute amount of Liquids,” Nanoscale, Vol. 3, No. 11, 2011, pp. 4685-4695. doi:10.1039/c1nr10773a
- D. H. Reneker, A. L. Yarin, E. Zussman and H. Xu, “Electrospinning of Nanofibers from Polymer Solutions and Melts,” Advances in Applied Mechanics, Vol. 41, 2007, pp. 43-195. doi:10.1016/S0065-2156(07)41002-X
- J. H. Yu, S. V. Fridrikh and G. C. Rutledge, “Production of Submicrometer Diameter Fibers by Two-Fluid Electrospinning,” Advanced Materials, Vol. 16, No. 17, 2004, pp. 1562-1566. doi:10.1002/adma.200306644
- R. Wienands and W. Joppich, “Practical Fourier Analysis for Multigrid Methods,” Chapman & Hall/CRC, 2005, p. 217.