Applied Mathematics
Vol. 3 No. 3 (2012) , Article ID: 18100 , 13 pages DOI:10.4236/am.2012.33040
A Mathematical Optimization Model for Locating Telecenters
1Transportation Engineering, University of Delaware, Newark, USA
2Civil Engineering Department, Center for Transportation Studies and Research, Sharif University of Technology, Tehran, Iran
3Transportation and Highway Engineering Department, Civil Engineering Faculty, Tarbiat Modares University, Tehran, Iran
4Department of Civil and Environmental Engineering, University of Delaware, Newark, USA
5Department of Civil Engineering, University of Sharjah, Sharjah, United Arab Emirates
Email: {morteza, faghri}@udel.edu, mkerman@sharif.ir, armamdoohi@modares.ac.ir, khamad@sharjah.ac.ae
Received January 17, 2012; revised February 18, 2012; accepted February 26, 2012
Keywords: Location; Telecommuting; Telecenter; Multi-Objective Optimization; Fuzzy Goal Programming; Accessibility Index
ABSTRACT
Telecommuting is a Transportation Demand Management strategy to partially or completely replace the daily commute with telecommunication technologies. Research has revealed that telecommuting can be effectively done from special places provided for this purpose called telecenters. In telecenter-based telecommuting, trip lengths are shortened due to change in the location of work places. Thus suitable locations of telecenters play an important role in increasing the beneficial impacts of telecommuting in the transportation systems. In this research, a mathematical optimization model for finding optimal location and capacity of telecenters is proposed. This model is a bi-objective linear program, and a Fuzzy Goal Programming method with a preemptive structure is used to solve it. Telecommuting demand is classified into three groups of telecommuters and a priority structure that assigns the higher priority class to the closer telecenters is also incorporated into the model. The proposed model is implemented in a case study of finding optimal location of telecenters for government employees in Tehran (capital of Iran) metropolitan area. The base model is solved and its sensitivity to different parameters has been analyzed based on which, an optimal model is selected. The solution of this model is an optimal pattern for distribution of telecommuting capacities and yields the most system-wide benefits from implementation of telecommuting.
1. Introduction
Telecommuting is defined as use of telecommunication technologies to partially or completely replace daily work commute [1]. Work trips constitute a large portion of essential/compulsory trips and are a major reason for traffic congestion in urban areas. Telecommuting is based on the premise that general traffic flow condition improves if these work trips are eliminated or decreased and therefore, regarded as a Transportation Demand Managing (TDM) strategy.
Different classifications of telecommuting exist in the literature. Telecommuting can be categorized as homebased or center-based. In the former, job tasks are accomplished at home whereas in the latter, employees perform their jobs at special places provided exclusively for this purpose, called telecommuting centers or telecenters. Today, research has revealed that telecommuting from telecenters is more acceptable [1]. Further, telecommuting can be classified into full-time or part-time categories depending on the number of days per week an employee telecommutes (a.k.a., frequency of telecommuting). Different types of telecommuting result in different travel behaviors which impact the transportation system in different ways.
In center-base telecommuting commute trips are not eliminated totally, but rather relocated to closer destinations in the residential neighborhood making the use of transit or even walk to work more feasible. Moreover, since many primary work places are usually located in the business centers of cities (CBDs), telecenters could mitigate the mobility problems in these areas that are usually highly congested. These benefits are a result of wise replacement of the initial work places with telecenters. Therefore it is important to find optimal locations for telecommuting centers.
In this paper, a multi-objective mixed integer mathematical programming optimization model is proposed for locating telecenters. The proposed location-allocation model is applied to the case of Tehran, the capital of Iran, which has long been facing the problem of traffic congestion.
The rest of this paper is organized as follows: Section 2 presents simplifying assumptions made for modeling the problem and the required input information. In Section 3, the model is set forth and the solution method is described. Results and sensitivity analysis on parameters of the model are included in Section 4. Section 5 concludes the research and presents some suggestions for further research.
2. Model Inputs and Simplifying Assumptions
2.1. Telecommuting Demand
One of the most important pieces of information for locating some specific sort of facility is the distribution of the demand for those facilities. The main demand data used in this research is acquired from the first part of a project done in 2007 by Institute for Management and Planning Studies (IMPS) located in Tehran. The goal of this project was to study the impacts of telecommuting in Tehran and to estimate telecommuting demand. Only governmental employment is considered in this study for two reasons. First, gathering information from governmental employment is easier and potentially more accurate compared to non-governmental employment. Second, implementation of telecommuting in a governmental level is more efficient due to central management.
The result of this phase is the estimated number of 1-day, 2-day, and 3-day telecommuters in each of the 560 traffic zones of the city of Tehran based on which, the daily design telecommuting demand that the centers should accommodate is calculated. This demand indicates the average number of employees living in each zone who telecommute in a given work-day of a week, considering the day-to-day fluctuations. The telecommuting demand of each zone is laid at the center of the zone and is represented by a vector di = (di1, di2, di3) with components di1, di2, and di3 representing the number of 1-day/week, 2-days/week, and 3-days/week telecommuters, respectively. The mathematical location model will be fed by these values as one group of input parameters.
2.2. Assumptions
In this section, simplifying assumptions regarding the modeling of the telecenters location problem are set forth.
• Though there is some debate on the exact definition, we will define a telecenter as a place other than home from which employees can accomplish their job tasks instead of traveling to the original work place (main office), located further away.
• Telecommuting centers are classified into two types: Satellite telecenters, and Neighborhood/Local telecenters. Satellite telecenters are only used by employees of one organization while Neighborhood telecenters could be shared between telecommuters of different organizations or entities. Though the most distinctive feature between the two types of telecenters is exclusivity to one group of employees, in some previous studies these two general groups are also considered different in terms of the location they are situated. Satellite telecenters, though closer to employees’ residences than the main office, might still require long travel distances to reach, while Neighborhood/Local telecenters are considerably close to employees’ residences. In this research, Satellite telecenters are not considered in the location model. Although regarding Satellite centers at the same time is an ideal case that makes the problem much more realistic, it adds to the complexity of the problem to a great extent.
• One of the most important considerations in each location problem is the choice of possible solution space or potential places to provide the related service. Though theoretical provision of the facilities is only possible at these exact points, in the real world they could be established in proximity to them. This issue is more likely to take place in modeling establishment of new facilities as opposed to make changes or developments in some existing facilities.
As mentioned earlier in this section, the estimated telecommuting demand for the present study is available for each of the 560 traffic zones and is regarded as a 3-D vector (with components d1, d2, and d3) concentrated at the center of those zones. The center of each traffic zone is an internal point that is representtative of all the trips produced and attracted by that zone. The geographic location of these points is available from previous transportation planning studies for city of Tehran. An evident solution space for the location model could be the centers of traffic zones offering a possible telecommuting opportunity at each traffic zone, and clearly, the center of the zone is only a representative of the zone-wide telecommuting opportunities. However, a more practical solution set is defined by the degree of aggregation considered appropriate and with regard to the computational limitations.
In this research, a degree of aggregation matching the division of the city to 53 districts is considered suitable and the objectives of the problem are also defined such that they reflect measures that are meaningful in this level. For each of these 53 divisions, a centroid is defined which would represent all telecommuting opportunities in that division. In other words, all of the telecommuting capacities in a division are aggregated and regarded as a single imaginary telecenter unit located at the center. The centroid of each division can be determined based on a predetermined convention. For instance, the center of the internal traffic zone with the biggest demand could be considered as the centroid of the division. Alternatively, one could average coordinates of the centers of internal zones weighed by factors reflecting the magnitude of their zonal demands. The point represented by these average coordinates could be accepted as the centroid of the division. In this research, the first approach is taken. The divisions and their centroids for city of Tehran is depicted in Figure 1.
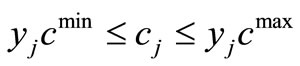
• Another important consideration in a location problem is the capacity of facilities. From this angle, the problems are classified to capacitated and incapacitated models. The main difference between these two groups is that in capacitated problems the demand flows would probably split because of the capacity limitation of the service facilities and thus continuous variables representing the demand flows play an important role in modeling of the problem. In the incapacitated problems at the other hand, demand flow split does not happen and as a result, binary variables representing existence or non-existence of flow in the defined links take over the role of continuous flow variables.
In the past applications, a wide range of maximum capacities for telecenters have been used which differ from a few employees to a few hundred of them. It should be considered that since in this research an imaginary telecenter resulted from aggregation of all telecenters of a division in the centroid is dealt with, the capacity of a single unit of telecenter is not meaningful in the proposed model. However, looking at the paradigm of putting an upper bound on the number of work-stations of each telecenter, an upperbound for telecenter capacities of each division is considered and thus the proposed model is capacitated. In other words, a parameter cmax which represents the maximum acceptable number of telecommuting work-stations in each division is defined and for each division j, we have:
 (1)
(1)
where cj is the needed capacity of telecenters in division j and is resulted from the solution of the problem.
Obviously when cmax is considered the same for each division it should be large enough to satisfy the total daily demand, or mathematically:
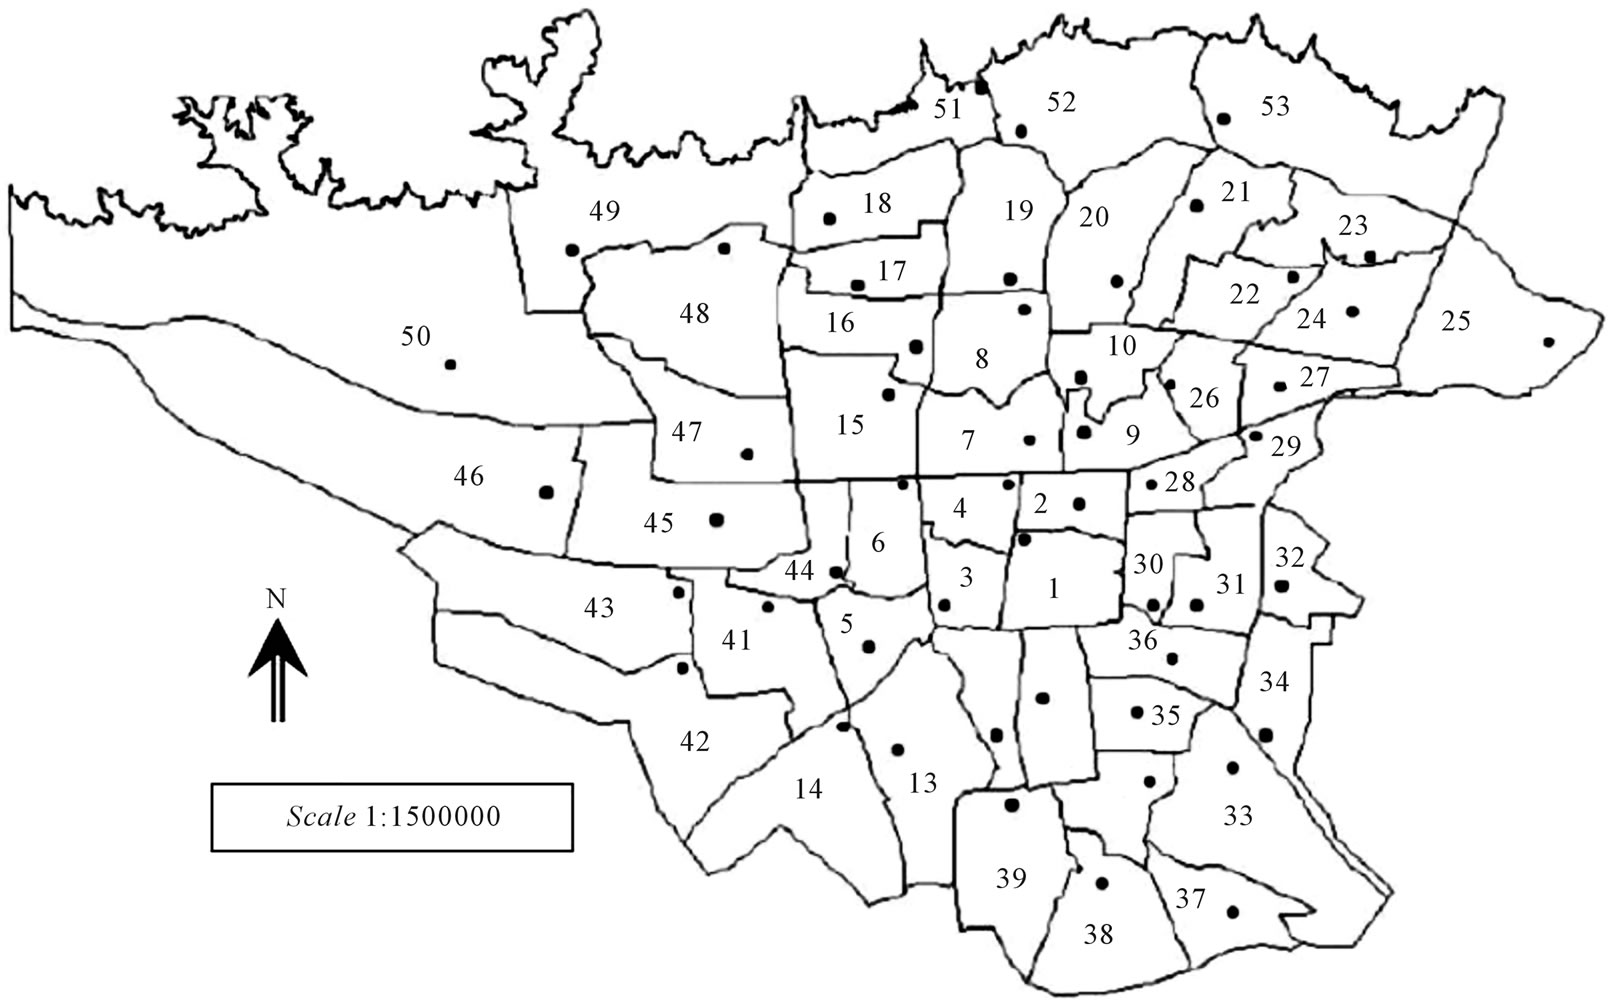
Figure 1. City of tehran divisions and their centers.
 (2)
(2)
where di is the daily demand in traffic zone i. Entering the total amount of daily demand as 106447 in the above equation, we have: .
.
To acquire more information about an appropriate value for cmax, notice that one of the implicit goals in this problem is uniform and equal distribution of work-trip destinations. From the 2000 census data, governmental employment densities for divisions located inside and outside of the CBD of the city of Tehran are estimated to be 22 jobs/Hectare and 5 jobs/ Hectare, respectively. Looking at these values, it is concluded that the closer the governmental employment density gets to the average value for CBD divisions (approximately, 20 jobs/Hectare), the higher its probability of being chosen as a trip (particularly work-trip) destination. Conversely, governmental employment densities with values of roughly 5 jobs/ Hectare and less, show a normal level of work-trip attraction which could be regarded as a desirable level of employment. Therefore, considering that governmental telecommuting at telecenters is a part of the total governmental employment of each division and is a strategy to lessen the number of work trips to congested business districts and uniformly disperse them instead, an average upper bound on the number of telecommuting opportunities could be achieved by multiplying the mean division area by the mean density 5 jobs/Hectare, or:
 (3)
(3)
where  is the average area of the 53 divisions and equals to 1462.976 Hectares and each job is assumed to be assigned to only one person. Equation (3) gives the estimated value of 7315 for the maximum number of work-stations in each division. Since earlier in Equation (3), the value 2000 was chosen as a lower bound for cmax, the interval (2000, 8000) can be accepted as a reasonable range. Sensitivity Analysis will be performed to get useful information about the effect of this parameter on the results and achieve an appropriate value for it (Section 4.2).
Although it could be argued that divisions with larger areas should have larger upper bounds for the capacity of telecenters, it was observed that just a few divisions had areas considerably larger than the average and these divisions are enclosing low telecommuting demands. Hence, consideration of a single upper bound for each division is assumed appropriate.
The parameter cmax helps control the uniform and equitable distribution of the opportunities for telecommuting and from this angle, smaller values for it would be more suitable. Larger values for this parameter will lower the possibility of overflowing of the demand into the neighboring divisions and therefore, lower the needs for establishment of additional telecenters. From this perspective, larger values for cmax are more desirable. So it is expected to find an optimal value for this parameter in the chosen interval. This issue will be discussed in Section 4.
In the model proposed in this research, a lower bound on the telecommuting capacity in each division is also considered. This lower bound implies that if it was decided to provide telecommuting opportunity in a division, a minimum capacity of cmin should be supplied, or:
 (4)
(4)
The rationale behind this consideration is rooted in the common pattern of initial cost (penalty) of establishment when a facility is provided in a new point. Although economic measures are not regarded directly in our model, provision of telecommuting opportunities for less than certain amount of telecommuters in a division is considered non-beneficial. Meanwhile, it should be noticed that selection of an inappropriately large value for cmin, could cause nonuniform distribution of telecenters which contradicts our goal of equity. Hence, an optimal value which depicts the trade-off between these two perspectives is expected.
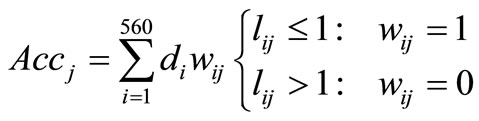
To achieve an upper bound for cmin, an accessibility index is used. For the centroid of each division an index of accessibility to the telecommuting demand origins is developed. To give priority to the hometelecenter trips within walking distances, this proposed accessibility measure is built based on walking accessibility. The demand points located 1 kilometer (0.62 miles) or less apart from the center of a division are affected by a factor of 1.0 and all other demands by a factor of 0.0 and added up together. The accessibility measure for the center of each division is calculated from summation of all demands located no more than 1 kilometer apart. This 1 kilometer threshold is based on a tolerance limit of 15 minutes walking between home and the work place assuming the walking speed of 4.32 km/hr (3.9 fps). Mathematically:
 (5)
(5)
where  is the distance in Kilometers between center of traffic zone i and centriod of division j. By calculating the average accessibility index over all divisions, an accessibility measure of 842 is resulted which implies that center of each division is expected to be in walking access of about 800 telecommuters on average. Selection of cmin could be based on the ability of the telecenter facility to serve some portion of this amount. Clearly, if this portion is small a low value is given to telecenters accessible by walking, but on the other hand, as cmin gets closer to 800, it is more probable for employees of further residences to be assigned to the telecenter and could lead to a decrease in expected benefits of the program. Also, if cmin exceeds 800 the goal of uniform distributed opportunities could be at stake. Therefore, the optimal value for parameter cmin must be in the (0 - 800) interval.
It is worth mentioning that due to the maximum capacity constraint, the flow of telecommuters originnating from a traffic zone will possibly break into smaller flows towards different divisions. This means that some of the employees of a traffic zone will be assigned to further centers and some to the closer ones. In the proposed model, an effort is made to prioritize different telecommuters in use of closer telecenters and since the most important differentiating attribute of telecommuters is the number of telecommuting days per week, the prioritization is implemented based on this issue. The prioritization structure proposed discriminates between different telecommuters in using closer telecenters. As an example, the structure could be an assignment of 3-days/week telecommuters, then 2-days/week, and finally 1-day/ week telecommuters to closer telecenters. In other words, the priority order of different telecommuters in using telecenters could be 3-day telecommuters first, then 2-day, and finally 1-day telecommuters, or 3-2-1. This structure could be argued as an incentive policy which gives better opportunities to more frequent telecommuters. In Section 4, six different priority orders will be examined and based on the results the best structure will be chosen.
• The last issue to consider is the objective functions. In the process of making a decision about the location of telecenters, different stakeholders with variety of viewpoints and goals participate. Employees, employers, the public, managers and owners of the transportation system, and policy decision makers are all involved. They look into the problem from their own perspectives which are likely to contradict each other. Therefore, taking a multi-objective (multi-criteria) approach in effort to satisfy different stakeholders’ needs is essential. In this research, the telecenters location problem is looked at from viewpoint of an objective decision maker who is in seek of benefiting all stakeholders to the possible extent.
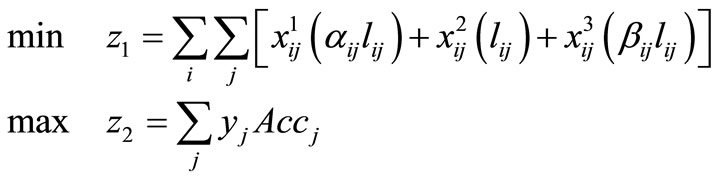
Two objective functions are proposed in the telecenters location model. The first objective function (z1) represents the total Euclidean (aerial) personkilometers of daily home-telecenter trips for telecommuters and in a general case could be stated as follows:
 (6)
(6)
where I is the set of traffic zone centers indices ({1, 2, ∙∙∙, 560}) and J, the set of division centers ({1,2, ∙∙∙, 53}),  is the number of telecommuters residing in zone i and working in a telecenter in division j, and
  is the Euclidean (aerial) distance between points i and j in kilometers. This objective function should be minimized.
The second objective function (z2) gives the summation of accessibility of telecenters to residences of telecommuters. The accessibility index for the center of each division is of destination-accessibility type and in order to best fit in the abstract context of the proposed model, is defined as follows:
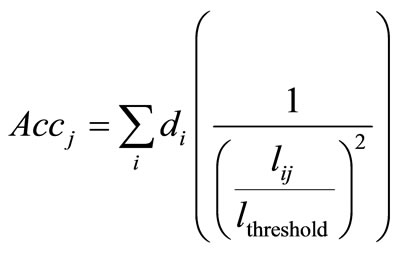 (7)
(7)
In this equation, Accj is the accessibility index of the center of division j, and  is the telecommuting demand at traffic zone i. The term in parenthesis is the travel impedance between origins and destinations (opportunities) and decreases with an increase of the distance (
 ). The second order power in the denominator is to accentuate the effect of distance, and use of the fraction
  instead of
  is to give more value to the distances lower than
  compared to the distances more than that. With the goal of giving more priority to walking trips, the value of
  is considered to be 1 kilometer (0.62 miles).
Based on the accessibility measure described above, the second objective is to maximize the function z2 defined as:
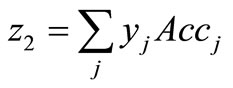 (8)
(8)
Thus the model proposed in this research for locating the telecenters is a bi-objective mixed IntegerProgramming (IP) model and should be solved by one of the solution methods for multi-objective problems.
3. Proposed Location Model
The following mathematical optimization model is proposed for locating telecommuting centers;
 (9)
(9)
 (10)
(10)
 (11)
(11)
 (12)
(12)
Definition of indices and parameters are as follows.
i: traffic zone index which is an element of set I = {1, 2, ∙∙∙, 560}.
j: division index which is an element of set J = {1, 2, ∙∙∙, 53}.
k: index representing number of telecommuting days per week which is 1, 2, or 3.
 : number of k-days/week telecommuters residing in zone i which telecommute in a given day (in persons).
 : total number of employees residing in zone i which telecommute in a given day (in persons),
  .
.
 : accessibility index for center of division j, derived from Equation (7).
 : distance between center of zone i and division j (in kilometers).
 : distance increase factor which is derived from the following equation:
 (13)
(13)
where  is the minimum distance between all the distances beginning from i and ending at j which are greater than or equal to
 . Mathematically:
 (14)
(14)
and in the special case that  is the greatest element of the above set, it is assumed:

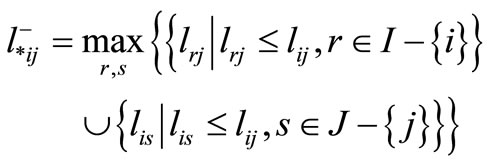
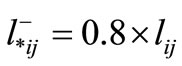
 : distance decrease factor which is derived from the following equation:
 (15)
(15)
where  is the maximum distance between all the distances beginning from i and ending at j which are smaller than or equal to
 . Mathematically:
 (16)
(16)
and in the especial case that  is the smallest element of the above set, it is assumed:
The decision variables of this model are defined as follows.
 : number of k-days/week telecommuters living in zone i and traveling to division j for telecommuting.
 : binary variable equals to 1, if there is a telecenter in division j, and 0, otherwise.
Parameters  and
and  are used in the model to show the priority structure of using the closer telecenters. For each specific origin-destination distance like
 , by multiplying in
  which is a parameter greater than unity, a distance
  which is greater than
  is generated. Similarly, by multiplication in
  which is a factor smaller than one, a distance
  which is smaller than
  is achieved. Thus for each origin-destination pair, two more distances other than
 , one at each side, are generated. Now if the priority of using nearer telecenters is with 3-days/week telecommuters followed by 2-days and then 1-day telecommuters, the term
  in objective function
  is affected by the factor
 ,
,  by the factor
 , and
, and  by
by . In this way minimization of
  will cause filling capacities of nearer telecenters by 3-days telecommuters, 2-days, and finally 1-day telecommuters, if the zonal demand is to be split between two or more divisions. It is worth mentioning that the definition of
  in Equations (14) and (16) guarantees that the relative order existing between origin-destination pairs’ distances with a common node at one end does not change. In other words, the increased distance
  applicable for 1-day telecommuters of zone i, does not exceed any of the distances
  or
or  that are greater than
 , and the decreased distance
  used for 3- days telecommuters does not get smaller than any of the distances
  and
and  that are smaller than
 . As a result each employer is still being allocated to the nearest telecenter possible. In order to change the pre-assigned priority order it is enough to change the
  s’ coefficients in the function
 . For instance, if the 2-1-3 order is desired (meaning that 2-days telecommuter have the priority over 1-day and 3-days telecommuters), then
  should be affected by
 ,
,  by
by , and
, and  by
by .
.
In addition to decision variables  and
and , the required capacity for telecenters of each division is another important variable which can be derived from the following equation:
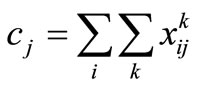 (17)
(17)
Therefore, constraints (10) and (11) can be summarized as Equation (18).
 (18)
(18)
In this case, Equation (17) must be added as another equality constraint as well.
Parameters cmax and cmin are the maximum and minimum of telecenter capacities and as mentioned earlier in Section 2 could take values between (2000, 8000) and (0, 800), respectively, for Tehran’s specific location problem. As a start, values of 3000 and 400 work-stations are assigned to cmax and cmin, respectively.
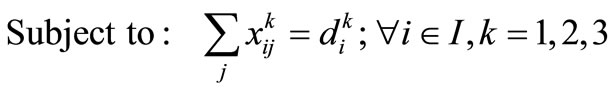
The first set of constraints in the model (Equation (9)) guarantees that all of the telecommuters of different classes residing in zone i are assigned to telecenters. Although the number of telecommuters is in fact an integer, since  is an average real number drawn from calculation, non-integer values for
  are also accepted and there is no need to constrain
  values to integer numbers.
3.1. Solution Method
The problem at hand is a multiobjective (MO) optimization with two objective functions. Multiobjective optimization (a subcategory of multi-criteria optimization or vector optimization) is a robust tool used to deal with decision making problems which inherently involve multiple and potentially contradicting objectives to be satisfied. The inherent ambiguity in the concept of optimality in multiobjective problems is perhaps the biggest complexity in dealing with them, to the extent that sometimes it is even hard to compare the results of different methodologies. Often times it is the human decision maker (DM) that specifies the best (or optimal) solution.
The method used in this study is an extension to Goal Programming (GP) called Fuzzy Goal Programming (FGP). Fuzzy Goal Programming troubleshoots the main weakness of the Goal Programming: the difficulty to specify exact goal (target) values for each objective. This was primarily proposed by Narasimhan [2] and further developed by Hannan [3], Narasimhan and Rubin [4], and Tiwari et al. [5,6]. Details of FGP method can be found in references.
The particular FGP approach used in this study has a preemptive structure to consider different levels of priority for different objectives. This structure basically insures that lower priority objectives would not reach their specified target values before the higher priority objecttives. This approach is found and formulated by Chen and Tsai [7].
3.2. Preparation of the Model for Solving with Preemptive FGP
To solve the proposed model of this study by preemptive FGP method, upper and lower limits of the goal values of each objective function must be defined and also one of the two objective functions must be specified as the objective with the higher priority. After this first step, the new  variables will be defined and additional constraints representing Fuzzy Membership Functions and also constraint(s) defining the specified priority order of objectives will be added to the model. The model could then be solved as a normal single-objective linear optimization.
Upper bound goal of the first objective-u1: To obtain an upper bound for the goal of the first objective, objective function z1 is maximized subject to the initial constraints of the problem, Equations (9)-(12). Therefore, u1 is equal to the optimum objective function value of the following problem:
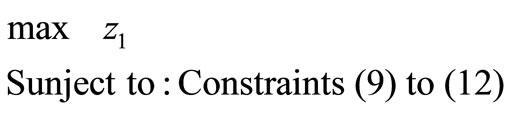 (19)
(19)
Values of parameters cmax and cmin are chosen to be 3000 and 400, respectively, as mentioned in Section 4.1.
By solving Problem (19), the optimum value of the objective function is 1,764,200 person-kilometers which as explained earlier, could be used as u1 value. But, since in the original problem, z1 has to be minimized, the above number results in a very big interval for the goal value and thus to confine this interval, one half of it is used which means, u1 = 882,100 person-kilometers.
Lower bound goal of the first objective-l1: Since the optimum value of objective function z1 is lower or equal in the single-objective problem of minimizing z1 as compared to the original bi-objective problem, the solution of the following problem can provide useful information on the value of l1 to be selected.
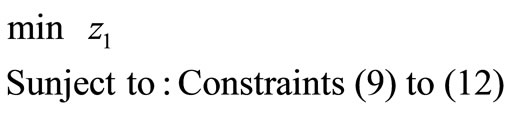 (20)
(20)
The optimum value of the objective function in Problem (20) is 200,744. Since z1 has to be minimized, l1 is a more important bound than u1 and thus is chosen to be a lower value than the result of Problem (20). That allows better observing the behavior of function z1 under sensitivity analysis (Section 5). The value of l1 is selected to be 150,000 person-kilometers.
Upper bound goal of the second objective-u2: Similar logic to what used for drawing l1 is used here to calculate the upper bound of the second objective’s goal. By maximizing z2 subject to the same basic constraints (Equation (21)) the optimum value of the objective function is 358,913.
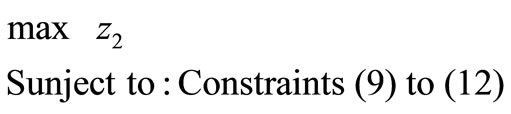 (21)
(21)
Again to be able to better see the behavior of function z2 under sensitivity analysis the value of u2 is set to be 400,000, which is greater than the result of Problem (21).
Lower bound goal of the second objective-l2: A different approach is taken to obtain a lower bound for the second objective. Since the solution of Problem (19) represents a very undesireable and inopportune deployment of the telecenters, the value of function z2 for the solution of Problem (19) could be an appropriate lower bound on the goal of z2. Therefore,  values resulting from problem (19) and accessibility indices of the 53 divisions are plugged in the function z2 which gives the number 92774 for l2. But to confine the goal interval, this value is doubled which means, l2 = 185547.
The values of the upper and lower bounds on the goals of the two objectives are summarized as:
l1 = 150000, u1 = 882100 l2 = 185547, u2 = 400000.
Having the upper and lower limits of each goal set, linear Membership Functions of the Fuzzy logic can be defined as follows:
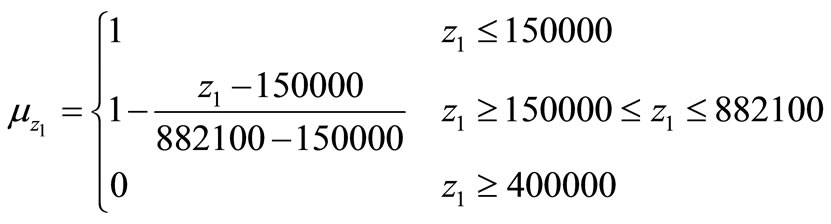 (22)
(22)
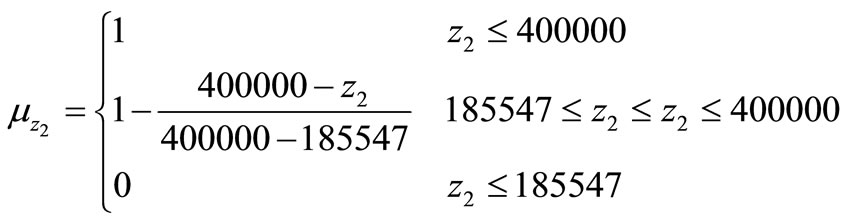 (23)
(23)
Next step is to incorporate two additional variables,  and
and , to the problem representing the degrees of achieving the first and second objective targets, respecttively. By defining these variables the priority order of the objectives can be added to the problem by appropriate inequality relations.
The first objective is considered to have the higher priority in this study. This is because of the great benefits resulting from the reduction of work-trip lengths. In fact, most of telecommuting positive impacts are due to the reduction in person-kilometers of work-trips. Although maximizing the total accessibility index of the telecenters is an important objective too, it has a lower degree of priority.
Equation (24) presents the proposed optimization model with Chen and Tsai’s preemptive FGP structure. This problem is a Linear Integer Program with a single objective function and non-negative variables. The number of decision variables is 89095 (89040 + 53 + 2) and the number of constraints is 1786 (1680 + 53 + 53). This problem is solved by the solver CPLEX in the GAMS 2.6 (General Algebraic Modeling System) package and the results along with sensitivity analysis on different parameters are presented in the next section.
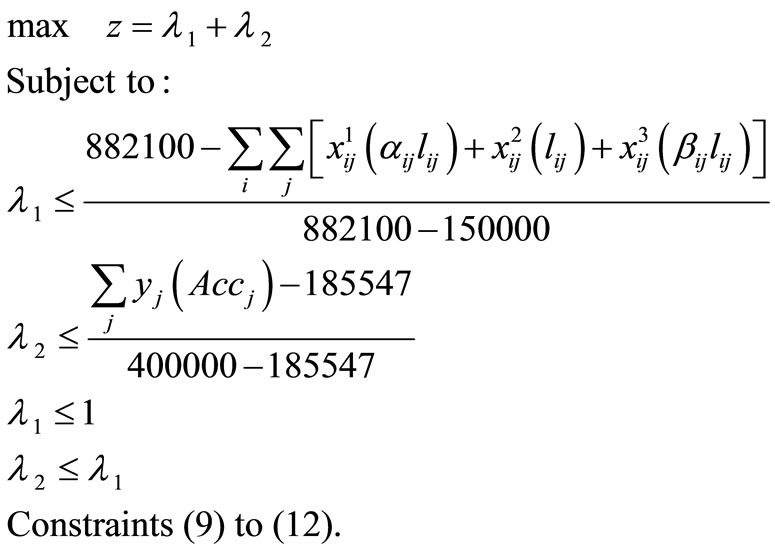 (24)
(24)
4. Analysis of Results
As mentioned earlier, in the base model the values of parameters cmax and cmin are set to 3000 and 400, respecttively, and the priority to use closer telecenters is 3-2-1. This implies that ,
,  , and
, and  must be affected by factors
 , 1, and
  in the functional form of the objective z1, respectively. The base model is solved and to validate the efficacy of the priority structure some insights are set forth. In the next step, sensitivity of the optimal solution to cmax is analyzed while cmin value and the priority order of 3-2-1 remains the same. In another step, by setting cmax fixed to a select value found in the previous step, sensitivity analysis is done on cmin. Finally, select values of cmax and cmin are used and the impact of changes in the priority order of using closer telecenters is evaluated. By the end of this section and based on results of the three stage sensitivity analysis, the best model to locate telecenters in the City of Tehran is proposed and solved.
4.1. Efficacy of the Priority Structure
To see how the prioritizing structure of using closer telecenters works, more elaboration on the model results is needed. To show this structure, values of flow variables representing demand distribution of a typical traffic zone is depicted in Figure 2.
As seen in this figure, zone 119 has a daily TC-demand of 4223 persons which is divided between the telecenters of two divisions. The total demand is divided in a way that the 3 days/week telecommuters (specified by number 3 in parenthesis next to the flow value) have
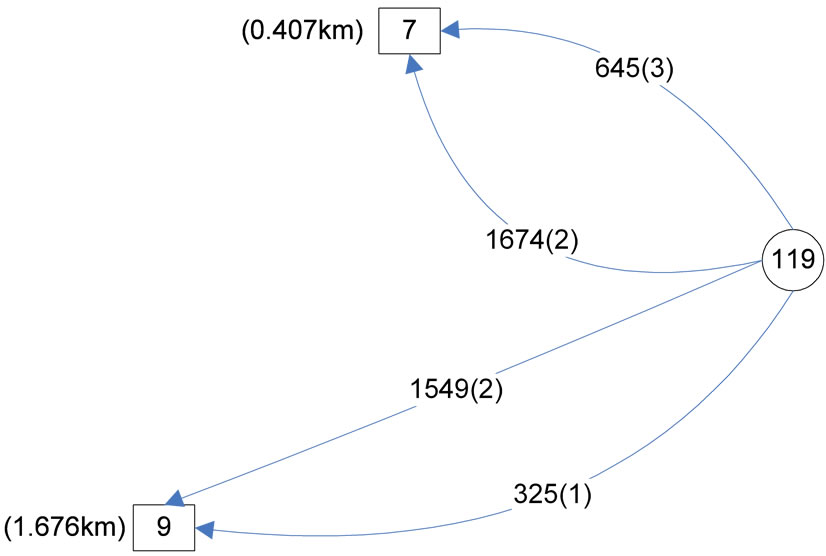
Figure 2. Optimum flow variables for node 119 resulted from the base model.
the priority of using the closer telecenter (division 7). After all 3 days/week telecommuters are assigned, the priority of using division 7 is with 2 days/week telecommuters and finally, the whole 1 day/week telecommuter population is flowed towards the further telecenter at division 9.
Now consider zone 127 with a total demand of 3046 optimally distributed by the pattern shown in Figure 3.
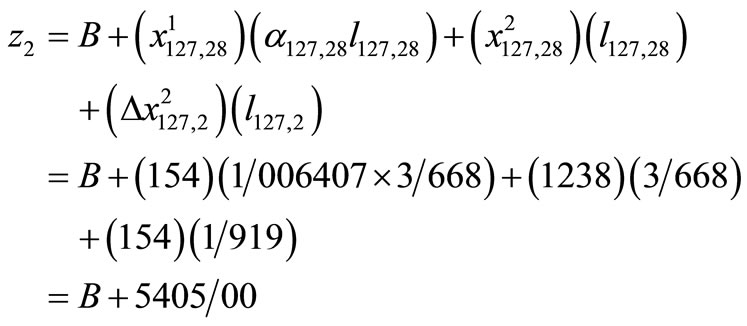
As shown in this Figure 3 days/week telecommuters are not assigned to the telecenter of division 9 which is located closer than the telecenter at division 2. Also contrary to what is expected, 1 day/week telecommuters have not assigned to division 28 which is the furthest among all three divisions. At first glance, it may seem that the priority structure is malfunctioning but a closer look in the results clarifies the reason.
Let’s assume the TC-demand of zone 127 splits as shown in Figure 4. This distribution respects the order of priority between 3 and 2 days/week telecommuters.
Since the value of objective z2 is same for both figures, only the different terms of the first objective are calculated here.
In Figure 3:
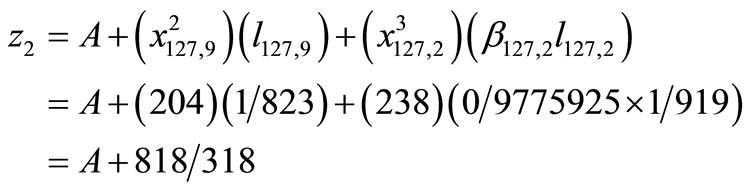
In Figure 4:

As shown, the objective of minimization of z1 favors the flow distribution pattern of Figure 3. In other words, since the objective is to minimize z1 and not to unconditionally utilize the priority structure, it is possible in some rare cases that the assumed order alters so the TC-demand can be assigned more optimally. Scrutiny on the results shows that these alterations mainly happen when centers of divisions are located at similar distances from a zone and thus, are almost equally acceptable for telecommuters.
Had the priority order between 2 and 1 day/week telecommuters been respected, the flow pattern of Figure 5 would have resulted. In this case also the following
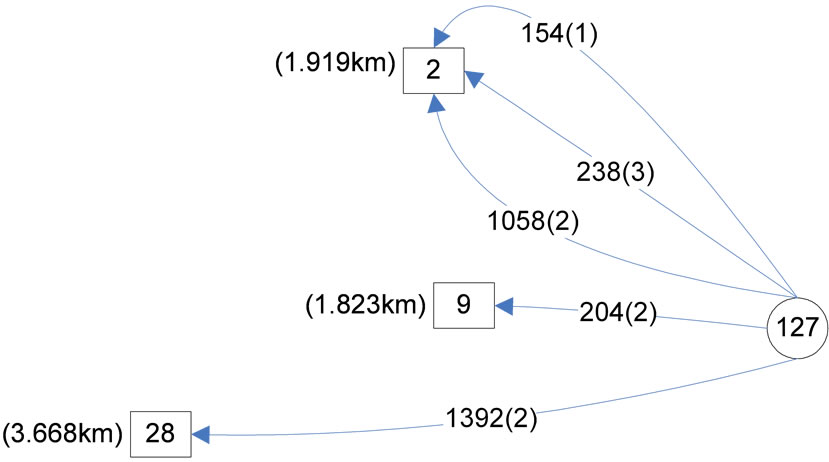
Figure 3. Optimum flow variables for node 127 resulted from the base model.
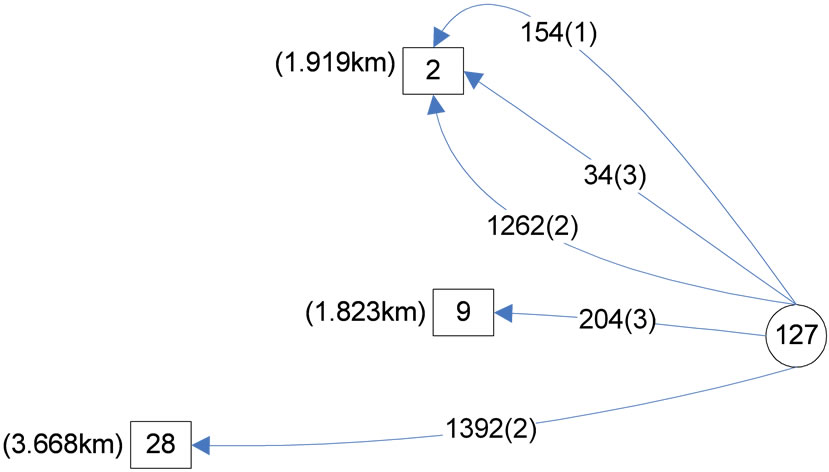
Figure 4. Assumed flow variables for node 127 (priority order respected: 3-2).
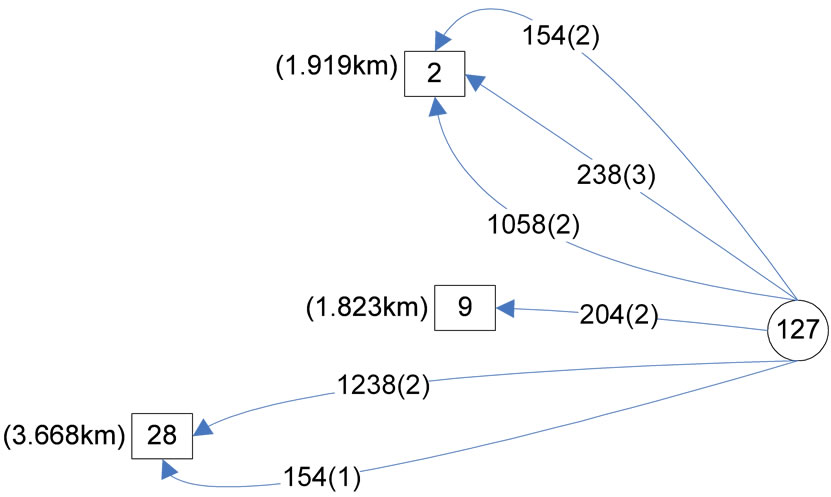
Figure 5. Assumed flow variables for node 127 (priority order respected: 2-1).
comparison shows the optimality of the pattern in Figure 3.
In Figure 3:
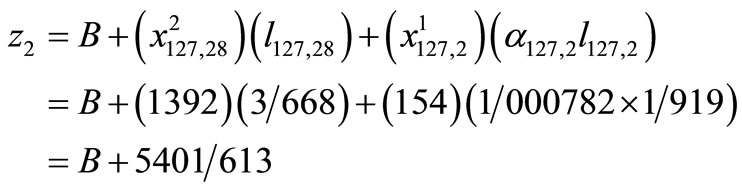
In Figure 5:
4.2. Sensitivity Analysis on the Maximum Capacity (cmax)
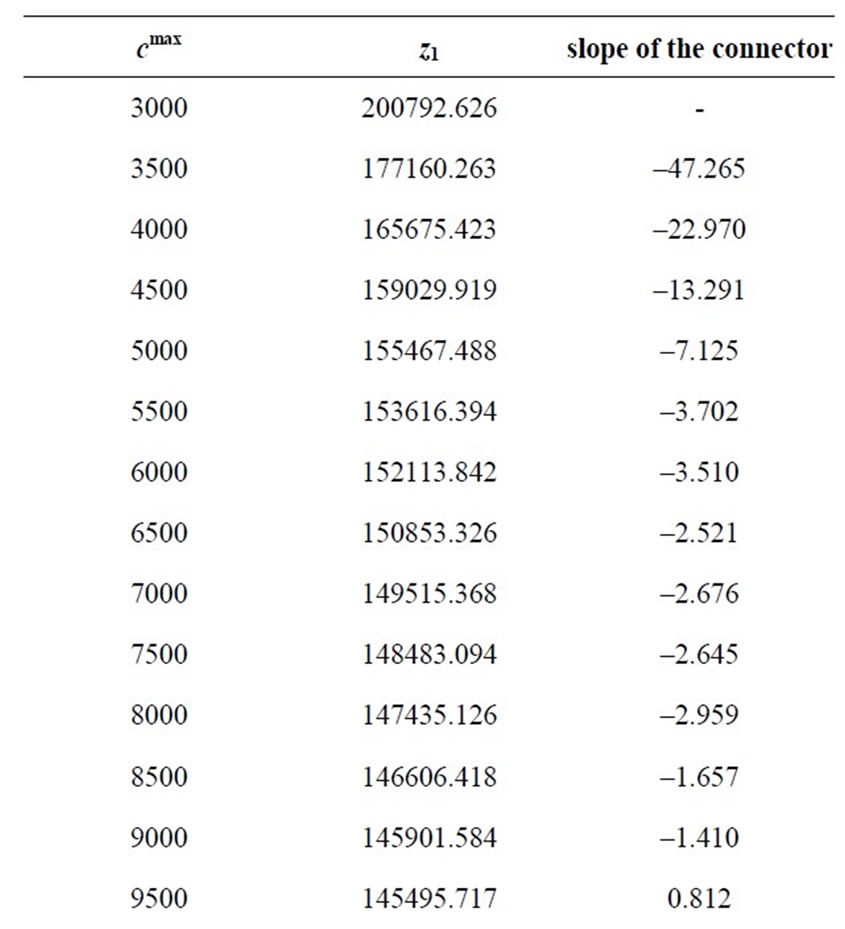
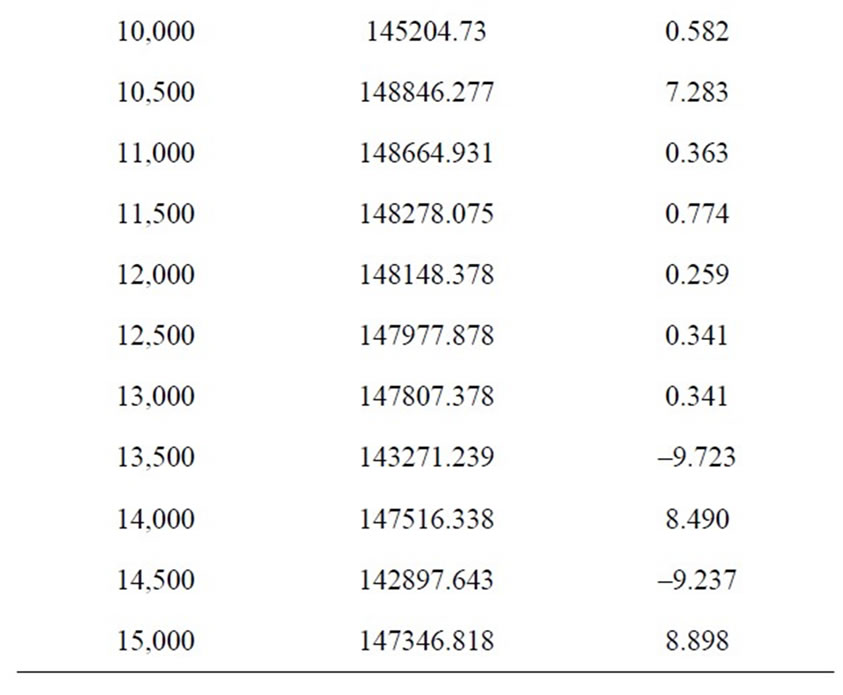
In this part of analysis value of cmin is fixed at 400 and also the priority order of 3-2-1 is remained the same. The value of cmax is changed over the accepted interval with steps of 500 and the resulted optimal values of objective functions are recorded. Table 1 shows the results of this analysis. In order to have a better observation of objecttive function’s behavior, cmax is increased even further up to 15,000 in which case, none of the telecenter capacities exceed the maximum value (This shows that for cmax > 15,000 the model works like an uncapacitated model).
Figure 6 shows the optimum values of the first objecttive function for different values of cmax. In this Figure, two different regimens of points could be seen. To better differentiate these two regimens, piecewise slopes of the lines connecting each two consecutive points are calculated and shown in Table 2. As can be seen from Table 2, the slopes for the lower values of cmax ( ) is more than ten times the slopes for the higher values of cmax (
 ). By approximating the curve in these two regions with straight lines their point of intersect is found to be
  which is realized at the transition point between the two regimens. The capacity at the location of transition is selected to be
 , which is the optimum value of cmax anticipated in Section 3.2. As mentioned earlier, values of cmax greater than this work against the equitable distribution of telecommuting opportunities and for lower values of cmax, the optimal z1 value increases (which is against the minimization objective).
4.3. Sensitivity Analysis on the Minimum Capacity (cmin)
In this step, cmax is set fixed at the select value from the
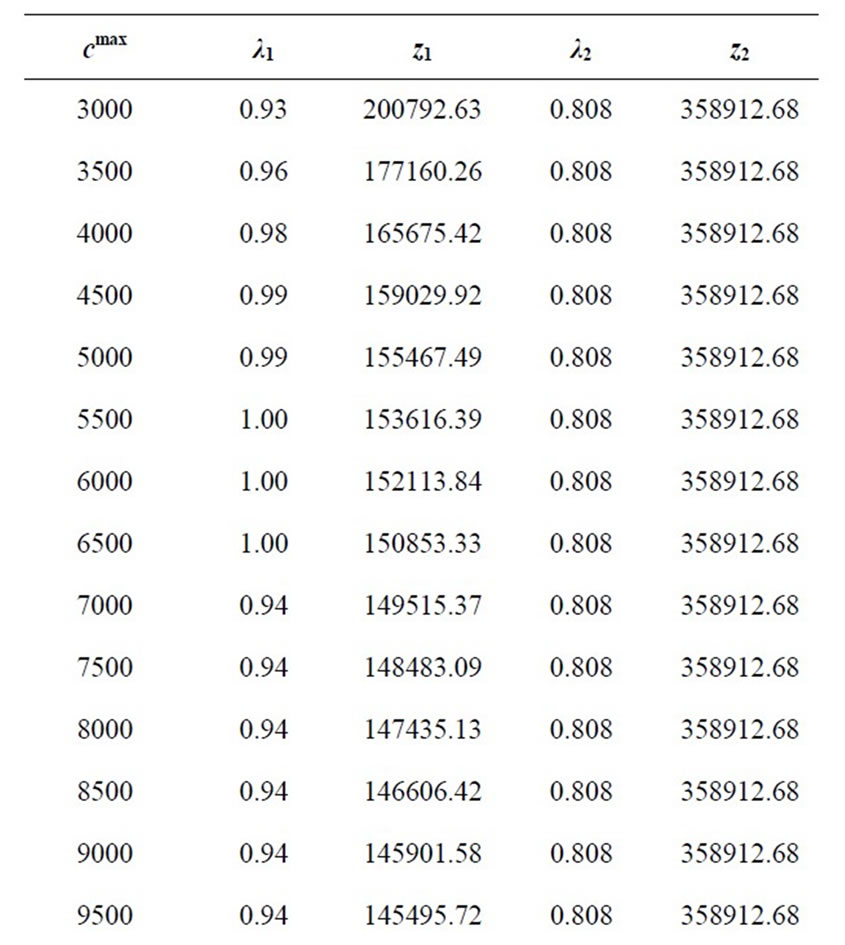
Table 1. Sensitivity analysis on cmax.
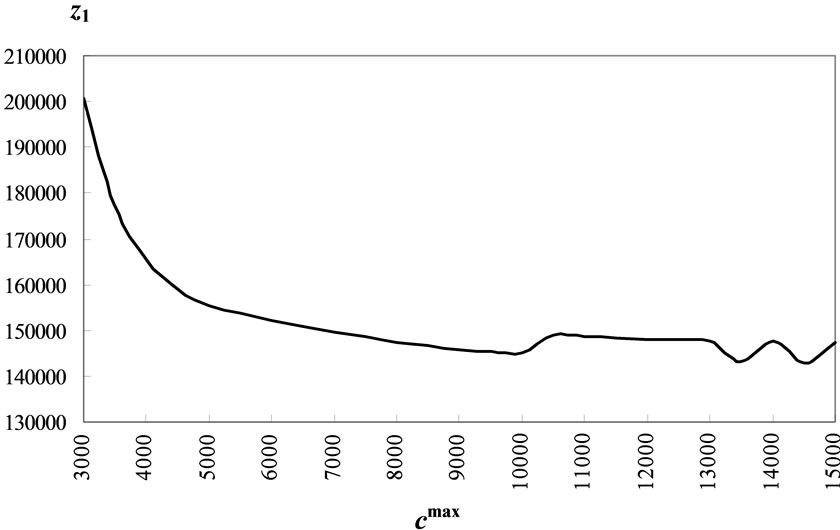
Figure 6. Sensitivity of the first objective to cmax.
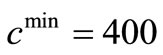
last section (cmax = 4500) and cmin is varied over the interval (0, 800) which found appropriate in Section 3.2. The value of cmin is increased with steps of 100 and the optimal objective values are recorded each time. The priority order of using closer telecenters is also the same as before (3-2-1). Table 3 and Figure 7 show the results of this sensitivity analysis.
Again two different regimens of points are distinguished and thus the piecewise slopes are calculated and shown in Table 4. For cmin > 400, the slopes are considerably greater than the values of cmin less than 400. Linearization of the curves to the right and left of cmin > 400 reveals that the transition between the two regimens happens at cmin = 400, which is the best choice for the minimum capacity of the telecenters. For greater values
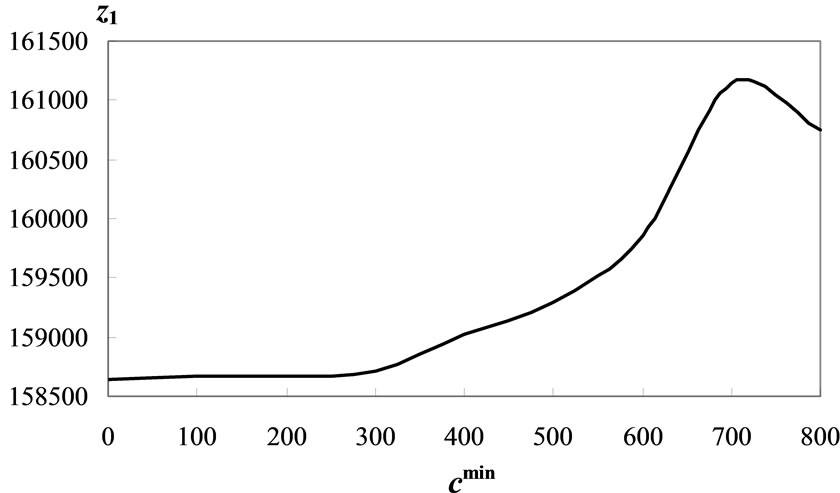
Figure 7. Sensitivity of the first objective to cmin.
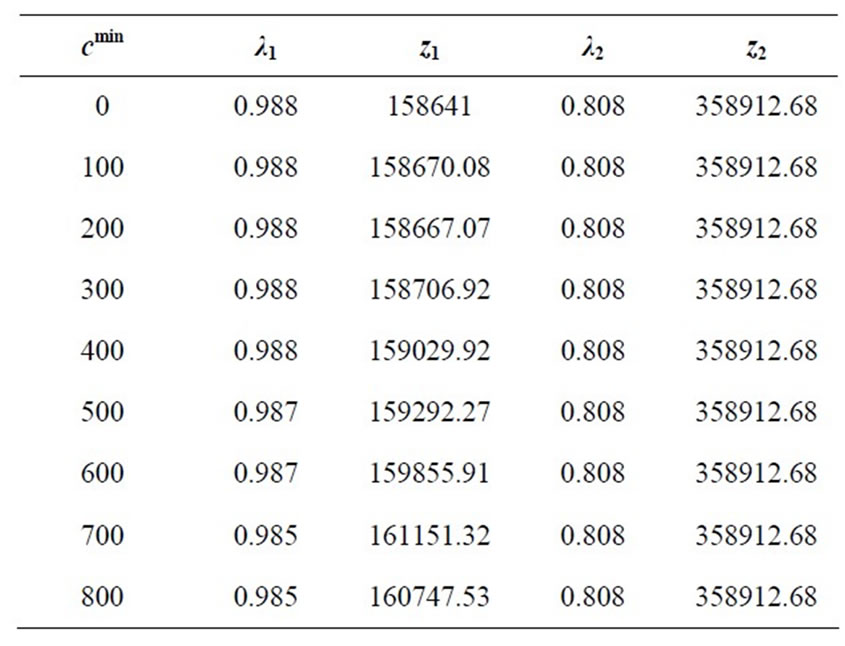
Table 3. Sensitivity analysis on cmin.
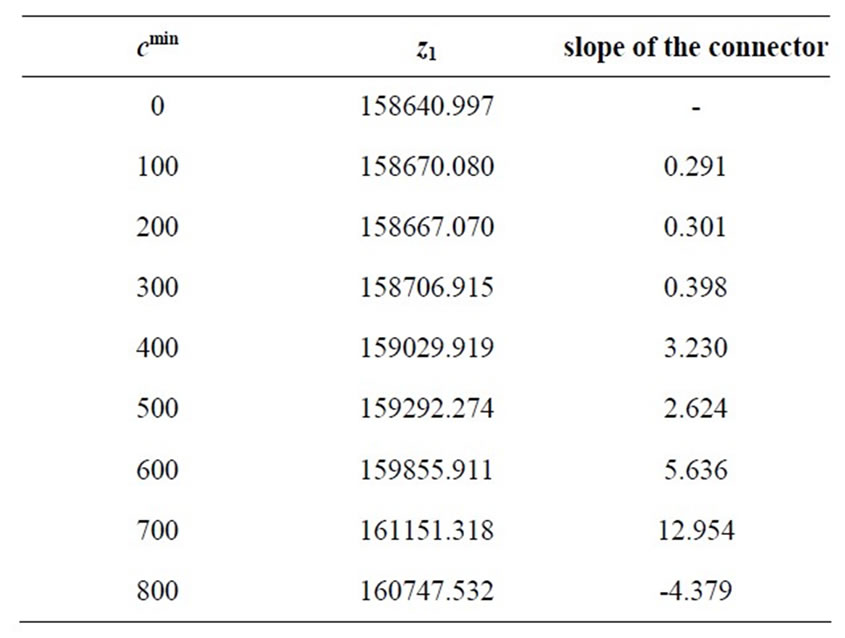
of cmin the optimal z1 value increases with a relatively large rate and less values of cmin are not as desireable from economic efficiency point of view.
4.4. Effect of Change in the Priority Order
Now cmax and cmin are fixed at the select values 4500 and 400, respectively, and the priority order of different groups of telecommuters in using closer telecenters is changed. The results of this analysis are shown in Table 5.
As the results show, by favoring 2 days/week telecommuters in using the closer TC opportunities, considerable reductions in the value of objective function z1 are achieved. Also the 2-3-1 order works slightly better than 2-1-3.
It must be mentioned however, that the appropriateness of the different priority orders is only compared based on the objective function values. To be more specific, the priority order which gives the lowest value of person-kilometers of TC trips is 2-3-1. Which order is the best among all, and which results in the most positive TC-impacts, are questions that need to be addressed by taking a lot more factors into consideration and are beyond this scope.
4.5. The Select Location Model
Based on the sensitivity analyses results, the following model is proposed for locating telecommuting centers over 53 divisions of the City of Tehran. In this model,  ,
,  , and the priority order used in the functional form of the objective z1 is 2-3-1.
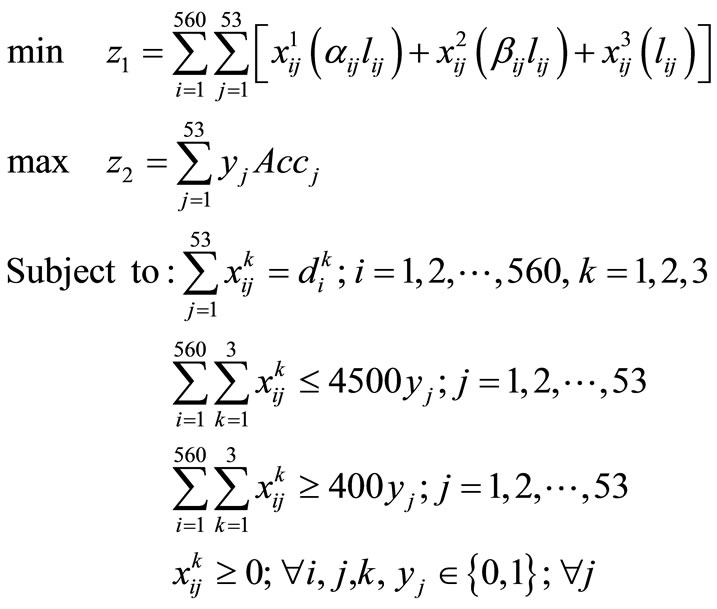 (25)
(25)
This model is solved by Chen and Tsai’s Preemptive FGP method and the optimum required capacities of each division is shown in Table 6. The optimal value of the first objective function reduces from  for the base model to
  in the select model and value of the second objective function remains the same (
 ).
).
5. Conclusions and Recommendations
In this paper, the problem of optimum deployment of telecommuting centers is studied. After the definitions, assumptions, and the framework of the paper were set, a mathematical location problem was proposed to find the optimal distribution of the telecenters among the different divisions of the City of Tehran. The objectives of the

Table 5. Effect of the priority order on the objective function values.
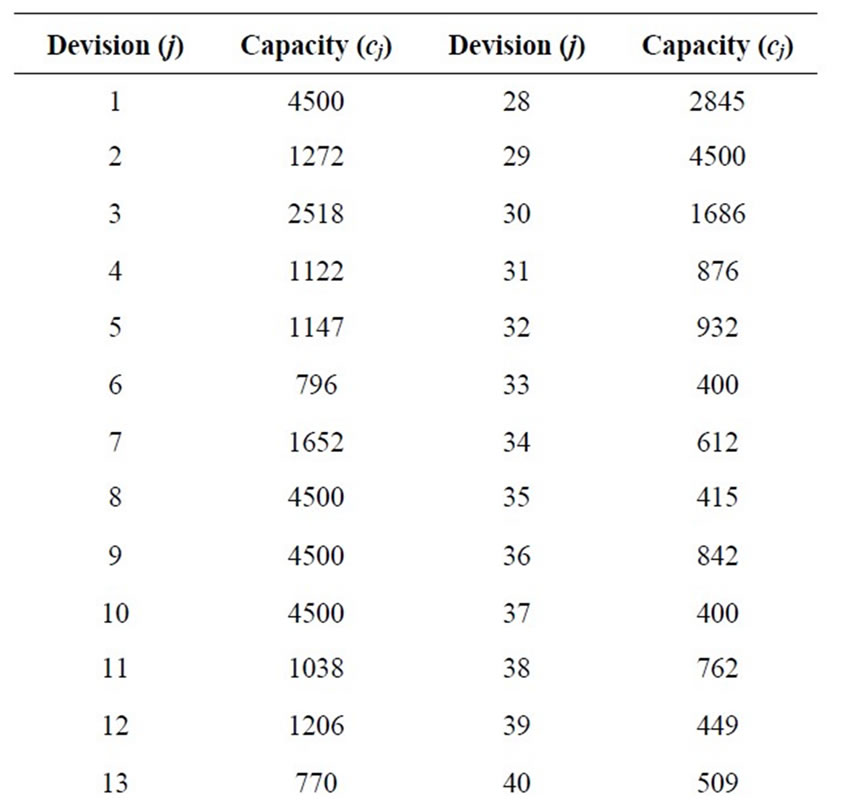
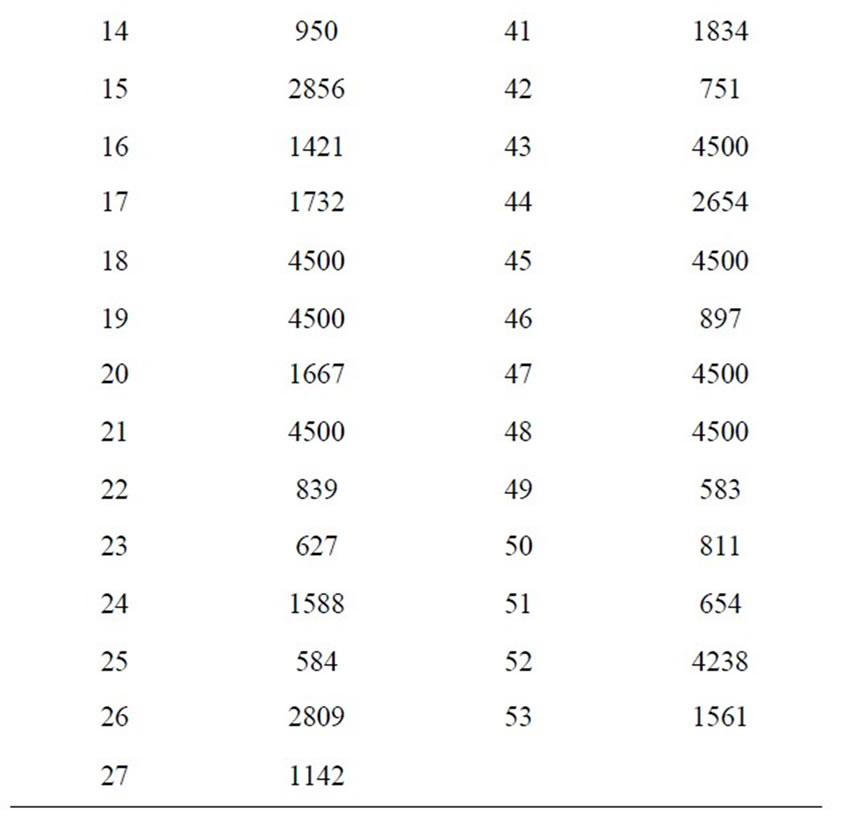
Table 6. Results of the optimum model.
optimization model proposed are minimizing the personkilometers of the daily telecommuting trips and maximizing the accessibility provided by the telecommuting opportunities. These objectives are defined to reflect the impacts of telecommuting in the preliminary phase of planning that Tehran’s telecommuting project is undergoing.
Results of the select proposed model show the optimal pattern for location-allocation of different groups of telecommuters to different telecenters. This optimal pattern of assignment follows a priority order which favors 2 days/week telecommuters followed by 3 and 1 day/ week telecommuters in taking advantage of the closer divisions. By following the proposed assignment pattern, it is expected to achieve the most benefits from implementing non-home based telecommuting program.
Similar to any other mathematical model of a real world problem, the proposed model in this study has some advantages along with some shortcomings. The proposed model is simple, easy to implement, and does not involve any complicated data requirements. It also considers the system-wide impacts of the telecommuting and is not specific to any particular group of stakeholders. Moreover, the proposed model is able to prioritize different groups of telecommuters depending on the number of days per week they telecommute. As some shortcomings of the model, it should be mentioned that the maximum and minimum capacity parameters are roughly estimated based on simple available census and geographic data. These two parameters are considered constant for all divisions which is not a completely realistic assumption. Furthermore, the notion of centroids of divisions may not be accurate and in this respect computational limitations could greatly affect size of the solution space.
To further improve or continue this study the following considerations are recommended:
• The problem of locating telecommuting centers could be further continued in the more detailed levels of planning. This allows more details to be modeled in the problem. For instance, to optimally locate telecenters over traffic zones, transportation system characteristics could contribute to the accessibility index definition; or the home-telecenter trip lengths can be estimated more accurately. Also, the real transportation network can replace the abstract network in case of which, the aerial (Euclidean) distances of travel can be replaced with more important measures of travel-time or travel-cost.
• To further develop the model, different types of telecenters (neighborhood vs satellite telecenters) and different classes of employees based on different job tasks may also be included which add to the complexity of the problem.
• Since provision of telecenters will probably change the telecommuting demand, a dynamic location model which accounts for the varied demand of telecommuting could be developed.
6. Acknowledgements
The authors hereby acknowledge the assistance of the Institute for Management and Planning Studies (IMPS) in Tehran for providing the employment information and the stated-preference telecommuting demand data. Also acknowledged is the financial and technical support provided by the Delaware Center for Transportation (DCT) at the University of Delaware and the Delaware Department of Transportation (DelDOT).
REFERENCES
- P. L. Mokhtarian, “Defining Telecommuting,” Transportation Research Report, Vol. 1305, 1991, pp. 273-281.
- R. Narasimhan, “Goal Programming in a Fuzzy Environment,” Decision Science, Vol. 11, No. 2, 1980, pp. 325-336. doi:10.1111/j.1540-5915.1980.tb01142.x
- E. L. Hannan, “Some Further Comments on Fuzzy Priorities,” Decision Science, Vol. 13, 1981, pp. 337-339. doi:10.1111/j.1540-5915.1982.tb00153.x
- R. Narasimhan and P. A. Rubin, “Fuzzy Goal Programming with Nested Priorities,” Fuzzy Sets and Systems, Vol. 14, No. 2, 1984, pp. 115-129. doi:10.1016/0165-0114(84)90095-2
- R. N. Tiwari, S. Dharmar and J. R. Rao, “Priority Structure in Fuzzy Goal Programming,” Fuzzy Sets and Systems, Vol. 19, No. 6, 1986, pp. 251-259. doi:10.1016/0165-0114(86)90054-0
- R. N. Tiwari, S. Dharmar and J. R. Rao, “Fuzzy Goal Programming—An Additive Method,” Fuzzy Sets and Systems, Vol. 24, 1987, pp. 27-34. doi:10.1016/0165-0114(87)90111-4
- L. H. Chen and F. C. Tsai, “Fuzzy Goal Programming with Different Importance and Priorities,” European Journal of Operations Research, Vol. 133, No. 3, 2001, pp. 548-556. doi:10.1016/S0377-2217(00)00201-0