Modern Economy
Vol.3 No.2(2012), Article ID:18147,5 pages DOI:10.4236/me.2012.32028
Analysing Economic and Financial Power of Different Countries at the End of the Twentieth Century
Department of Economics, Universidad de Navarra, Pamplona, Spain
Email: {jcmolero, fpujol}@unav.es
Received January 11, 2012; revised February 19, 2012; accepted February 28, 2012
Keywords: Composite Indexes; Economic Power; Text Analysis
ABSTRACT
This paper offers further evidence to “The Economist” index of economic power developed by Pujol (2002, 2003, and 2009). The original index is composite by construction and it gives information about year 2000, comparing the results with year 1990. Testing the robustness of the ranking of selected countries obtained by Pujol’s index; this paper applies the same methodology to two specific years: 1995 and 2001. The research tries to ascertain if the evolution of the ranking of countries among years 1990 and 2000 is not merely a chance. The number of times each country appears in tables and graphs of the different “The Economist” issues for year 1995 confirms the evolution of the index between 1990 and 2000. Data for year 2001 gives continuity and support to the ranking developed in year 2000. The data analyzed from this magazine make sense, because at the end it gives the same information that the one obtained from other more traditional and sophisticated ways. Empirical results tend to confirm that unconventional composite index can produce relevant data sets for scientists and practitioners.
1. Introduction
There are a large number of indexes trying to offer an approach to the relative economic and financial power of the countries by putting together some variables that directly reflect this power. The paper developed by Pujol [1], shows a completely different vision of how to rank countries using an index that is composite by construction, instead of use a priori weights of different components. This new indicator is named: “The Economist” index of economic power and it is offered for year 2000, giving some references to year 1990. The use of “The Economist” publication could be justified since it is probably one of the most worldwide prestigious review putting together a great quantity of different issues, mainly economic ones.
The goal of this paper is to give further evidence and validity to “The Economist” index. If the ranking is correctly constructed, the application of the index—see Pujol [1-3]—to other strategic years as 1995 and 2001 should support how each country moves in the ranking among 1990 and 2000. At this juncture, we considerer that any extension of the index beyond 2001 in order to establish any comparison with the period 1990-2001, will not be realistic. There are three main events that place the new century far away for any other. First, in the international political and economic context, the XXI century is marked from the beginning by the attacks of September 11, 2001 and others like Madrid, March 14, 2004. Second, we are immersed in a new era of global terrorism. Third, since 2008 we are facing probably the biggest global economics crisis after 1929. All these three factors will create severe distortions in the time series.
Dealing with the goal mentioned above, we explain first how “The Economist” index works. Second we offer the results of the application of the index to years 1995 and 2001. Third we show the right evolution of data from period 1990-2001. We finally conclude.
2. The Methodology of “The Economist” Index of Economic Power
“The common way to form a composite index is to sum up several different economic, commercial and financial variables using a priori weights. We reverse the strategy (...). The index proposed (...) is a composite index by its own composition, as the final value has emerged after taking into account a wide range of macroeconomic, financial, commercial and even social issues” (Pujol [1], pp. 151-152). In this sense, “The Economist” index uses a new method counting up the number of times each country appears in the tables and graphs of the different weekly issues of the magazine “The Economist”. Taking into account all the issues for years 2000 and 1990, a point is given for each country appearing in the correspondent table or graph. “The final index is elaborated by simply summing up the points each country obtains, and translating the original data into percentage value related to the overall number of graphs” (Pujol [1], p. 146). The selected tables and graphs include more than two countries, regional rankings are avoided, and some exclusive tables and graphs are not included.
The intuition behind the index is that putting together the times each country appears within a wide sample of economic and social subjects, coming from different sources and editorialists, we can obtain the relative economic strength of each one of the countries1.
“The Economist” index for year 2000 was obtained analyzing 194 tables and graphs included in the 51 numbers of “The Economist” review for that year. Then, 41 countries were selected. Figure 1 offers the ranking of countries for year 2000.
A possible caveat of the index could be its dependence on the sources of the different tables and graphs. In this sense, Pujol refuses this possibility pointing out: “First, the diversity of sources; second, the non-exclusive statistics for most of the cases” (see Pujol [1], p. 148).
The tables and graphs of year 2000 have covered a wide range of issues, being the most important ones: “economics”, “social”, “production”, and “public sector”. Other issues covered are “finance”, “firms”, “information technology”, “money”, “politics”, and “culture”. Using this information, Pujol also offers for year 2000 different sub-indexes related to: “economics”, “social”, “information technology”, etc. In this manner, moreover the general ranking, we can rank the countries taking into account the different issues2.
The intuitive results of “The Economist” index 2000 are finally contrasted with an econometric estimation. In other words, “The question we want to tackle now is whether or not this index is really by nature a composite index catching in some way the relative economic, commercial and financial strength of countries” (Pujol [1], p. 152). In this sense, it has been proposed an explanatory model3 of “The Economist” index based in three types of variables.
 (1)
(1)
The first variable is the GDP measured in million US dollars, as the key indicator of the relative economic strength of one country.
The variable “Eco” is trying to catch other economic aspects, including Trade (the openness of the economy), Capital Market, and HDI—Human Development Index, see United Nations Development Program [7]—(caching the social well doing of the country). In order to avoid the problem of multicolliniarity, the series have not been taken in absolute terms, as most of the “Eco” variables are strongly correlated with the GDP series.
Trying to catch if some countries are over represented in the series, two control variables have been incorporated: United States and Britain. A dummy variable for EU countries is also included.
The model contains observations for 33 over 41 selected countries. A cross-section analysis has bee applied using Weighted Least Squares see Table 1, taking the square root of country population as weight trying to avoid the potential problem of heteroskedaticity in the sample.
“The Economist” index 2000 appears positively and significantly linked with GDP, Capital Market, HDI, and EU; being not significant Trade, Britain and USA. Then,

Figure 1. The economist index 2000. Source: Pujol [3].
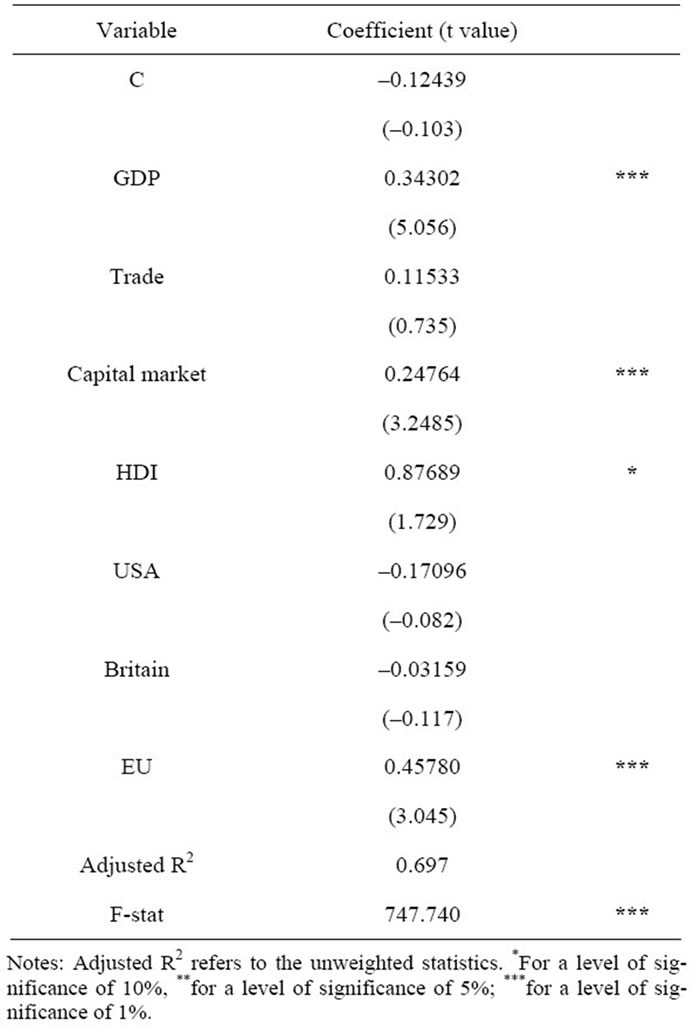
Table 1. Estimation of “The Economist” index by WLS.
“the results suggest that the index we propose behaves as a composite index reflecting the main economic variables usually taken into account to determine the economic strength of one country relative to others (...). A practical advantage is that the costs needed to obtain it are rather small, compared to similar indexes” (Pujol [1], pp. 154- 155).
3. The Economist Indexes 1995 and 2001
We have already explained at the beginning of this paper that our reference composite index chosen could be surprising and unconventional, but the econometric analysis has proved its validity. Nevertheless, if “The Economist” index were a good new measure of the economic power of the countries, data for other years would have to reinforce the information shown in years 1990 and 2000. Then, we have chosen year 1995 in order to confirm the evolution of data between 1990 and 2000, and year 2001 to strengthen the information coming from year 2000, as an ending point of a century.
Regarding year 1995, 191 tables and graphs have been identified following the same criteria used for years 1990 and 2000. Some of the issues covered by the figures confirmed the evolution shown by other years. For instance, if Information Technology issues increased from 1% in 1990 to 9.9% in 2000, the 1995 percentage confirms that evolution, because for this year Information Technology issues represented 7.8% of all tables and graphs. In fact, the increase of these issues, according to our index, is on line with the world while grow of economic power of this sector. We could define the nineties’ decade as a technological one. Any different result we had obtained in our index would have been shocking.
Figure 2 shows the evolution of “The Economist” Index 1995. The ranking presents a similar evolution that the one obtained for 1990 and 2000. The same developed countries are keeping the best positions in the rank, although USA obtains only 90 points, being closer to some powerful European countries. And countries from New Zealand to Hungary are reaching less than 20 points.
With respect to year 2001, surprisingly we found only 133 graphs and tables according to our methodology of analysis (we got 194 in 2000). Regarding issues for this year, again the evolution shown by some of them in 2000 continues in 2001, for example, Public Sector issues represented 22.5% of all issues (1990: 5.6%, 2000: 13.5%).
“The Economist” Index 2001 showed in Figure 3 also follows the pattern-established by 2000 index. Maybe the most relevant item, comparing with year 2000, is that European countries shorten the distance with respect to USA, which decreases its points from 97.9 in 2000 to 94.7 in 2001. Countries at the last positions in the ranking are mainly the same we found in year 2000.
4. Looking for a Further Evidence
Trying to compare “The Economist” Indexes 1990, 1995, 2000, and 2001, an important item is the good result obtained if we calculate the correlation coefficient among available data for these four years. Taking into account most of OCDE countries, the coefficients between data of the different years (2000, 1995 and 1990) with respect to 2001 data are, respectively: 0.987 (2001 & 2000), 0.976 (2001 & 1995), and 0.966 (2001 & 1990). Logically the coefficient is smaller as the time distance is bigger. Including data for other non OCDE countries like Chile, China, Brazil, India, Venezuela, Argentina, Hungary, South Africa, Israel, and Singapore, the coefficients are, respectively: 0.989 (2001 & 2000), 0.975 (2001 & 1995), and 0.963 (2001 & 1990).
As we pointed out above in this paper, the comparison of the evolution of “The Economist” Index from 1990 to 2001 is not really exact, because the average size of the tables has changed during these years. However, and based on the great correlation coefficients of the data, we can center the analysis in the information given in Table 2,

Figure 2. The economist index 1995. Source: Own elaboration, based on “The Economist”, 1995 issues [8].

Figure 3. The economist index 2001. Source: Own elaboration, based on “The Economist”, 2001 issues [8].
which shows just the change of the position of each country in the overall ranking. We will prove that, for most of the countries, 1995 data confirm the evolution of their ranking positions already analyzed between 1990 and 2000. In the same manner, the information for year 2001 confirms 2000 data and then it supports the econometric prove developed for year 2000.
Going deeper analyzing the information included in Table 2, we have to start pointing out that USA firmly leads the ranking for the four observations. Britain also confirms its economic growth, in fact the information of years 1995 and 2001 supports again the methodology of our paper, because this country passes from the thirth to the second position, which coindices with the growing economic situation during the nineties (it reached the fourth position in 1990 and the third in 2000). Our ranking also captures very well the German crisis, because Germany loses its permanent second position, dropping until the fourth one in year 2001. In the same manner, the ranking proves the fact that Spain is maintaining its economic growth in the middle of the economic crisis, reaching better positions every single year since 1990 and reaching the seventh position in 2001. France is during the period around the fifth position. The relatively better situation of Japan in 2001 (thirth position) is not caused by the economic growth of this country during this year, but by the lost of importance of Germany and France.
The ranking also confirms countries like Australia and Switzerland (reaching the eleventh and thirteenth positions respectively in 2001) as losers, and countries like Belgium, Austria, and Norway as more stable economies.
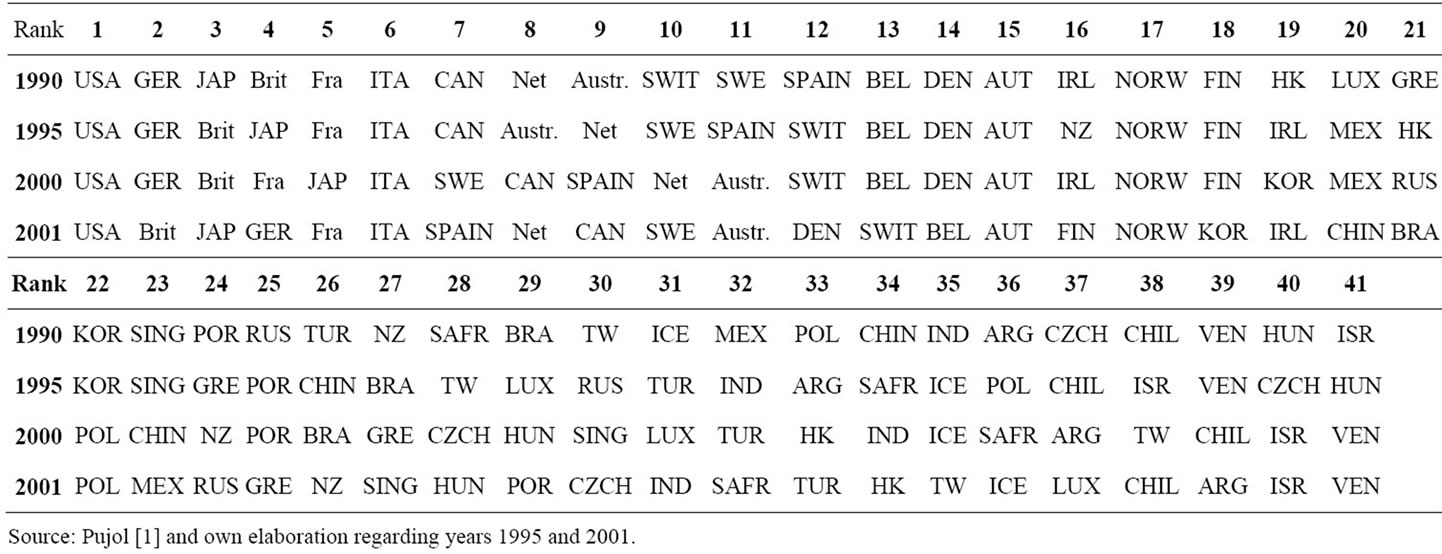
Table 2. Ranking evolution from 1990 to 2001: Further evidence.
Again, 1995 data, and specially the analysis of the year 2001, confirm that small or peripheral European countries like Portugal, Greece, Iceland, Turkey, and Luxembourg tend to lose importance. The opposite happens to other emerging economies like Brazil, Hungary or Poland. Special mention deserve China, which increases its position during all the period, reaching the twentieth place in 2001 (twenty-third in 2000), coming from the thirty-fourth position in 1990 and the twenty-sixth en 1995. This evolution really confirms China as an emerging economic power. Also the case of India is a good example of an emerging economy doing better and climbing positions en the table among 1990 and 2001. Finally, 2001 data confirm the going down situation of Argentina, since this country passes from the thirty-seventh position in 2000 to the thirty-ninth in 2001.
5. Conclusions
The main goal of this paper was to explore a new methodology trying to capture the information beyond the data offered by “The Economist” Journal. The application of “The Economist methodology” to other signifycant years like 1995 and 2001 enlightens the results captured by Pujol (2009) who applied the same methodology for years 1990 and 2000.
In this sense, and giving the significant econometric results obtained for year 2000, it is not just a coincidence that the index works very well for the all period 1990 - 2001 analyzed in this paper. What mass media announces makes sense, because it is giving the same information that the one obtained from other more traditional ways. In other words, what we call unconventional composite index, derived from “The Economist” tables, offers accurate information about what is happing in each country, in each culture.
REFERENCES
- F. Pujol, “An Unconventional Composite Index of International Influence,” Journal of Comparative Policy Analysis, Vol. 11, No. 1, 2009, pp. 145-157. doi:10.1080/13876980802648342
- F. Pujol, “La Presencia Internacional de España a Través de the Economist 1975-2000,” Boletín Económico de ICE, No. 2721, 2002, pp. 9-17.
- F. Pujol, “La Posición Internacional de España Según The Economist,” Boletín de Estudios Económicos, Vol. 83, No. 180, 2003, pp. 543-559. doi:10.1080/13876980802648342
- The Economist, “Rrrrrrrecession?” The Economist, 16 July 1998.
- The Economist, “The R-Word,” The Economist, 5 April 2001.
- The Economist, “The Recession Index. Don’t Mention That Word,” The Economist, 28 June 2001.
- United Nations Development Program, “Human Development Report 2001,” Oxford University Press, Oxford, 2001.
- The Economist, All the Issues for Years 1995 and 2001.
NOTES
1For further information regarding other indexes obtained in a similar way than “The Economist” index, see Pujol [1], pp. 146 and 147. Also The Economist [4-6] elaborates its own indexes in this sense.
2For further information referring to the different issues and the sub-indexes, see Pujol [1], pp. 147-151. Especially clear are Figure 3 and Table 1 in those pages.
3We include in this paper a brief summary of the econometric model. For further information see Pujol [1], pp. 151-155.