Journal of Biophysical Chemistry
Vol. 3 No. 2 (2012) , Article ID: 19448 , 10 pages DOI:10.4236/jbpc.2012.32021
Kinetics and mechanisms of glucose absorption in the rat small intestine under physiological conditions
![]()
1I. P. Pavlov Institute of Physiology RAS, St. Petersburg, Russia; *Corresponding Author: gruzdkov@pavlov.infran.ru
2Institute of Cytology RAS, St. Petersburg, Russia
Received 15 March 2012; revised 30 March 2012; accepted 14 April 2012
Keywords: Membrane Hydrolysis; Glucose Transport; SGLT1; GLUT2; Small Intestine; Mathematical Modeling
ABSTRACT
Previous studies have shown two components of glucose absorption in the small intestine: a secondary active transport through SGLT1, and unsaturated component, recently attributed mainly to the facilitated diffusion through GLUT2, but the relationship between these two components under physiological conditions remains controversial. In chronic experiments on nonanesthetized rats we investigated for the first time the kinetics of maltose hydrolysis and glucose absorption in the isolated loop of the small intestine in a wide range of maltose and glucose concentrations (25 - 200 mmol/l glucose). The processes were simulated on mathematical models which took into account the current views about mechanisms of hydrolysis and transport of nutrients and geometric characteristics of the intestinal surface. The results of chronic experiments and mathematical simulation have shown that under the close to physiological conditions the glucose transport mediated by SGLT1 is the main mechanism of its absorption in comparison with the unsaturated component. This was demonstrated not only at low, but also at high substrate concentrations. We conclude that correct evaluation of the relative contribution of different mechanisms in glucose transport through the intestinal epithelium requires taking into account the geometric specificities of its surface.
1. INTRODUCTION
In accordance with the classic view, glucose is transported across the brush border membrane by Na+/glucose co-transporter SGLT1, while the facilitated diffusion mediated by GLUT2 provides the output of glucose from enterocytes across the basolateral membrane into the extracellular space [1-7].
The results of numerous experiments in vivo have also revealed the existence of unsaturated (“diffusion”) component of glucose absorption, which may exceed greatly the secondary active transport through SGLT1 at high substrate concentrations [6,8,9].
To explain an importance of the unsaturated component J.R. Pappenheimer [8] suggested the “paracellular” concept of glucose absorption in the small intestine, which was not supported [10,11].
According to the recent evidences, the transporter GLUT2 may be transiently inserted into the apical membrane of enterocytes. Along with SGLT1, it participates in glucose transfer across this membrane [9,12]. Moreover, it is assumed that at high carbohydrate loads, due to saturation of SGLT1 transporters, the facilitated diffusion via GLUT2 behaves as the unsaturated component and becomes the predominant mechanism of glucose absorption in the small intestine [9,13].
But, this assumption is not indisputable.
First, the assumption is based on the results of in vitro or in vivo experiments on anesthetized animals. However, it has been shown previously [14-16], that acute experiments in vivo are far from physiological conditions because of the effect of anesthesia and surgical trauma.
Second, current estimations of the relations between the “active” and the “diffusion” components of glucose absorption do not take into account geometric features of the digestive-absorptive surface of the small intestine in mammals. Meanwhile, a complex architecture of the intestinal surface with the pre-epithelial layer may significantly affect the kinetics of hydrolytic and transport processes [17-19].
In this work, to evaluate the relative roles of “active” and “passive” components of glucose absorption in the small intestine, we investigated for the first time the kinetics of hydrolysis of maltose and glucose absorption in the isolated loop of the small intestine in chronic experiments on nonanaesthetizes rats in a wide range of the substrate concentrations (up to 200 mmol/l glucose). The experimental data were analyzed on the mathematical model with commonly used approximation of the intestinal epithelium in the form of a smooth surface with adjacent diffusion layer [4,6,7,11], and on the original model, which took into account geometric specificities of the intestinal surface [19].
2. MATERIALS AND METHODS
2.1. Chronic Experiments
The experiments were conducted on five adult Wistar rats (male, weight 180 - 300 g) with an isolated ThiryVella segment of the proximal jejunum (L ~ 20 cm) as described previously [14-16]. The surgery technique, preparing of the animals for the experiments, as well as the experimental conditions were similar to the original method with slight modifications. In particular, test perfusions of the isolated segment usually started 7-9 days after the surgery, when the symptoms of the “post-operative disease” had practically disappeared. The operated rats were used in chronic experiments in 2 - 3 weeks after the surgery.
The Ethical Guidelines issued by the Committee of the International Association for the Study of Pain have been followed [20]. All experimental procedures were in full compliance with The European Council Directive (86/ 609/EEC) and approved by The Ethical Committee of the Pavlov Institute of Physiology, RAS (Resolution No 1, January 16, 2012).
The isolated intestinal loop of the satiated animals was perfused at velocity of 0.3 ml/min with solutions of maltose (“Sigma Chemical Co.”, USA) at the initial concentrations of 12.5, 25.0, 50.0 and 100.0 mmol/l (of glucose), or with solutions of glucose (“Sigma Chemical Co.”, USA) at the initial concentrations of 25.0, 50.0, 100.0, and 200 mmol/l. All solutions were prepared using the Ringer solution, which consisted of: NaCl 120 mmol/l, KCl 5.6 mmol/l, CaCl2 2.2 mmol/l, NaHCO3 1.8 mmol/l.
In contrast to previously performed experiments [16], mannitol was not added to the substrate solutions. Thus, the initial molarity of the solutions was variable: the higher molarity was the case with glucose concentration 200 mmol/l and the lowest—in the case of maltose solution 12.5 mmol/l.
Concentrations of free glucose (G-glucose) and the sum of concentrations of free glucose and glucose comprised in maltose (M-glucose) were determined by the glucose oxidase [21] and anthrone [22] methods.
The rates of maltose hydrolysis ( ), free glucose absorption (
 ), maltose-released glucose absorption (
 ), and water absorption (Jw), were determined using the following known formulas:
 = CМ,in · vin – (CM+Gl,out – C Gl,out) · vout ,
 = CМ,in· vin – CМ+Gl,out · vout,
 = CGl,in· vin – CGl,out · vout,
 = vin – voutwhere CМ,in is maltose concentration in the infusate (mmol/l of glucose); CGl,out is glucose concentration in the outflowing perfusate, determined by the glucose oxidase method (mmol/l); CM+Gl,out is the sum concentration of sugars in the outflowing perfusate, determined by the anthrone method (mmol/l of glucose); vin is the rate of infusion (ml/min); vout is the rate of the outflowing perfusate (ml/min).
Perfusions with maltose solutions were performed sequentially, starting from the minimal concentration in a given experiment. Upon reaching steady state (15 min after a start of each interval of perfusion) for two or three 10-minute intervals, samples for subsequent biochemical analysis were taken. The volumes of the samples were also measured to calculate the rate of absorption (secretion) of water in the isolated intestinal loop.
2.2. Mathematical Modeling
We have considered the isolated intestinal loop as a tube into which a substrate (maltose or glucose) solution enters at a constant rate. We have assumed that the structural and functional characteristics of the isolated loop are uniform throughout its length. The radial gradients of concentrations of the substrates (maltose and glucose) are absent due to intensive mixing of the luminal content. There is a pre-epithelial (unstirred) layer between the digestive-absorptive surface and the lumen of the tube. The substances cross the layer by diffusion and by convection (solvent drag).
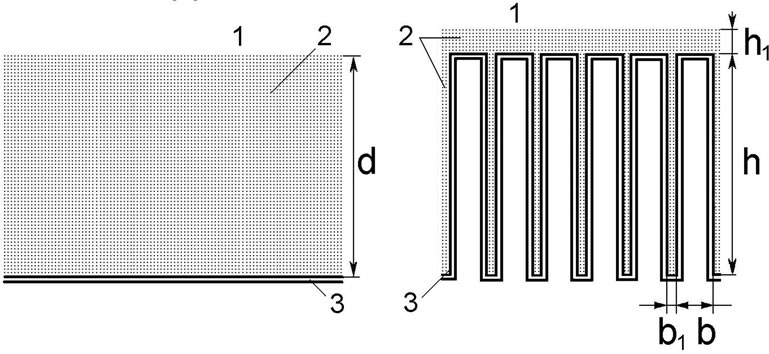
We have used two approximations of the complex surface of the intestinal epithelium (Figure 1): a smooth surface with adjacent diffusion layer [4,6,7,11] (Figure 1(a)), and a folded surface with a diffusion layer between the folds, and partly over them (Figure 1(b)).
As an example, the folds have been taken rectangular in cross section, with a height of 300 mm, a width of 70 mm, and the distance between the folds of 30 mm, in accordance with the actual size of the intestinal villi in the isolated loop of the rat small intestine in chronic experiments.
The main assumptions, common for both approximations of the model, are the following:
1) Membrane hydrolysis of maltose is described by the Michaelis-Menten equation:
 , (1a)
where Jh is the rate of maltose hydrolysis per cm of intestinal length (mmol∙min–1∙cm–1); V is the maximal rate of hydrolysis per cm of intestinal length (mmol∙min–1∙cm–1); Sm is maltose concentration at the apical membrane of the
(a) (b)
(a) Smooth surface; (b) Folded surface (imitation of the villous surface); 1—intestinal lumen; 2—pre-epithet-lial (“unstirred”) layer; 3—digestive-absorptive surface; d = 62 μm—a thickness the pre-epithelial layer; h = 300 μm—a height of the folds; h1 = 5 μm—a thickness of the pre-epithelial layer above the folds; b = 70 μm—a width of the folds; b1 = 30 μm—a distance between the folds.
Figure 1. Schematic representation of two approximations of intestinal digestive-absorptive surface.
enterocytes (mmol/l); Km is Michaelis constant for maltose hydrolysis (mmol/l).
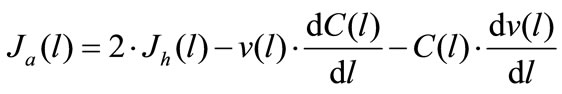
2) Absorption of glucose (both free, and released from maltose hydrolysis) is mainly determined by permeability of the apical membrane of the enterocytes and can be described by the well-known equation [4,6]:
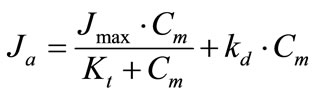 (1b)
(1b)
where Ja is the rate of glucose absorption per cm of intestinal length (mmol∙min–1∙cm–1); Cm is glucose concentration at the absorptive surface (mmol/l); Jmax is the maximal rate of glucose active transport mediated by co-transporter Na+ and glucose (SGLT1) per cm of intestinal length (mmol∙min–1∙cm–1); Kt is Michaelis constant for glucose active transport by SGLT1 (mmol/l); kd is a constant of unsaturated component of glucose transport (cm2·min–1); this component includes both the passive diffusion [4,6], and the facilitated diffusion mediated by GLUT2 [9], which in the first approximation may be considered as proportional to glucose concentration at the apical membrane of enterocytes, Cm.
3) Free glucose, and glucose released from maltose hydrolysis, constitutes a common pool and they are transported across the apical membrane of enterocytes via the same transporters [16,23].
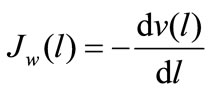
4) The rate of water absorption in the small intestine depends on molarity of the luminal content, and increases during glucose absorption [24]. Thus, the total transepithelial water flux (Jw ) is considered in the model as a sum of three components:
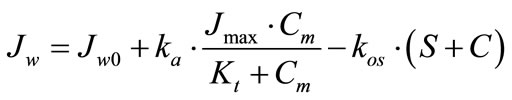 (2)
(2)
where Jw0 is a component of the water flux, which does not depend on the presence of maltose and glucose in the perfusate (ml∙min–1∙cm–1); ka∙Jmax∙Cm/(Kt + Cm) is a component of water flux, which depends on the active glucose transport mediated by SGLT1 (ml∙min–1∙cm–1); kos ∙ (S + C) is a component of the water flux, which depends on the contribution of maltose and glucose in a total molarity of perfusate (μl∙min–1∙cm–1); S and C are the concentrations of maltose and glucose in the intestinal lumen, respectively (mmol/l); ka is a constant coefficient (cm3∙ mmol–1); kos is a constant coefficient (cm5∙μmol–1∙min–1).
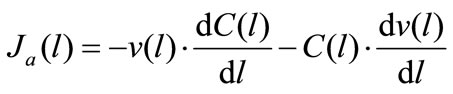
Hydrolysis of maltose in the isolated loop of the small intestine, as well as absorption of glucose and water, can be described by a system of ordinary differential firstorder equations:
1) Maltose hydrolysis:
 (3a)
(3a)
2) Absorption of glucose released from maltose hydrolysis:
 (3b)
(3b)
3) Free glucose absorption:
 (3с)
(3с)
4) Fluid absorption:
 (3d)
(3d)
where Jh(l) and Ja(l) are the rates of maltose hydrolysis and glucose absorption, respectively, at a distance l from the beginning of the isolated loop of the intestine (mmol∙ min–1∙cm–1); S(l) and C(l) are concentrations of maltose and glucose (free, or released from maltose hydrolysis), respectively, at a distance l from the beginning of the isolated segment of the intestine (mmol/l); Jw(l) is the rate of water absorption at a distance l from the beginning of the isolated segment of the intestine (ml∙min–1∙ cm–1); v(l) is the volume rate of perfusion at a distance l from the beginning of the isolated segment of the intestine (ml∙min–1).
5) Maltase activity and capacities of the active and the passive transport of glucose are evenly distributed along the isolated loop of the intestine.
Besides, we made some additional assumptions for each version of the model.
The model with the approximation of a smooth surface. The digestive-absorptive surface is separated from the lumen by the diffusion layer of uniform thickness (permeability) (Figure 1(a)). The rates of maltose (JmPL) and glucose (JgPL) transfer through the pre-epithelial layer of the small intestine can be described by the following equations [7,16]:
 (4a)
(4a)
 (4b)
(4b)
where S and C are concentrations of maltose and glucose, respectively, in the intestinal lumen (mmol/l); Sm and Cm are concentrations of maltose and glucose, respectively, at the absorptive surface (mmol/l); Jw is the rate of water absorption (ml∙min–1∙cm–1); k1m and k1g are the rates of diffusion of maltose and glucose, respectively, across the pre-epithelial layer (cm2∙min–1); k2m and k2g are coefficients of maltose and glucose transfer, respectively, across the pre-epithelial layer by convection with water flux (dimensionless).
Taking into account the assumptions 1 ÷ 4 (formulas 1a, 1b and 2), as well as the fact that at each l point Jh (l) = JmPL (l) and Ja (l) = JgPL (l), by solving Eqs.3 one can determine the rates of maltose hydrolysis and released glucose absorption in the isolated loop of the intestine, the rate of water absorption (secretion), as well as the longitudinal distribution of maltose and glucose (free, or released from maltose) in the intestinal lumen and at the digestive-absorptive surface.
The model with the approximation of a folded surface. Concentration gradients of the substrates between the villi in a direction perpendicular to their lateral surface are assumed to be small compared with their concentration gradients along the villi.
The activities of maltase and glucose transporters are unevenly distributed on the villus. The maximal activities of disaccharidases are localized near the top of intestinal villi, with minimal values near the crypts [25]. A similar distribution along the crypt-apical axis has been observed for glucose transporters SGLT1 [26,27].
For this model we hypothesized, analogous forms of distribution along the folds for the enzyme activity (Eq.5 (a)) and for the transporter (Eq.5(b)).
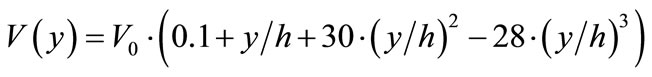 (5a)
(5a)
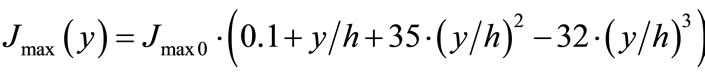 (5b)
(5b)
where V(y) and Jmax(y) are the enzyme and transport activities, respectively, at a point y; y is a distance from the base of the folds (0 ≤ y ≤ h); h—is a height of the folds; V0 and Jmax0 are adjustable constants.
We assumed also, that a capacity of the unsaturated component of glucose transport (simple diffusion + facilitated diffusion via transporter GLUT2) is constant along the folds.
In the second version of the model, concentrations of maltose and glucose in radial direction above the folds and between them at each elementary segment dl have been calculated using the following differential equations:
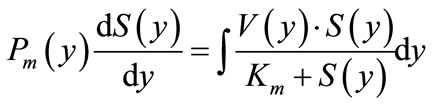 (6a)
(6a)
 (6b)
(6b)
where S(y) and C(y) are concentrations of maltose and glucose, respectively, at a distance y from the base of the folds (mmol/l);. V(y) and Jmax(y) are values of maximal rates of maltose hydrolysis and glucose transport, respectively, at a distance y from the base of the folds (mmol∙ min–1∙cm–1); Pm(y) and Pc(y) are values of diffusion permeability the pre-epithelial layer for maltose and glucose, respectively, at a distance y from the base of the folds (cm2∙min–1); Km and Kt are Michaelis constants for maltose hydrolysis and glucose transport, respectively (mmol/l); kd is a constant of unsaturated component of glucose transport (cm2∙min–1).
In solving the equations describing the radial distribution of the substrates along the folds, according to the computer program, first of all are assigned the approximate values of maltose and glucose concentrations at the entrance of the intestinal tube (l = 0) on a base of the folds (y = 0). Then, after the numerical integration of the equations 6a and 6b, the calculated concentrations of these substrates in the lumen of the tube and their initial concentrations at the entrance of the tube are compared. When the difference between these values exceeds the permissible level (less than 1% of the initial concentration of maltose and less than 2% of the maximal concentration of glucose), in accordance with the computer program, new values of the substrate concentrations at a base of the folds are automatically assigned with a decreased increment. The process is repeated as long as the difference between the calculated and initial concentrations in the lumen of the tube becomes less than the specified permissible level. Then, a numerical integration was performed with Eqs.3(a)-(d), which describe the distribution of the substrates (maltose and glucose) along the intestinal tube. Testing of the program has shown that if the steps of integration are 1% of the folds height and 0.5% of the length of the tube, respectively, a further reduction of the steps does not significantly affect the results of calculations.
3. RESULTS
3.1. Absorption Free Glucose
Figure 2 shows the kinetics of glucose absorption in the isolated loop of the rat small intestine during its perfusion with solutions of free glucose in chronic experiments. Black circles represent the observed rates of glucose absorption (Mean ± SEM) from the solutions with concentrations 25.0, 50.0, 100.0, and 200 mmol/l (which correspond to the logarithmic mean concentrations in the lumen of the intestinal loop of about 12.5, 30.0, 75.0, and 155 mmol/l, respectively).
As one can see, the rate of glucose absorption at the lowest substrate concentration in the infusate (25 mmol/l) was 6.3 ± 0.35 mmol∙min–1, while in the range of high glucose concentrations (50.0 - 200 mmol/l), where the
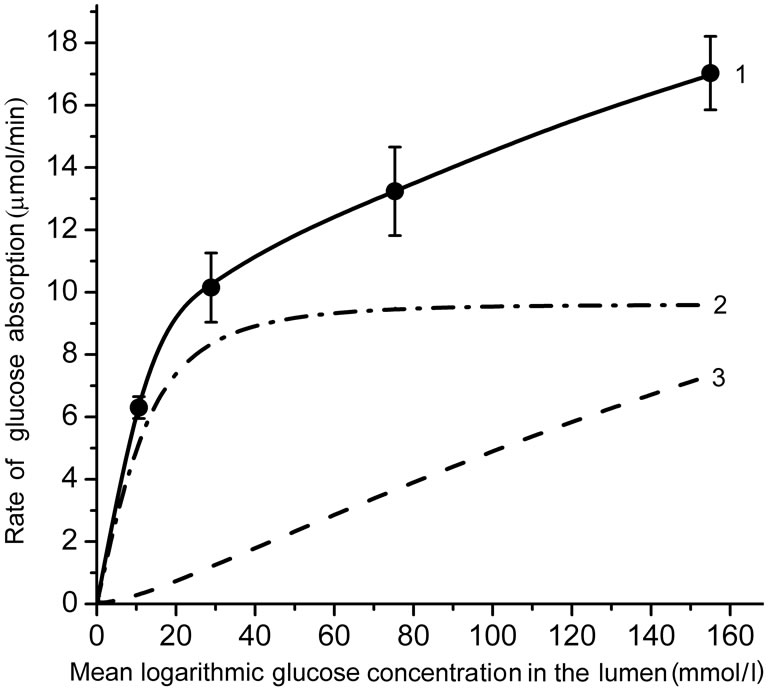 (a)
(a)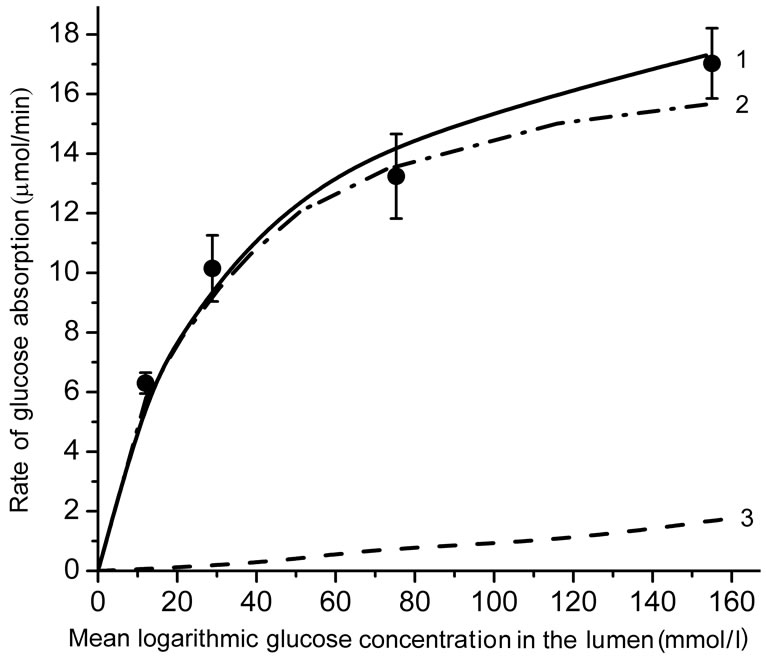 (b)
(b)
(a) an approximation of the absorptive surface of the small intestine as a smooth surface with an adjacent diffusion layer; (b) an approximation as a folded surface. Circles denote experimental data (Mean ± SEM, N = 5). Curves are the results of modeling; 1—total absorption of glucose; 2—the “active” transport component; 3—the unsaturated transport component. Parameters of the model are presented in the Tables 1 and 2.
Figure 2. The kinetics of glucose absorption in the isolated loop of the rat small intestine (experimental data and results of mathematical modeling).
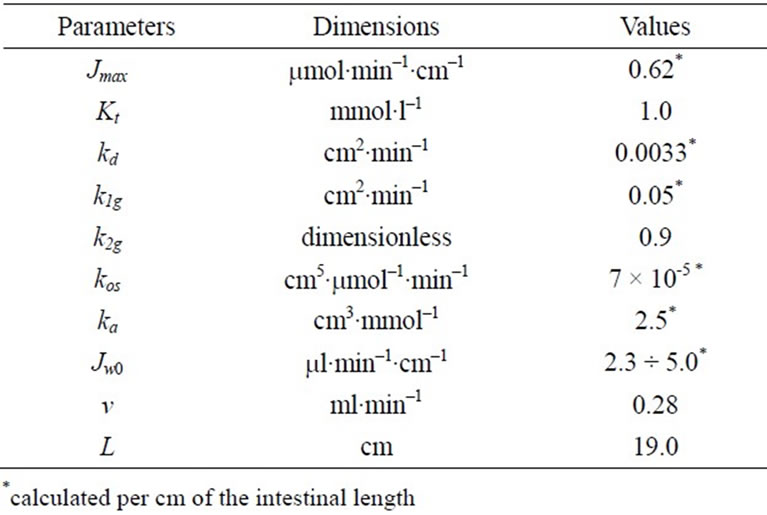
Table 1. Parameters of the model with the approximation of a smooth surface.
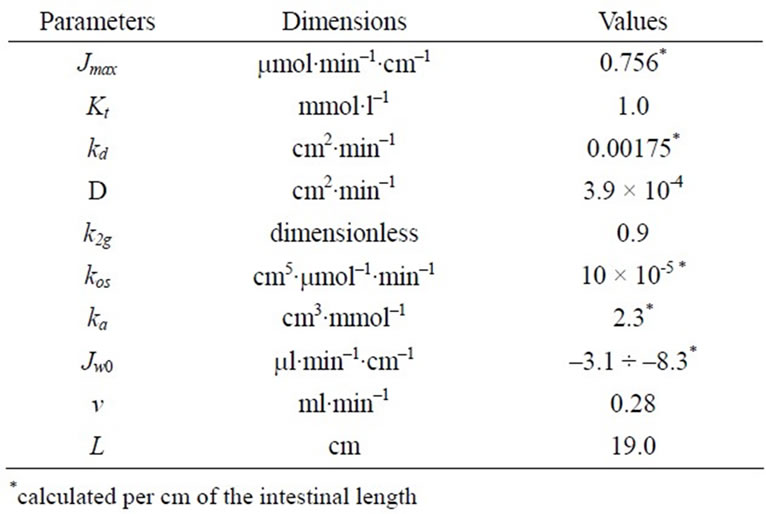
Table 2. Parameters of the model with the approximation of a folded surface.
transporters SGLT1 are believed to be saturated [8,9], the rate of absorption increased almost linearly from 10.15 ± 1.11 to 17.03 ± 1.18 mmol ∙ min–1.
The results of mathematical simulation are shown on Figure 2(a) and (b). Parameters of the model with approximation in the form of a smooth surface are shown in Table 1. Their values were generally in the range of values that were determined previously in chronic experiments on rats [14, 16]. The value of Kt was between 0.2 - 1.0 mM [2,5] and 2.0 - 5.0 mmol/l [6,7,9].
As it can be seen (Figure 2(a)), the model with the approximation of the intestinal surface in the form of a smooth surface with the adjacent pre-epithelial layer corresponds well (curve 1) with the experimental data (correlation coefficient r = 0.999). The model predicts an almost complete saturation of the active component of glucose transport (curve 2) when substrate concentration in the lumen is above 40 mmol/l. The contribution of the unsaturated component increases with increasing concentration of glucose in the intestinal lumen (curve 3) and becomes close to the contribution of the active component only at high substrate concentrations. The model with the approximation of a folded surface may also satisfactorily reproduce (r = 0.997) the corresponding experimental data (Figure 2(b), curve 1). The model parameters are presented in Table 2. The values of Pc(y) in equation 6(b) were calculated assuming that the diffusion coefficient of glucose in the space between the folds, and above them (D) is equal to 3.9 × 10⁻⁴ cm2∙min–1 [4,7].
It is important to emphasize that in this version of the model, the value of Kt = 1.0 mmol/l has been taken the same as in the model with approximation of a smooth surface.
However, the component of active transport (curve 2) does not reach complete saturation even in the range of high concentrations of the substrate, and the unsaturated component (curve 3) is only a small fraction of the total absorption: 9.5% at 200 mmol/l of free glucose in the infusate. In both versions of the model, values Jw0 have been slightly adjusted in the range of –3.1 - –8.3 ml/min per cm to match the rates of water absorption which were observed in the chronic experiments.
3.2. Maltose Hydrolysis and Glucose Absorption
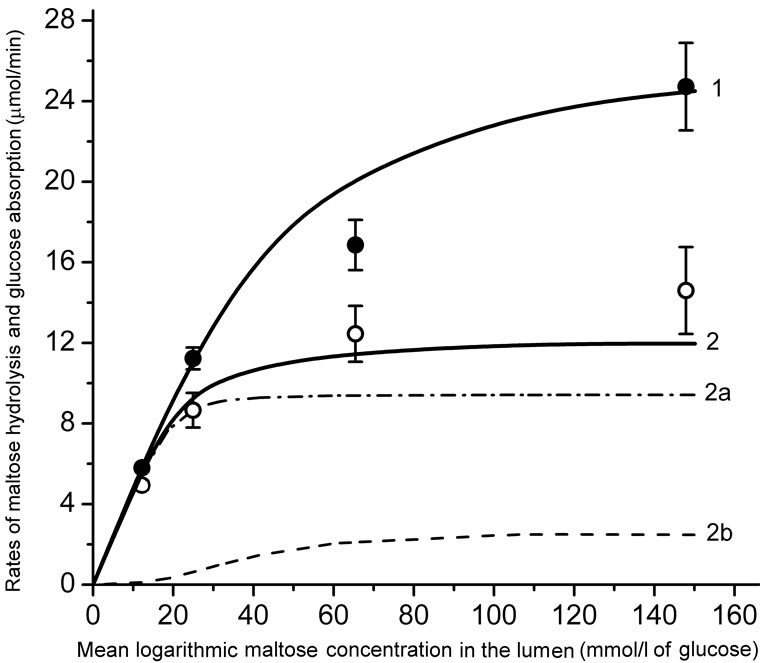
The experimental data are presented in Figure 3. It is important to note, that there was virtually no saturation in the rate of maltose hydrolysis (black circles, Mean ± SEM) even in the range of high concentrations of the substrate in the lumen (35 - 70 mmol/l), which exceeds by many times the value of Km for maltase: 3.3 - 3.7 mmol/l [7,18]. The rate of released glucose absorption did not also reach full saturation (Figure 3, open circles, Mean ± SEM).
Results of modeling of these processes for two variants of approximation of digestive-absorptive surface of the small intestine are presented as curves in the Figure 3.
In both versions of the model, Michaelis constant (Km) for maltose hydrolysis was taken equal to 3.7 mmol/l [7, 16,18].
Using an iteration technique, we found that for hydrolysis of maltose the best match with the corresponding experimental data was achieved at V = 0.690 mmol/min per cm of the isolated loop in the model with the approximation of a smooth surface (Figure 3(a), curve 2) and at V = 0.955 mmol/min per cm—in the model with the approximation of a folded surface (Figure 3(b), curve 2). These values correspond to the estimates obtained previously in similar chronic experiments on rats [16]. It was also assumed that in the first case (variant A) the diffusion constant in the pre-epithelial layer for maltose (k1m) was 0.035 cm2 ∙ min–1,  times smaller than the diffusion constant for glucose (k1g). In the second case (variant B) the diffusion coefficient D for maltose was taken 2.76 × 10⁻⁴ cm2∙ min–1, i.e.
  times smaller than for diffusion coefficient for glucose [7]. It is important to
 (a)
(a)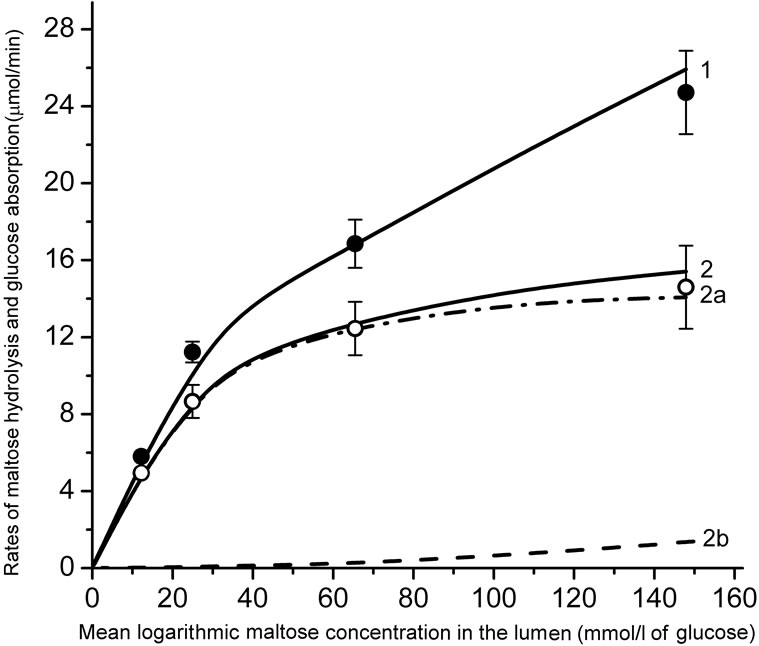 (b)
(b)
(a) is an approximation of the absorptive surface of the small intestine as a smooth surface with an adjacent diffusion layer; (b) is an approximation as a folded surface. Black and open circles denote experimental data (Mean ± SEM, N = 5) for maltose hydrolysis and released glucose absorption, respectively. Curves are the results of modeling. 1—maltose hydrolysis; 2— released glucose absorption; 2a—the “active” transport component; 2b—the unsaturated transport component. Parameters of the model are presented in the text and in Tables 1 and 2.
Figure 3. Kinetics of maltose hydrolysis and glucose absorption in the isolated loop of the rat small intestine (experimental data and mathematical modeling).
emphasize that the values of other parameters (Kt, Jmax, kd, k1g, etc.) in both versions of the model were the same as those in modeling of free glucose absorption (See Tables 1 and 2).
The model with A-variant of approximation (Figure 3, (a)) predicts a more rapid saturation of the maltose hydrolysis with increasing substrate concentration in the lumen (curve 1), and a lower rate of the released glucose absorption (curve 2) compared with the corresponding experimental data (Figure 3(a), black and open circles, respectively, Mean ± SEM) in the range of high concentrations of maltose in the intestinal lumen. It is important to note, that the relationship between saturated (“active”) and unsaturated (“passive” and facilitated diffusions) components of M-glucose absorption (curves 2a and 2b) was significantly different from the relationship between these components in the case of G-glucose absorption (Figure 2(a), curves 2 and 3).
In the case of approximation of a folded surface a good agreement was observed between the results of simulation and corresponding experimental data (Figure 3(b)) both in terms of maltose hydrolysis (curve 1, correlation coefficient r = 0.998), and the rate of released glucose absorption (curve 2, correlation coefficient r = 0.999). The model predicted that at the maximal concentration of maltose in the infusate (100 mmol/l) the contribution of the saturated (“active”) component of the released glucose absorption (curve 2a) was more than 90% of the total absorption (curve 2).
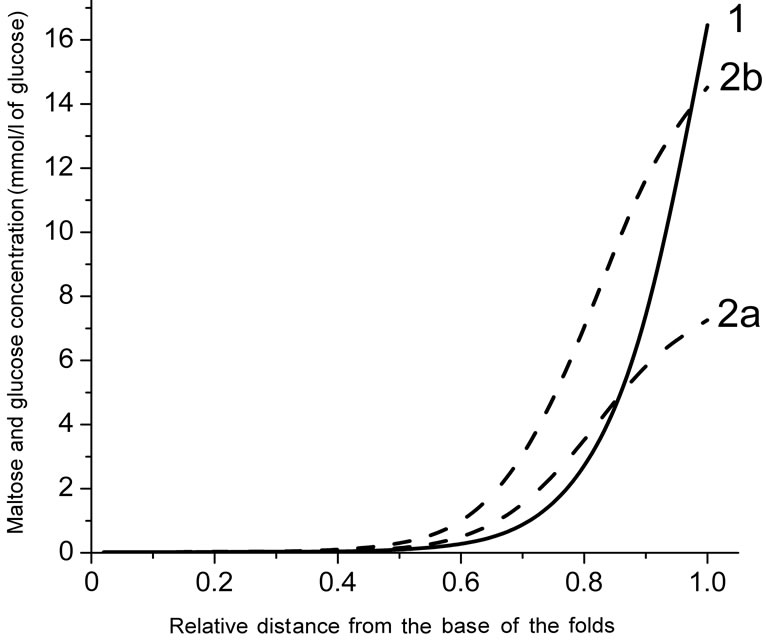
3.3. Simulation of the Radial Distribution of Substrates in the Pre-Epithelial Layer of the Small Intestine
The model with a folded surface, as an imitation of the actual intestinal surface, predicts a sharp decrease in the concentrations of the substrates along the intestinal villi in the case of relatively low concentrations of maltose (25.0 mmol/l) or free glucose (50 mmol/l) in the intestinal lumen (Figure 4(a)). At the same time, according to the results of the simulation, the concentration of glucose, released from maltose hydrolysis (curve 2a), is signifycantly lower than that in the case of absorption of free glucose (curve 2b).
Hydrolysis of maltose apparently takes place at the level of the upper third of the villi (Figure 4(b), curve 1) at a high substrate concentration in the lumen (100 mmol/l). Moreover, in this case, the simulation results suggest the presence of high concentrations of glucose which is released during the hydrolysis of maltose (curve 2a), as well as high concentrations of free glucose (curve 2b) in the intervillous space along the entire height of intestinal villi.
4. DISCUSSION
The question about the basic mechanisms of glucose absorption in the small intestine under normal conditions remains controversial.
In the late 80’s J. Pappenheimer [8] drew attention to the discrepancy between the classical concepts of a role of the secondary active transport mediated by SGLT1 with the experimental data obtained in kinetic studies of glucose absorption.
 (a)
(a)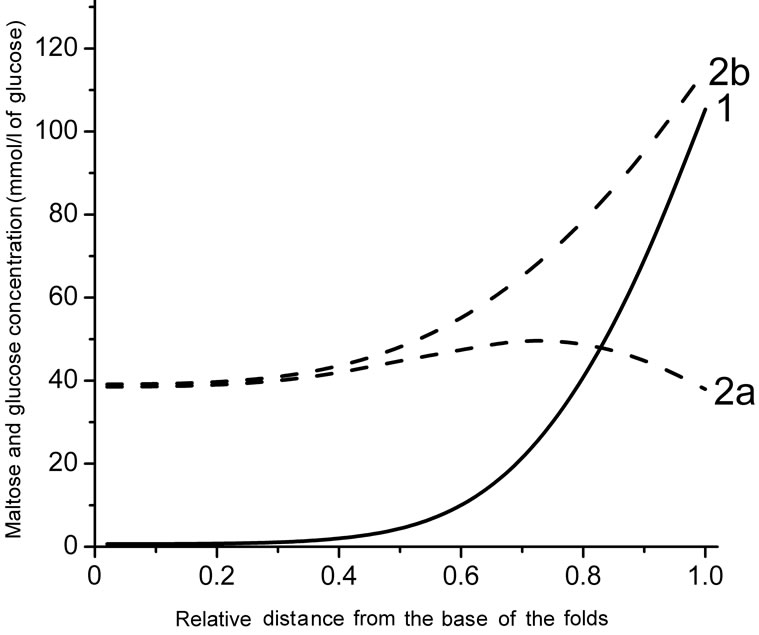 (b)
(b)
(a) and (b) are substrate concentrations in the infusate 50 and 200 mmol/l of glucose, respectively; 1—maltose concentration; 2a—concentration of glucose released from maltose hydrolysis; 2b—concentration of free glucose.
Figure 4. Radial distribution of maltose and glucose in the diffusion zone between the folds at a distance of 19 cm from the beginning of the tube (a mathematical modeling).
First, under physiological conditions, a significantly higher rate of glucose absorption in the small intestine has been observed than would be expected if we bear in mind the values of the maximal rate of the active transport (Jmax), calculated from the data obtained previously in the in vitro and in vivo experiments (review: [8]).
Second, in the experiments in vivo, even in the range of high concentrations of glucose, the rate of absorption continues to increase with increasing substrate concentration, while the concentration of glucose even at 25 - 30 mmol/l would reach almost complete saturation of the transporter SGLT1, because Michaelis constant for active transport of glucose (Kt) is in the range 0.2 - 5.0 mmol/l [5,7,9].
The idea of J. Kellett and collaborators [9,12] about the involvement of the GLUT2 transporter in glucose transfer across the apical membrane of enterocytes under high carbohydrate load seems as a satisfactory explanation for the mentioned discrepancies. Many researchers have found a large amount of the transporter not only in the basolateral, but also in the apical membrane of enterocytes [9]. We also observed the localization of fluorescent labels for transporters GLUT2 in the apical region of enterocytes during the immunocytochemical analysis of enterocytes in the isolated small intestine after its perfusion in chronic experiments on rats [28,29].
Thus, at present the involvement of the apical GLUT2 in glucose transfer across the apical membrane of enterocytes seems convincingly proved.
However, the statement of some authors [12,13] about domination of facilitated diffusion mediated by the GLUT2 transporter in glucose absorption at the high carbohydrate load is not indisputable, because this view does not take into account some important factors.
One of the factors is underestimation of the “active” component of glucose absorption observed in physiological conditions.
On the basis of data obtained in vitro—or in the acute in vivo experiments on anesthetized animals, some authors [7-9,13] have asserted that a capacity of the “active” glucose transport in the small intestine is too small to explain the high rates of glucose absorption which have been observed under normal conditions. Nevertheless, we [11,14,16] and other researchers [15] have previously shown that anesthesia and surgical trauma significantly impairs functional characteristics of the small intestine. The results of chronic experiments on nonanesthetized animals [11,14,16] have shown that values of the maximal rate of the secondary active glucose transport under physiological conditions are significantly higher than the former estimates, based on the acute experiments in vivo.
According to the results of our present chronic experiments (Figure 2), the rate of glucose absorption in the isolated intestinal loop was 6.30 ± 0.35 mmol/min at mean logarithmic glucose concentration in the lumen 10.65 mmol/l, i.e. in the range of almost negligible contribution of facilitated diffusion through GLUT2. At the same time, in the range of mean logarithmic glucose concentration in the lumen between 30 - 160 mmol/l, where the “active” component of glucose absorption was supposed to be saturated, the rate of glucose absorption increased from 10.15 ± 1.11 to 17.03 ± 1.18 mmol/min (the slope was only about 5 mmol/min per 100 mmol/l).
The model with the approximation of a folded surface (curves 2 and 3 in Figure 2(a)) demonstrates the relations between “active” (saturated) and “diffusion” (unsaturated) components of glucose absorption.
The second factor is the complex architecture of the intestinal surface (the presence of folds, villi, and microvilli). Our data on the kinetics of maltose hydrolysis in the isolated loop of the small intestine in a wide range of substrate concentrations (Figure 3), as well as the experimental data obtained by other researchers [18], demonstrate the absence of saturation of maltose hydrolysis in the range of high concentrations of the substrate (50 - 100 mmol/l). This fact (keeping in mind that the Michaelis constant, Km, for maltase activity is about 3.2 - 3.7 mmol/l) can only be explained by the model which takes into account the complex architecture of the intestinal surface (Figure 3(b), curve 1).
It is reasonable to assume that the mentioned peculiarrities of the intestinal surface similarly affect the kinetics of glucose absorption. Indeed, the simulation results on the kinetics of glucose absorption released from maltose hydrolysis fit best to the experimental data only in the case of approximation of the folded surface (Figure 3(b), curve 2). In the case of approximation in the form of a smooth surface, the model predicts a saturation of the rates of maltose hydrolysis and released glucose absorption at much lower concentrations of substrate than that observed in our chronic experiments (Figure 3(a), curves 1 and 2).
Analysis of the possible radial distribution of substrates in the pre-epithelial layer, using the model with approximation of the folded surface, shows (Figure 4) that at the concentration of maltose 25 mmol/l (50 mmol/l of glucose) the transporters SGLT1 appears to be close to saturation only in the upper part of the villi.
This conclusion is consistent with the results obtained previously by us in the study of the structural organization of enterocytes in the intestinal preparations taken from isolated loop of the rat small intestine after its perfusion with solutions of glucose and maltose in chronic experiments. In particular, it was found that at low concentrations of maltose (25 mmol/l) the absorption of the released glucose occurred mainly at the tips of the villi, whereas at higher concentrations of maltose (75 mmol/l), the lateral surface of the villi was also involved in absorption of glucose [28,29].
The third factor is an overestimation of the facilitated diffusion in the experiments with inhibitors of glucose transport.
One of the arguments in favor of a predominant role of the facilitated diffusion mediated by GLUT2 in glucose absorption in the small intestine was based on a signifycant reduction in glucose absorption in the small intestine in vivo by phloretin (an inhibitor of GLUT2) [9].
However, phloretin, introduced to mucosal side of the intestine, is likely to partially penetrate into the intercellular space and inhibits the exit of glucose from enterocytes [30]. In addition, phloretin non-specifically inhibits the activity of some enzymes and transport systems in the small intestine [30]. Thus, an approach based on the use of phloretin to inhibit glucose absorption in the small intestine significantly overestimates the contribution of facilitated diffusion through the apical membrane of enterocytes in total absorption of glucose, whereas the contribution of the secondary active transport of glucose in this case is underestimated.
This work does not question the importance of involvement of the apical GLUT2 in absorption of glucose in the small intestine under certain physiological or pathological conditions (e.g. diabetes, and obesity).
At the same time, the results of our kinetic studies and mathematical modeling confirm the central role of the secondary active transport mediated by SGLT1 in the absorption of glucose in the small intestine [1,2,31,32]. Only the model, that has been developed on this assumption and takes into account the architecture of the intestinal surface, can satisfactorily reproduce the kinetics of maltose hydrolysis and glucose absorption in a wide range of substrate concentrations.
Our results indicate that the physiological role of villous surface of the small intestine in mammals is not limited to an increase in the digestive-absorptive surface area. In combination with other factors (localization of hydrolytic enzymes and the corresponding transporters at the same surface, the presence of the pre-epithelial layer of the small intestine, and trans-epithelial fluid flows) the features of the architecture of the intestinal surface promote more efficient coupling between hydrolysis and transport of nutrients.
5. CONCLUSIONS
1) The secondary active transport mediated by the SGLT1 is the major mechanism of glucose absorption in the rat small intestine under close to physiological conditions not only at low, but also at high carbohydrate concentrations.
2) Analysis of different mechanisms of nutrients absorption in the small intestine under normal conditions based on the data obtained in vivo experiments on nonanesthetized animals requires taking into account the permeability of the pre-epithelial layer of the small intestine and geometric peculiarities of its surface, especially in the range of high concentrations of substrates.
6. ACKNOWLEDGEMENTS
The work is supported by the Russian Foundation for Basic Research (grant No 11-04-01048а).
REFERENCES
- Ferraris, R.P. (2001) Dietary and developmental regulation of intestinal sugar transport. Biochemical Journal, 360, 265-276. doi:10.1042/0264-6021:3600265
- Wright, E.M., Hirayama, B.A. and Loo, D.F. (2007) Active sugar transport in health and disease (review). Journal of Internal Medicine, 261, 32-43. doi:10.1111/j.1365-2796.2006.01746.x
- Stearns, A.T., Balakrishnan, A., Rhoads, D.B., Asdhley, S.W. and Tavakkolizadeh, A. (2009) Diurnal expression of the rat intestinal sodium-glucose cotransporter 1 (SGLT1) is independent of local luminal factors. Surgery, 45, 294- 302. doi:10.1016/j.surg.2008.11.004
- Thomson, A.B.R. and Dietschy, J.M. (1984) The role of the unstirred water layer in intestinal permeation. In: Csaky, T.Z. Ed., Pharmacology of Intestinal Permeation, Springer, Berlin, 165-269.
- Hopfer, U. (1987) Membrane transport mechanisms for hexoses and amino acids. In: Johnson, L.R. Ed., Physiology of the Gastrointestinal Tract, Raven Press, New York, 1499-1526.
- Meddings, J.B. and Westergaard, H. (1989) Intestinal glucose transport using perfused rat jejunum in vivo: Model analysis and derivation of corrected kinetic constants. Clinical Science, 76, 403-413.
- Pappenheimer, J.R. (2001) Role of pre-epithelial “unstirred” layers in absorption of nutrients from the human jejunum. Journal of Membrane Biology, 179, 185-204. doi:10.1007/s002320010047
- Pappenheimer, J.R. (1990) Paracellular intestinal absorption of glucose, creatinine, and mannitol in normal animals: Relation to body size. American Journal of Physiology, 259, G290-G299.
- Kellett, G.L. (2001) The facilitated component of intestinal glucose absorption. Journal of Physiology, 531, 585-595. doi:10.1111/j.1469-7793.2001.0585h.x
- Lane, J.S., Whang, E.E., Rigberg, D.A., Hines, O.J., Kwan, D., Zinner, M.J., McFadden, D.W., Diamond, J. and Ashley, S.W. (1999) Paracellular glucose transport plays a minor role in the unanesthetized dog. American Journal of Physiology, 276, G789-G794.
- Gruzdkov, A.A. and Gromova, L.V. (2001) Mechanisms of glucose absorption at high carbohydrate level in the rat small intestine in vivo. Russian Journal of Physiology, 87, 973-981.
- Kellett, G.L., Brot-Laroche, E., Mace, O.J. and Leturque, A. (2008) Sugar absorption in the intestine: The role of GLUT2. Annual Review of Nutrition, 28, 35-54. doi:10.1146/annurev.nutr.28.061807.155518
- Kellett, G.L. and Brot-Laroche, E. (2005) Apical GLUT2. A major pathway of intestinal sugar absorption. Diabetes, 54, 3056-3062. doi:10.2337/diabetes.54.10.3056
- Ugolev, A.M., Zaripov, B.Z., Jezuitova, N.N., Gruzdkov, A.A., Rybin, I.S., Voloshenovich, M.I., et al. (1986) A revision of current data and views on membrane hydrolysis and transport in the mammalian small intestine based on a comparison of techniques of chronic and acute experiments: Experimental re-investigation and critical reviews. Comparative Biochemistry and Physiology, 85A, 593-612. doi:10.1016/0300-9629(86)90269-0
- Uhing, M.R. and Kimura, R.E. (1995) The effect of surgical bowel manipulation and anesthesia on intestinal glucose absorption in rats. Journal of Clinical Investigation, 95, 2790-2798. doi:10.1172/JCI117983
- Gromova, L.V. and Gruzdkov, A.A. (1999) Hydrolysisdependent absorption of disaccharides in the rat small intestine (chronic experiments and mathematical modeling). General Physiology and Biophysics, 18, 209-224.
- Gusev, V.M., Gruzdkov, A.A. and Ugolev, A.M. (1983) The unstirred pre-membrane layers. Journal of Physiology (Kiev), 29, 515-525.
- Levitt, M.D., Fine, C., Furne, J. K., David, G. Levitt and D.G. (1996) Use of maltose hydrolysis measurements to characterize the interaction between the aqueous diffusion barrier and the epithelium in the rat jejunum. The Journal of Clinical Investigation, 97, 2308-2315. doi:10.1172/JCI118673
- Gruzdkov, A.A., Gromova, L.V., Grefner, N.M. and Komissarchik, Ya.Yu. (2010) Geometric peculiarities of intestinal surface and efficiency of coupling between membrane hydrolysis and transport of nutrients. Biochemistry (Moscow) Supplement Series A: Membrane and Cell Biology, 4, 269-277.
- Zimmermann, M. (1983) Ethical guidelines for investigations of experimental pain in conscious animals. Pain, 16, 109-110. doi:10.1016/0304-3959(83)90201-4
- Dahlqvist, A. (1964) Method for assay of intestinal disaccharidases. Analytical Biochemistry, 7, 18-25. doi:10.1016/0003-2697(64)90115-0
- Scott, T.A. and Melvin, E.H. (1953) The determination of hexoses with anthrone. Analytical Biochemistry, 25, 1656- 1658.
- Sandle, G.I., Lobley, R.W., Warwick, R. and Holmes, R. (1983) Monosaccharide absorption and water secretion during disaccharide perfusion of the human jejunum. Digestion, 26, 53-60.
- Zeuthen, T., Belhage, B. and Zeuthen, E. (2006) Water transport by Na+-coupled cotransporters of glucose (SGLT1) and of iodide (NIS). The dependence of substrate size studied at high resolution. Journal of Physiology, 570, 485-499. doi:10.1113/jphysiol.2005.100933
- Fan, M.Z., Stroll, B., Jiang, R. and Burrin, D.G. (2001) Enterocyte digestive enzyme activity along the crypt-villus and longitudinal axes in the neonatal pig small intestine. Journal of Animal Science, 79, 371-381.
- Ferraris, R.P. and Diamond, J.M. (1993) Crypt/villus site of substrate-dependent regulation of mouse intestinal glucose transporters. Proceedings of the National Academy of Sciences of the United of America, 90, 5868-5872. doi:10.1073/pnas.90.12.5868
- Fingerote, R.J., Doring, K.A. and Thomson, A.B. (1994) Gradient for D-glucose and linoleic acid uptake along the crypt-villus axis of rabbit jejunal brush border membrane vesicles. Lipids, 29, 117-127.
- Grefner, N.M., Gromova, L.V., Gruzdkov, A.A., Snigi-revskaia, E.S. and Komissarchik, Ya.Yu. (2006) Structuralfunctional analysis of diffusion in glucose absorption by rat small intestine enterocytes. Tsitologiia, 48, 355-363.
- Gromova, L.V., Grefner, N.M., Gruzdkov, A.A. and Komissarchik, Ya.Yu. (2006) The role of facilitated diffusion in glucose transport across the apical membrane of enterocytes. Russian Journal of Physiology, 92, 362-373.
- Gromova, L.V. (2006) Influence of phloretin and phloridzin on digestive and absorptive characteristics of rat small intestine. Journal of Evolutionary Biochemistry and Physiology, 42, 365-370.
- Moran, A.W., Al-Rammahi, M.A., Arora, D.K., Batchelor, D.J., Coulter, E.A., Ionescu, C., Bravo, D. and ShiraziBeechey, S.P. (2010) Expression of Na+/glucose co-transporter 1 (SGLT1) in the intestine of piglets weaned to different concentrations of dietary carbohydrate. British Journal of Nutrition, 104, 647-655. doi:10.1017/S0007114510000954
- Bachelor, D.J, Al-Rammahi, M., Moran, A.W., Brand, J.G., Li X., Haskins, M., German, A.J. and Shirazi-Beechey, S.P. (2011) Sodium/glucose cotransporter-1, sweet receptor, and disaccaridase expression in the intestine of the domestic dog and cat: Two species of different dietary habit. American Journal of Physiology—Regulatory, Integrative and Comparative Physiology, 300, R67-R75. doi:10.1152/ajpregu.00262.2010