Journal of Environmental Protection
Vol.5 No.2(2014), Article ID:43354,10 pages DOI:10.4236/jep.2014.52020
Environmental Assessment of Acid Mine Drainage Pollution on Surface Water Bodies around Ngwenya Mine, Swaziland
Department of Chemistry, University of Swaziland, Kwaluseni, Swaziland.
Email: caroldlmn@gmail.com
Copyright © 2014 A. O. Fadiran et al. This is an open access article distributed under the Creative Commons Attribution License, which permits unrestricted use, distribution, and reproduction in any medium, provided the original work is properly cited. In accordance of the Creative Commons Attribution License all Copyrights © 2014 are reserved for SCIRP and the owner of the intellectual property A. O. Fadiran et al. All Copyright © 2014 are guarded by law and by SCIRP as a guardian.
Received December 7th, 2013; revised January 5th, 2014; accepted February 2nd, 2014
Keywords:Acid Mine Drainage; Heavy Metal Pollution; Redox Potential; Physico-Chemical Properties; Iron Speciation
ABSTRACT
Twenty-three water samples and three “yellow boy” samples were obtained from different water bodies located at the foot of the Ngwenya Mountain on top of which the old Ngwenya Iron Ore Mine is located. The samples were analysed for pH, electrical conductivity (EC), redox potential (ORP) and temperature (T). The dominant Fe species was determined using a UV-VIS spectrophotometer. Selected anions namely: halogens (F−, Br−, Cl−), the nutrients ( ,
, ,
, ) and the best indicator for AMD pollution (
 ) were analysed using Ion Chromatography (IC) while the selected heavy metals, namely: Cr, Mn, Fe, Ni, Co, Cu, Zn, Pb and Cd were analysed using Flame Atomic Absorption Spectrometry (FAAS). The physico-chemical parameters ranges obtained were pH (6.32 - 8.63), EC (11.00 - 585.33 µS/cm), ORP (−93.67 - 79.33 mV) and T (7.60˚C - 18.57˚C). The levels of the Fe species (ppm) in the water samples were Fe2+ (0.56 - 3.17) and Fe3+ (0.00 - 0.73). Measured mean anion ranges in ppm were F- (0.00 - 0.15), Cl− (1.5 - 11.19),
  (0 - 13.25) and
  (0.05 - 22.29). The mean ranges for the heavy metals in the water samples in mg/l were Cr (0.00 - 2.46), Mn (0.00 - 0.30), Fe (0.00 - 0.34), Ni (0.00 - 0.34), Co (0.00 - 0.29), Cu (0.00 - 0.07), and Cd ((0.01 - 0.11) whilst Zn and Pb were not detectible. The average pH in all the sites was within the acceptable range (6.5 - 8.5) according to WHO standards except for two sites. Fe2+ was the dominant Fe species in the water samples. The water was free from anion pollution because all measured anion levels were below the guideline by WHO. The relative percentages of sites polluted by the respective heavy metals were: Cd (83%), Cr (71%), Ni (46%), Co (42%), Mn (17%), Fe (4%) while no site was polluted by Cu, Zn and Pb. The State needs to set up sound remediation strategies to save the populations around the Ngwenya Mine from the heavy metal pollution they are exposed to by using water polluted by the mining activities.
1. Introduction
A previous study [1] revealed that the acid mine drainage (AMD) phenomenon occurs in the old Ngwenya Mine, Swaziland. Acid mine drainage is the acidic water that is produced in mining areas from the oxidation of pyrite. The formation of AMD is facilitated biochemically by bacteria called Thiobacillus ferrooxidans and Ferroplasma acidarmanus [2-4]. AMD is rife in abandoned mines and once produced, it can exist for ages thereby polluting the environment concerned in perpetuity [5]. AMD has detrimental effects on surface waters if existent [6,7]. It is therefore worthwhile that the surface water bodies around the mine should be assessed for acid mine drainage pollution. This would enhance the quality of the affected water bodies. Water is life and a safe drinking water is a human birthright [8]. Use of polluted water upsets the whole ecological system [9-12]. AMD pollution causes the release of heavy metals into the environment [10,13] rendering them available for intake by biological systems. High levels of heavy metals are a nuisance to the environment due to their adverse effects on both plants and animals including human beings [9,14]. They have low biodegradability in the body and accumulate in both soft and hard tissues in the human body [15].
It is hypothesized that acid mine drainage from the Ngwenya Mine ore and dumping sites deteriorates the quality of water in their vicinity [16]. Mobility of heavy metals is enhanced by acidic waters rendering them liable to contaminate the environment [17,18] and causing adverse effects on life generally. As a result, acidic waters are a menace to the environment as well as being incapable to carry out its functions well [2,19]. Such water is unsafe for drinking, irrigation, swimming or cooling purposes in industry. The increased acidity interferes with the characteristics of pure water rendering it a poor coolant in the industry and engines. Low-pH water is inhabitable to aquatic fauna and flora and animals in general [12]. The human population around Ngwenya Mine that can be potentially affected by the AMD stands at 11147 as per 2007 report [20].
AMD can develop throughout the mining process [4], that is, in underground workings, waste rock dumps, open pit mine fractures, tailing deposits, ore stockpiles, etc. Once it occurs, the adverse effects can be costly because of high clean-up costs and irreversibility because of lack of available technology [6,21]. Waters with low pH kill all forms of living organisms in them, save only the highly tolerant ones. This leads to poor water quality and release of bad odour due to the decomposing dead organisms. Moreover, in low pH water, heavy metals become soluble and as such are potential contaminants to soils, sediments and terrestrial plants that use such water for growth [9]. Aquatic organisms can also accumulate the dissolved metals in their bodies which eventually are consumed by higher organisms and sequentially causing pollution by biomagnifications. This continues up to the trophic ladder until these metals get into humans and on accumulating beyond maximum contamination limits (MCL) and cause detrimental effects on human health. Heavy metals are systemic toxins with specific carcinogenic, teratogenic, nephrotoxic, neurotoxic and fetotoxic effects [15]. Reproductivity in crops is hindered by watering with acidic water. Quite often, low pH water contains high concentrations of copper ions that interfere with photosynthesis, and thus resulting in poor yields. This eventually negatively affects food security [10].
Furthermore, acidic waters are unsuitable for tourism purposes. The water is corrosive; hence it is not good for swimming. It has bad odour due to the decomposition of dead organic matter which strips off the water of a substantial amount of dissolved oxygen, rendering the waters anoxic. The water is not fit for aesthetics as acidic waters are characterized by an orange-brown colour. This is the colour of ferric hydroxide which is a product of pyrite oxidation. The ferric hydroxide precipitate is called “yellow boy” [22].
Equations (1)-(3) summarize the oxidation of pyrite:
 (1)
(1)
 (2)
(2)
 (3)
(3)
The formation of “yellow boy” removes dissolved oxygen from water [19]. The “yellow boy” is produced in the AMD receiving streams because there is no pyrite to be attacked by the ferric ion. The corresponding stepwise reactions are as follows:
 (4)
(4)
 (5)
(5)
 (6)
(6)
Figure 1 is a typical picture of “yellow boy” produced in one of the tributaries to Mlondozi River which is very close to the mine.
In summary, the influx of acid mine drainage into streams can severely degrade both habitat and water quality. It often produces an environment devoid of most aquatic life and unfit for desired uses. The severity and extent of damage depend upon a variety of factors including the frequency, volume, and chemical nature of the drainage. The size and the buffering capacity of the
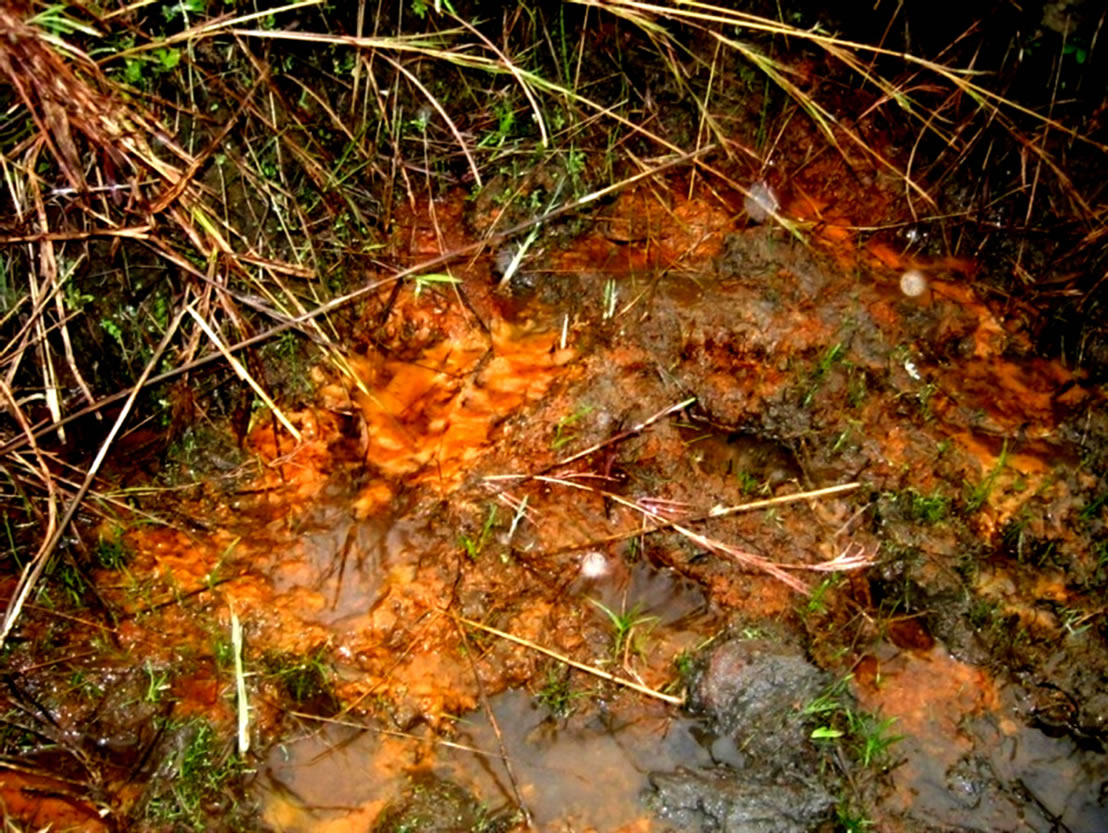
Figure 1. The photograph of typical “yellow boy”.
receiving stream are other vital factors. The transport route from the source to the receptor may equally be a determining factor of the extent of damage by the AMD.
2. Materials and Methods
2.1. Description of the Study Area
The study area is the surface water bodies found around the Ngwenya Iron Ore Mine, Swaziland. The streams studied are used by the communities in the study area for domestic purposes, that is, they are the sole providers of potable water in this area. Some of these streams are feeders for the Hawane Dam which supplies water to the capital city of Swaziland, Mbabane. Figure 2 below shows the areas in the vicinity of the Mine and the streams that source their water from the Ngwenya Mountain where the AMD producing mine is located [1].
2.2. Experimental
Water samples were collected from streams and dams around the foot of the Ngwenya Mountain. The sampling points are shown in Figure 3 below. Water samples were collected into 1 L prewashed polyethylene bottles as described elsewhere [1]. They were thereafter placed in a cooler box containing ice blocks and transported to the laboratory.
2.2.1. Physico-Chemical Properties
Upon arrival in the laboratory, about 100 ml of each of the water samples were poured into a small beaker and then quickly analysed for the physico-chemical parameters, namely: pH, temperature (T), redox potential (ORP) and electrical conductivity (EC). These analyses were carried out using electrochemical methods during which WTW Multi 340i probes were used. The pH and the ORP were measured by one probe, the pH-Electrode Sen Tix 41-3, which can be switched from measuring pH to measuring ORP and vice versa. The EC and T were measured by another probe, the TetraConR 325. The ORP values were converted to Eh (-log of electron concentration) using Equation (7) below:
 (7)
(7)
This is addition of the temperature-adjusted potential of the saturated calomel electrode, where T is the measured temperature of the sample in ˚C [23].
The water samples were taken out of the freezer, allowed to defrost and then filtered through 0.45 µm HVLP polymer membrane filter using a Nalgene filter funnel with a V-700 model vacuum pump. The filter funnel and the collecting flask were rinsed first with deionized water three times and then with the next sample to be filtered to avoid cross sample contamination.
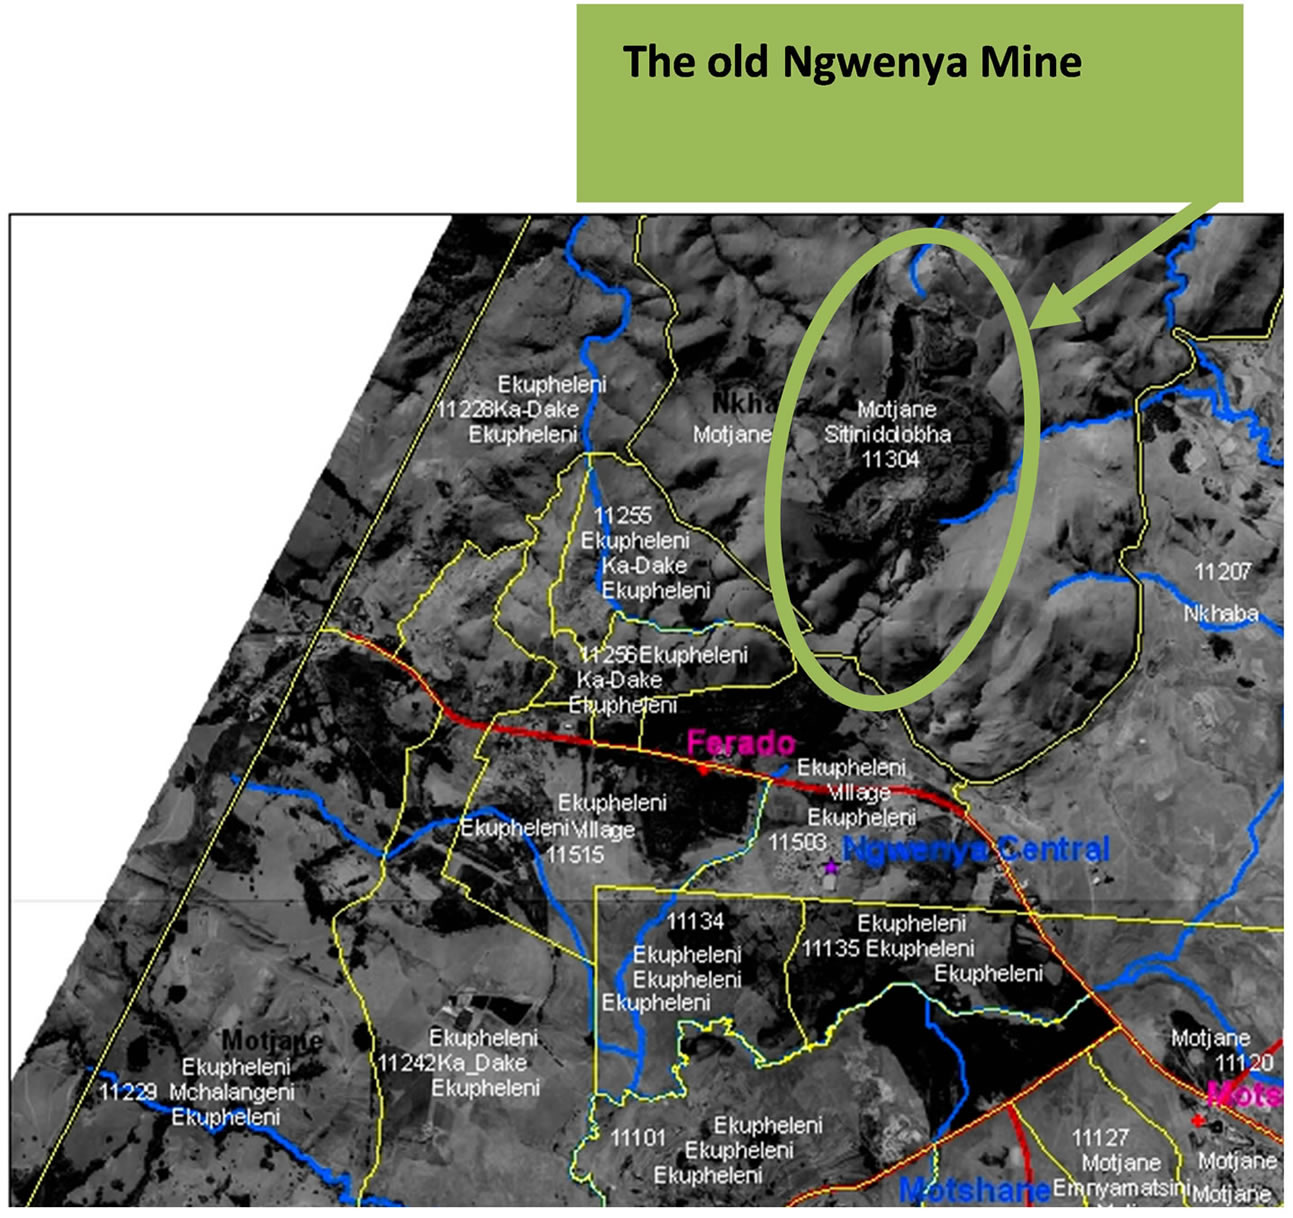
Figure 2. Areas around Ngwenya Mine and streams whose source is the Ngwenya Mountain, Source: Central Statistical Office of Swaziland [20].

Figure 3. Sampling points ( ) in areas around the Ngwenya Mine.
Each of the approximately 200 ml filtered water samples was put in a cleaned bottle, carefully labelled and then kept in the chest freezer for further analysis.
2.2.2. Anion Analysis
Filtered water samples were analysed by Ion Chromatography (IC) for seven anions, namely the halogens (F−, Br−, Cl−), the nutrients (NO2-N, NO3-N, PO4-P) and , the best indicator for AMD pollution [24]. The Metrohm, 861 Advanced Compact IC used was set at 17 minutes analysis time for each sample by the ASUPP4-250. mtw method. The IC offers high sensitivity and multiple analyte determination in a single run. A 1000 ppm multi-standard stock solution containing the selected anions was prepared following the instrument manual’s procedure. Five working standards of 2, 4, 6, 8 and 10 ppm were freshly prepared daily from the stock solution. 1.7 M NaHCO3/1.8 M Na2CO3 eluent (mobile phase) was prepared and used at a flow rate of 1 ml/min. Fresh suppressant solution of 50 mM of sulfuric acid and deionized water were used from the beginning of the analysis. The water samples were manually injected into the IC using a 10 ml syringe through a 0.45 µm filter membrane. The results were recorded electronically as the instrument is connected to a computer.
2.2.3. Fe Speciation
A SHIMADZU UV-VIS Spectrophotometer was used for the iron speciation with a 1 cm cuvette quartz cell and wavelength range of 190 nm - 2500 nm.
The estimation of the quantity of native Fe2+ and total Fe was achieved by the UV-VIS analysis. A 10 ppm standard ferrous solution was prepared by weighing 0.0702 g of analytical grade ammonium ferrous sulfate hexahydrate into a 1 L volumetric flask and enough deionized water to dissolve the salt was added. The solution was acidified by adding 2.5 ml concentrated sulfuric acid and the solution was made up to the mark with deionized water. The complexing agent, 1, 10-phenanthroline, was prepared by dissolving 0.1 g in 100 ml deionized water. The reducing agent, hydroxylamine hydrochloride, was prepared by dissolving 10 g of it in 100 ml deionized water. 100 ml of 0.1 M of each of sodium acetate and acetic acid were prepared separately. The acetic acid-sodium acetate buffer (pH 4.5) was prepared by mixing 65 ml of the 0.1 M acetic acid and 35 ml of the 0.1 M sodium acetate in a 100 ml volumetric flask. Fresh buffer solution was prepared whenever required.
Five working standards of 0.1, 0.3, 0.5, 1.0 and 1.5 ppm Fe were each prepared in 100 ml volumetric flasks. 10 ml of each of the water samples were measured into small beakers. 20 ml of deionized water was put into another small beaker to serve as a blank. To each of all the flasks (standards, water samples and blank), 1 ml of hydroxylamine hydrochloride and 5 ml of 1, 10-phenathroline were added. Each solution was buffered with 8 ml of the acetic acid/sodium acetate buffer. All the solutions were allowed to stand for more than 15 minutes for full colour development. Both the standards and samples were measured at 508 nm, the  for Fe2+.
The native [Fe2+] was determined by adding 5 ml of the complexing agent to 10 ml of each sample using deionized water as blank. These solutions were allowed to stand for 20 minutes for the complex to fully develop its colour. The samples were then analysed for the ferrous ion levels at 508 nm. The results were recorded and from total iron results, the [Fe3+] in each sample was estimated by subtraction.
2.2.4. Heavy Metal Analysis
Heavy metal levels in the water samples were determined by the Flame atomic absorption spectrometry (FAAS) which uses the air-acetylene mixture. The heavy metals investigated were Cr, Mn, Fe, Ni, Co, Cu, Zn, Pb, and Cd. The heavy metal levels were determined using the instrument operating parameters given in Table 1 below. For each of the heavy metals, five calibration standards were prepared by serial dilution of the respective 1000 ppm stock solution obtained from Rochell Chemicals, RSA.
3. Results and Discussion
3.1. Calibration Curves and Detection Limits
Table 2 below shows the correlation coefficients, regression equations and detection limits of the analysed heavy metals in the water samples.
3.2. Physico-Chemical Properties
The pH and EC of the surface water bodies around Ngwenya mine were summarized in Table 3 and shown in Figure 4.
With the exception of Hawane (6.32) and Mbuluzana (6.48), the pH values for the water bodies were within the acceptable range for health risk, being (6.5 - 8.50), set by USEPA, 2008 [8]. Ndlotane, Mlondozi and yellow-boy water had electrical conductivities above maximum admissible limit set at 250 µS/cm by WHO, 2008
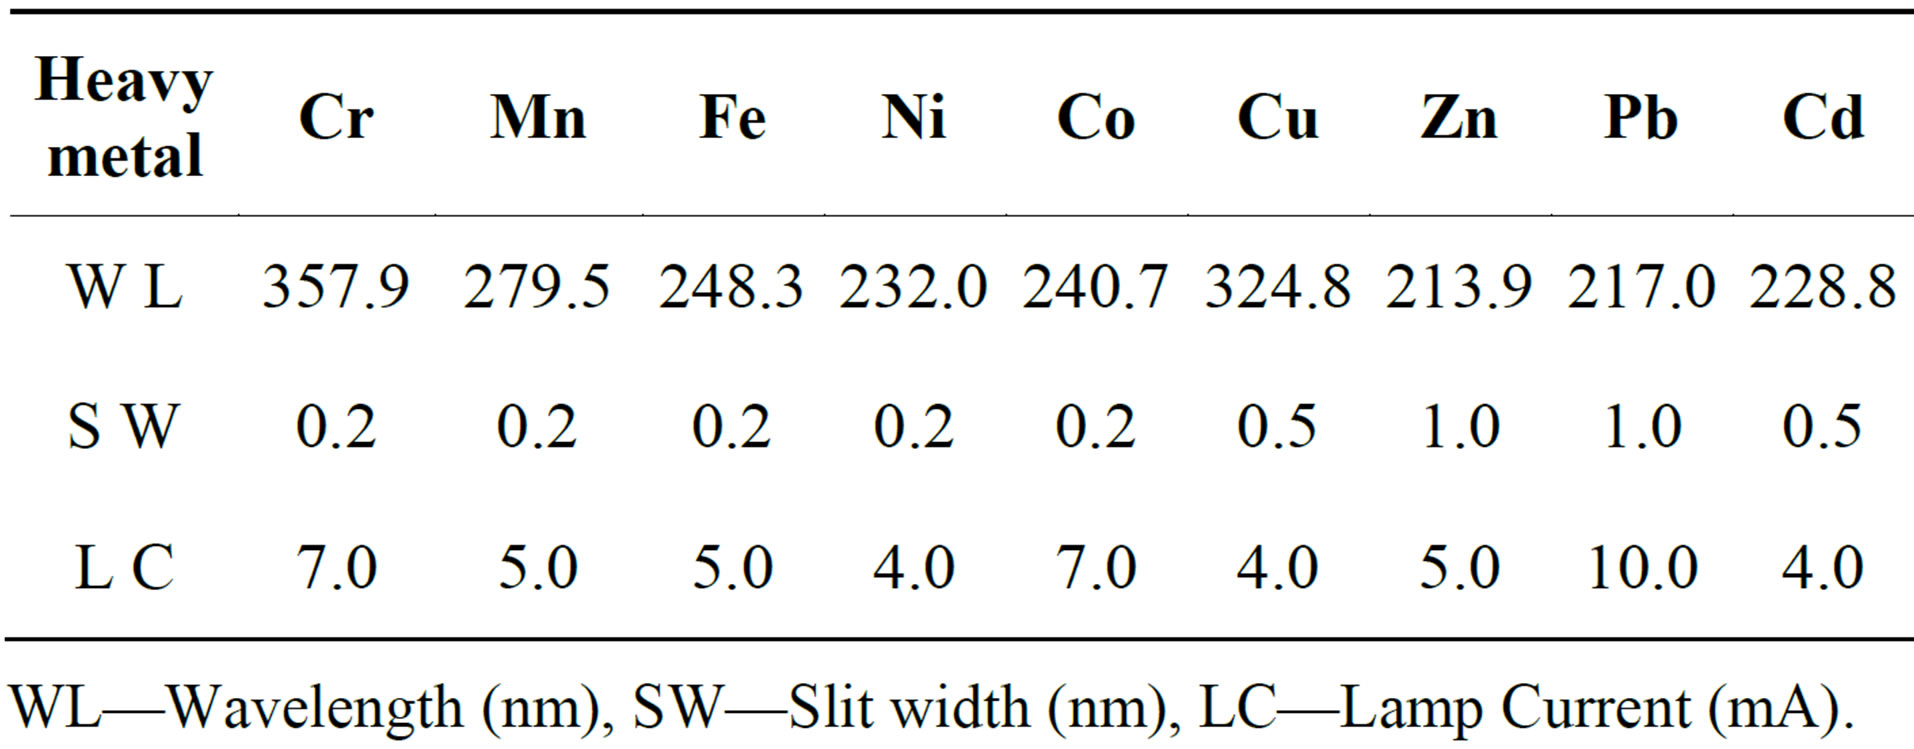
Table 1. Instrument operating parameters used in the analysis of respective heavy metals.
WL—Wavelength (nm), SW—Slit width (nm), LC—Lamp Current (mA).
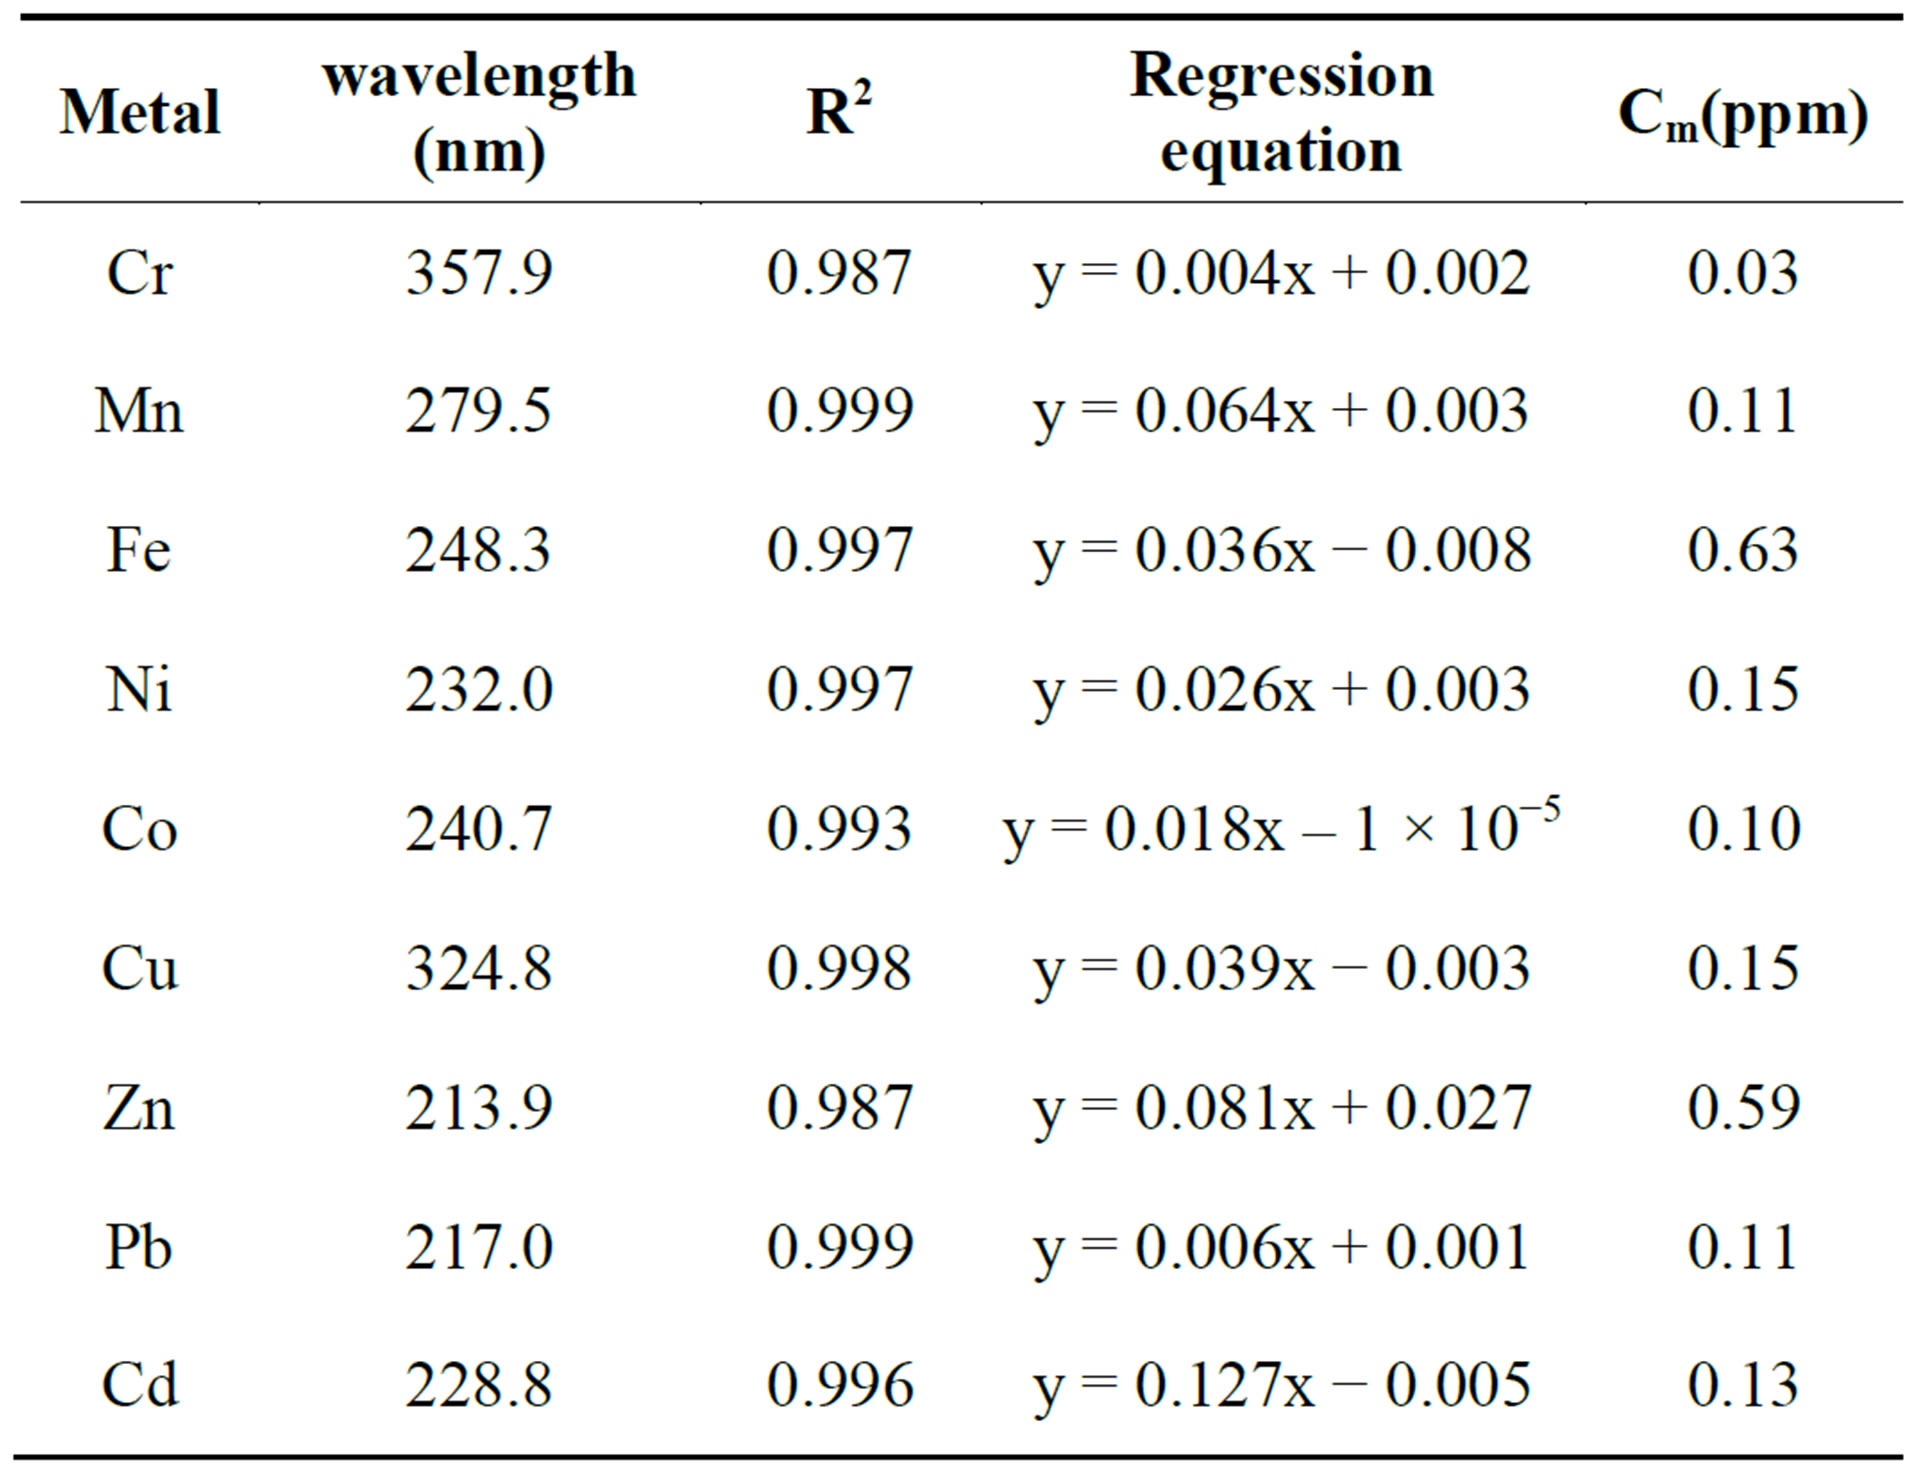
Table 2. Wavelengths, correlation coefficients, regression equations and detection limits (Cm) for the heavy metal analysis.
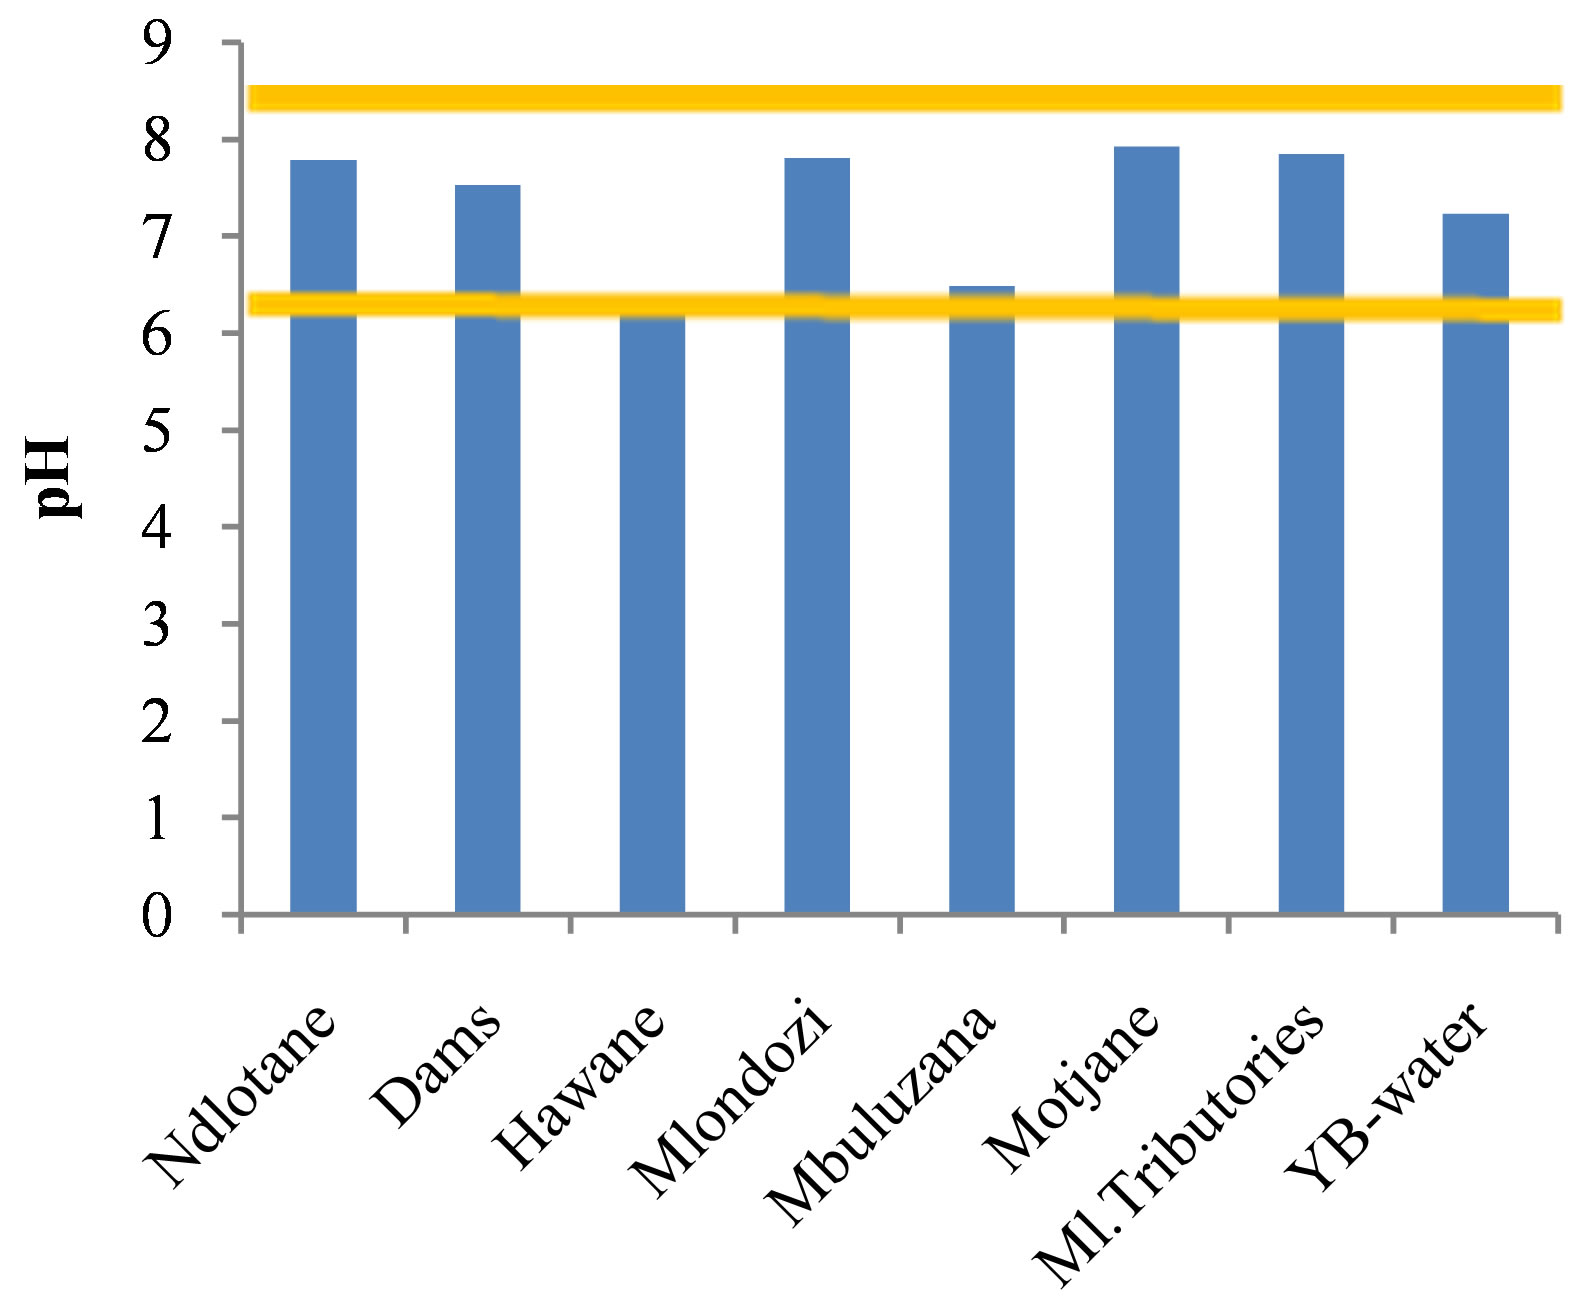

Figure 4. Mean pH and electrical conductivities of the water bodies located around the Ngwenya Mine.
[8]. This implies that the affected water bodies were heavily laden with ionic species which may pose a health hazard to the users. On the other hand, EC values for Hawane, Motjane and Mbuluzana water samples were
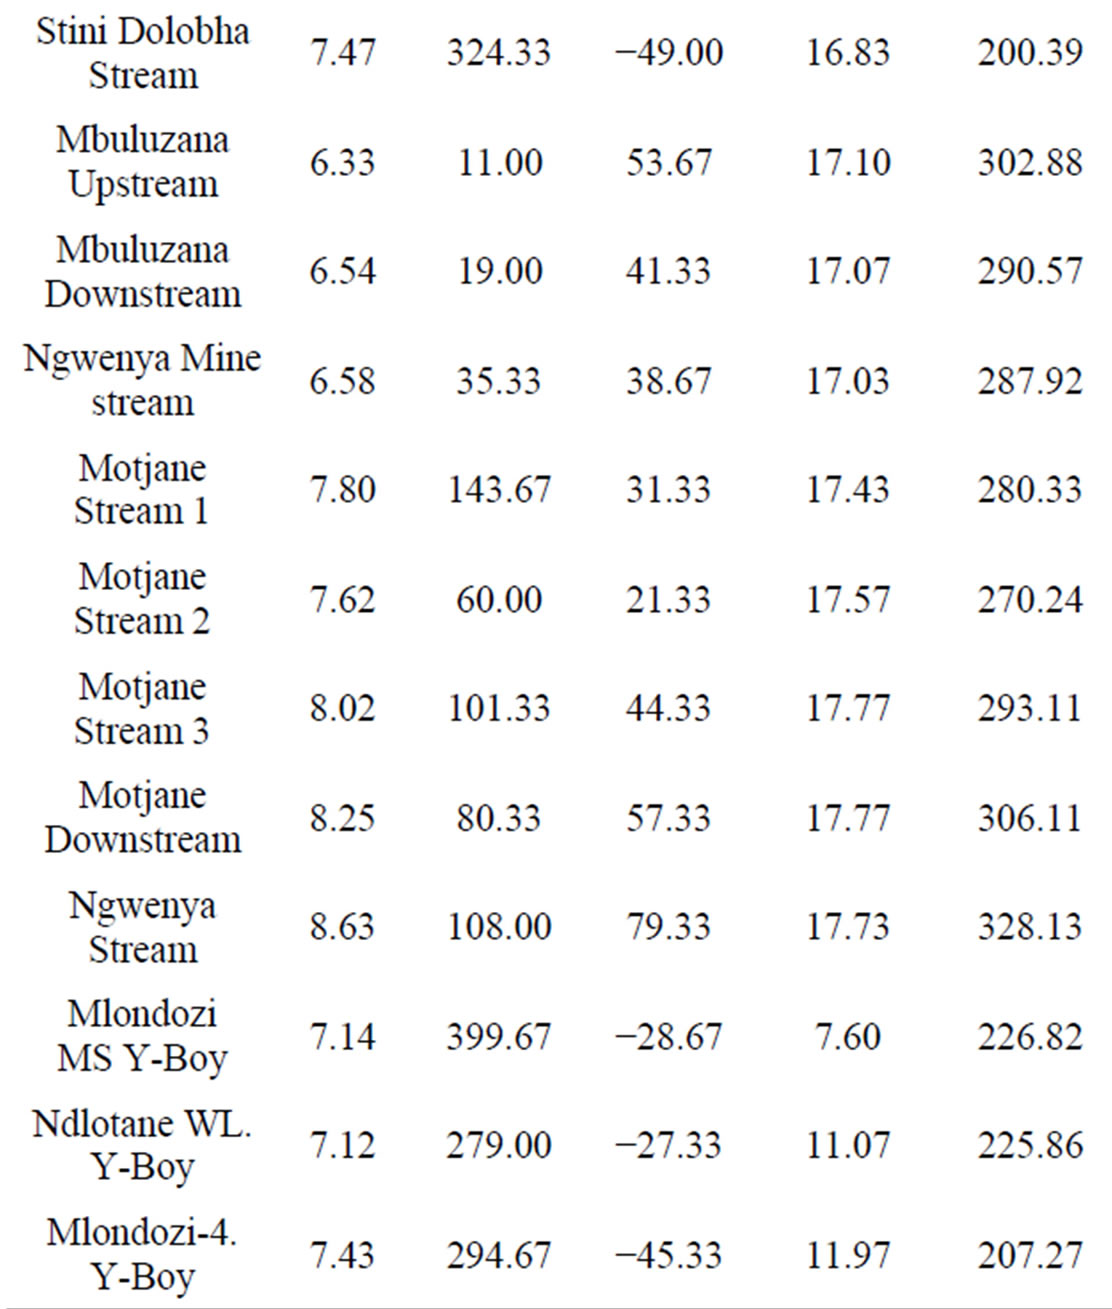
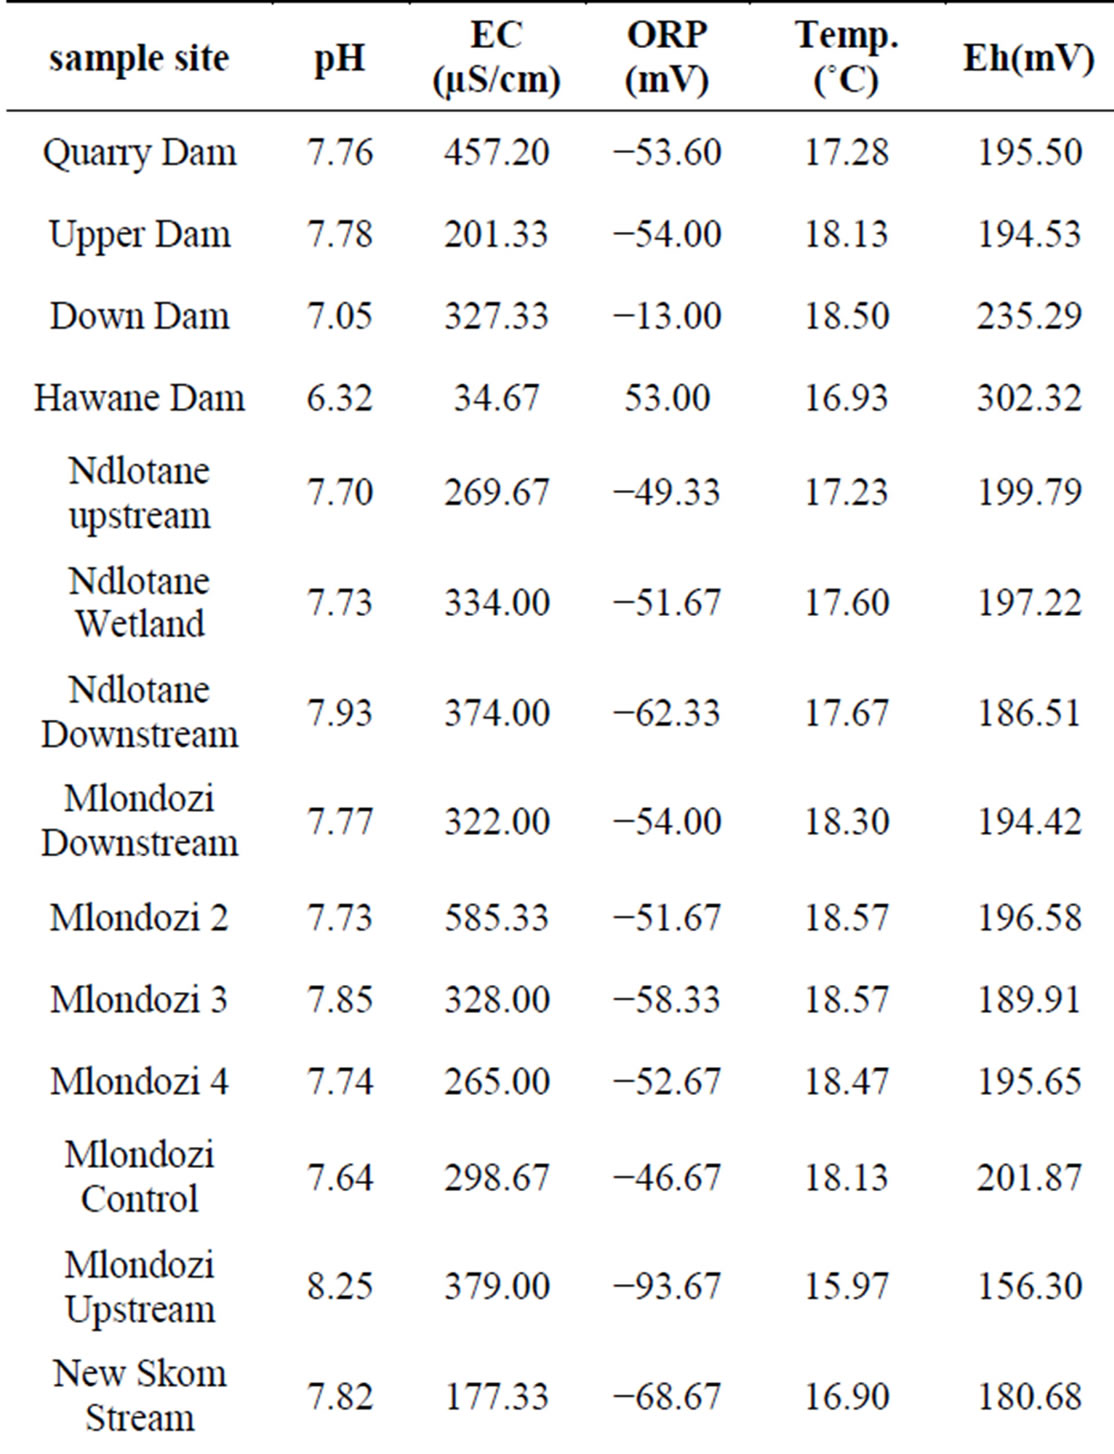
Table 3. Mean values of the physico-chemical parameters of the water samples.
within the acceptable limits for drinking water and aesthetic value [8]. Table 3 below shows that the environments in the water bodies of Hawane, Mbuluzana and Motjane were oxidising as shown by the positive ORP while reducing environments prevailed in all the other studied water bodies.
Figure 5 shows the relationship of pH to Eh in the water bodies grouped in Table 3. The scatter diagram shows that generally when pH increases Eh decreases, alkaline water has low Eh. In other words, these parameters are inversely related to one another.
3.3. Anions in the Surface Water Samples
Generally, anions are less toxic than heavy metals. In this study, the toxicity of the anions detected in the surface water is in the order: F− > NO3-N > Cl− >  [25]. This order corresponds to their respective maximum acceptible limits which are as follows: 1.5 ppm, 10 ppm, 250 ppm and 500 ppm [25]. Table 4 gives the anion levels in surface water bodies around the old Ngwenya Mine. The sulfates are indicator ions for AMD occurrence; they are a product of pyrite oxidation together with the ferrous and the hydrogen ions. It must be noted that phosphates were missing because they are highly adhesive to soil thus the reason why they may not be detected in the water. The Down dam and the Upper dam are surrounded by mine dumps, fields and homesteads. The high nitrate levels must have been from the fertilizers that were used for agricultural purposes and the chlorides from common salt used for domestic purposes. The sulfates must have been the leachate from the mine dumps. The Hawane dam recorded the least of these ions. It is located out of the mining area so the water is fed to it by a stream originating from the mine area which may have undergone river self-purification hence the decreased ion levels.
The high chloride level in Ndlotane river may be attributed to domestic wastes from homesteads along the stream. Chlorides cause a brackish taste in water and are indicator ions for sewage pollution [25]. Nitrates leach from the fields, where artificial fertilizers were applied, down gradient into the streams. Elevated nitrate levels were also observed in sites surrounded by forests of wattle trees, that is the Quarry dam and NG-(M). This result was also observed in [1]. Nitrates are carcinogenic, cause chronic effects (NO3-N > 10 ppm cause methemoglobinemia) and algal bloom which have adverse effects on the environment and human health [26]. The sulfates must have percolated with the acid mine drainage polluted water from the Quarry Dam upgradient [1]. This assertion is reinforced by the high [SO4] recorded in SD-MS which originates from just below the dam. Ingestion of excess sulfates gives water an unpalatable taste and causes laxative effects [25]. The flouride ion recorded the least levels of all the anions such that it is
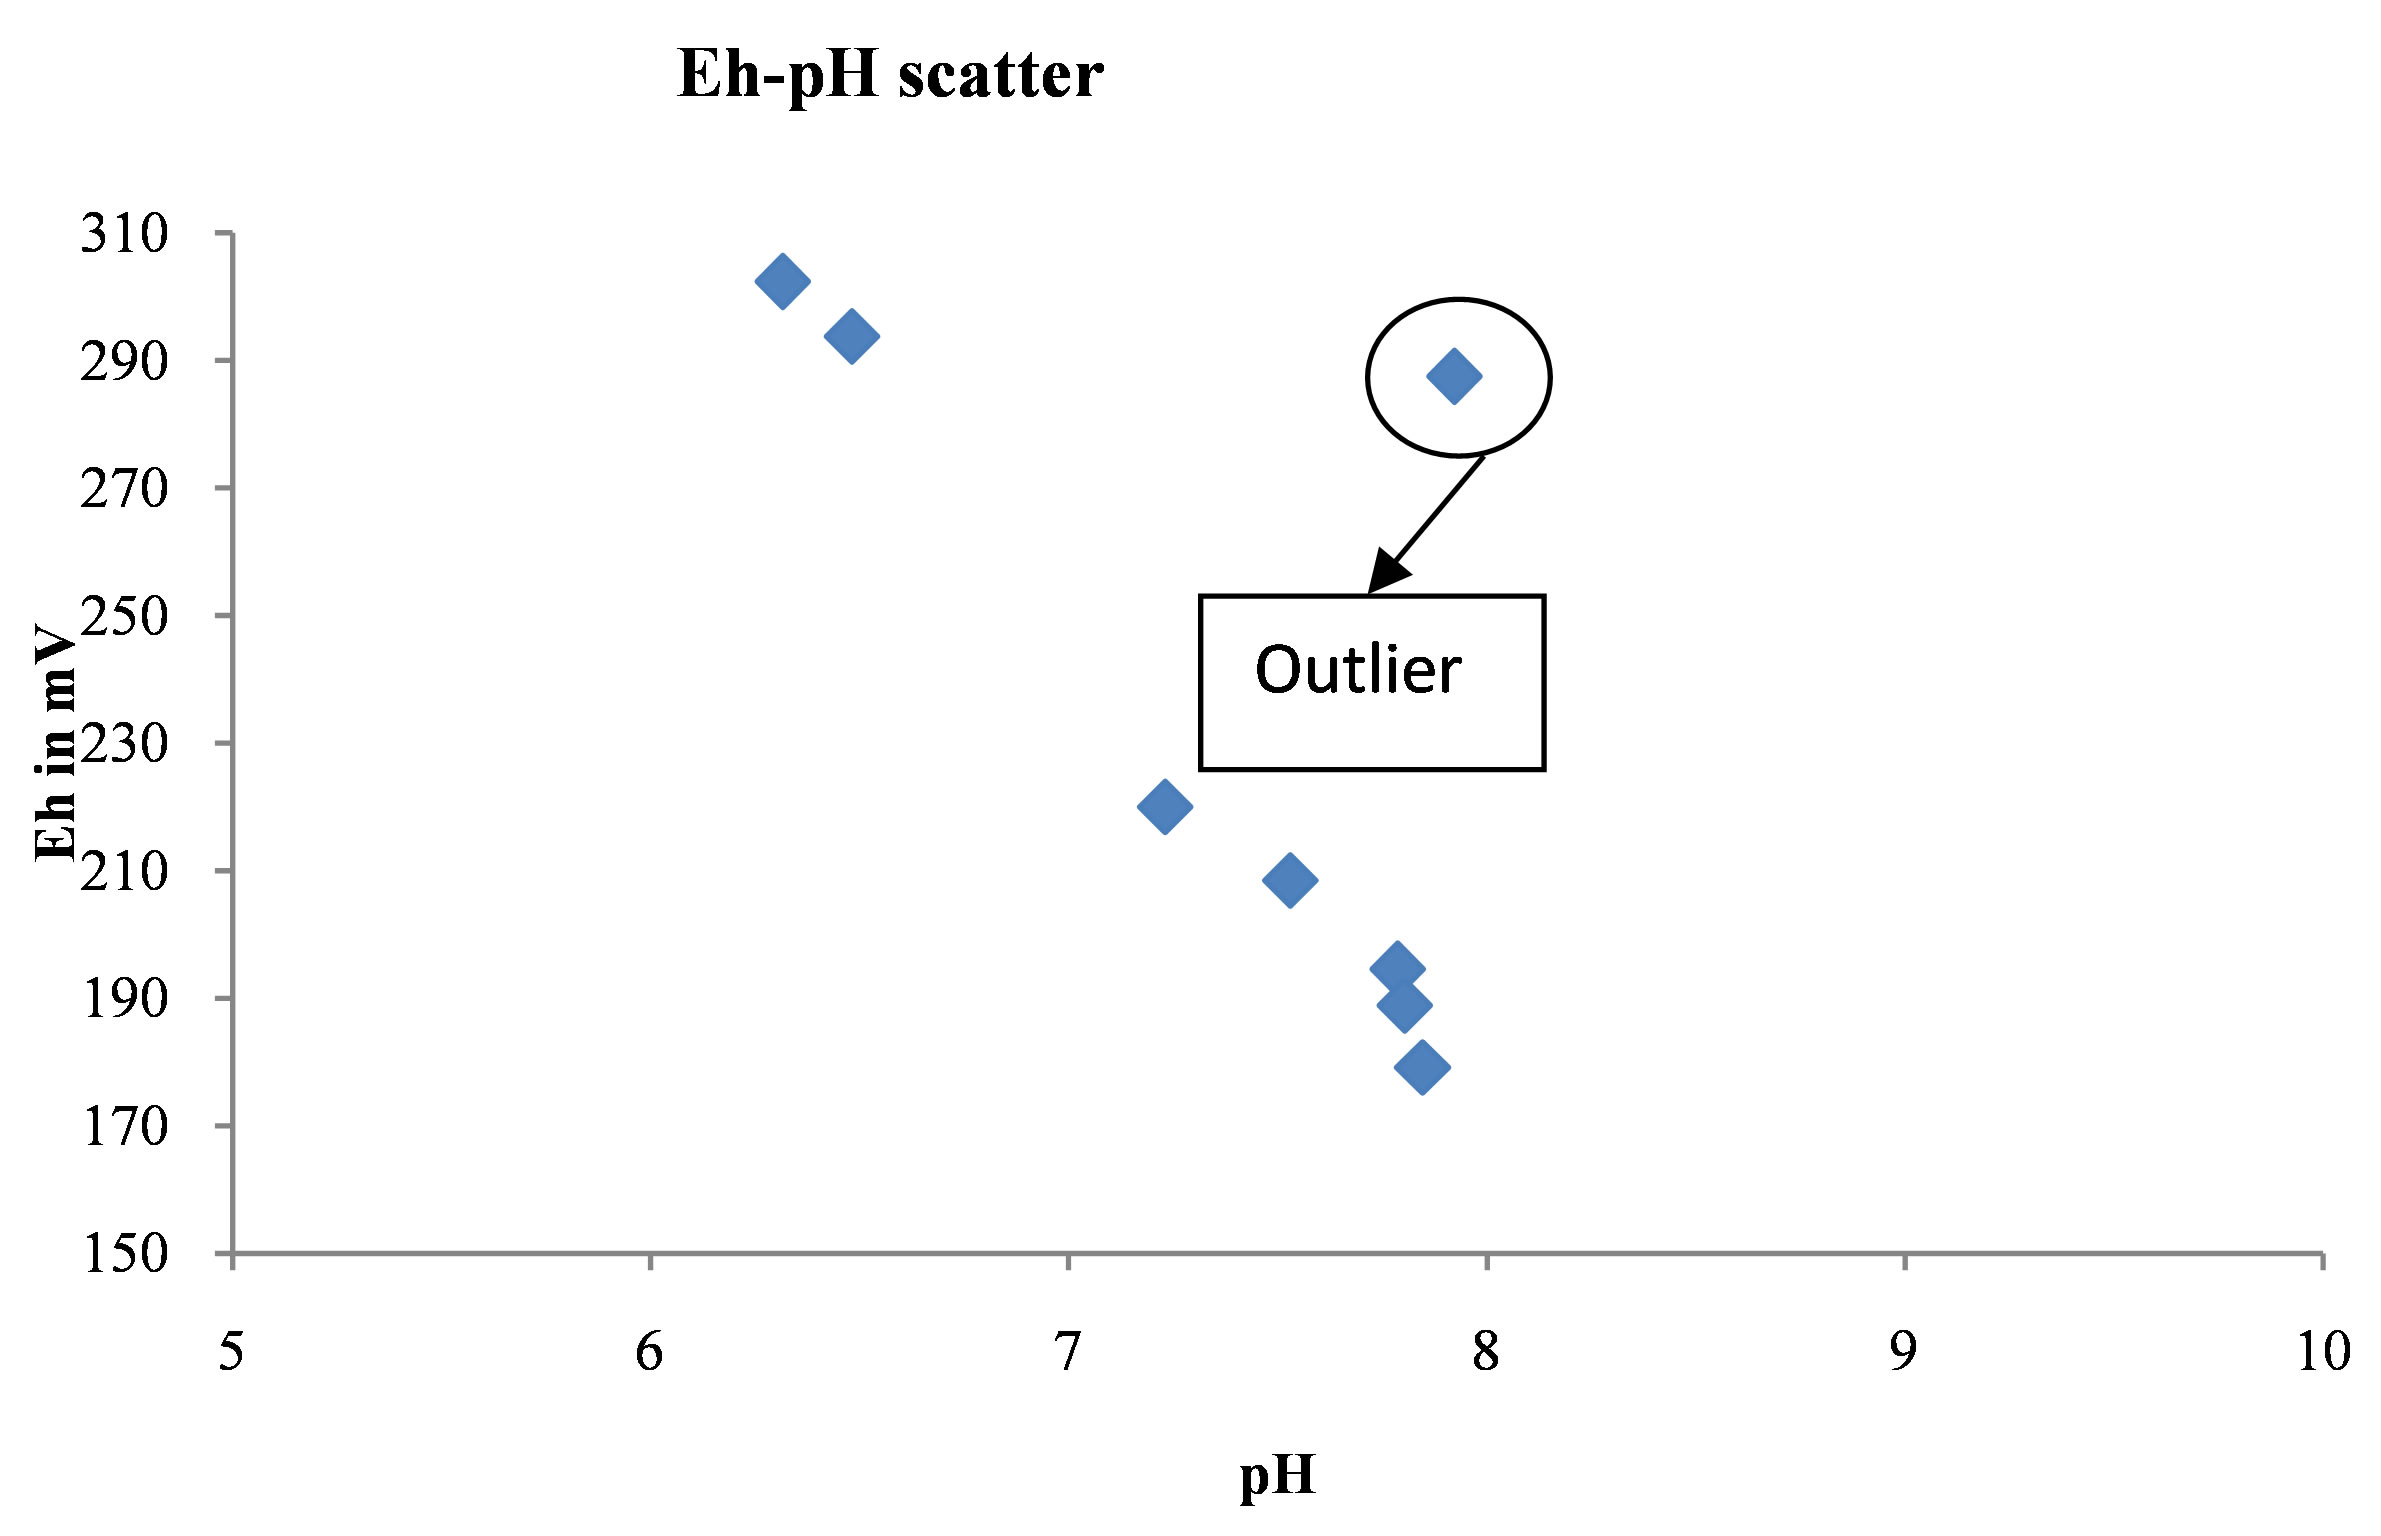
Figure 5. The Eh – pH diagram for water samples.

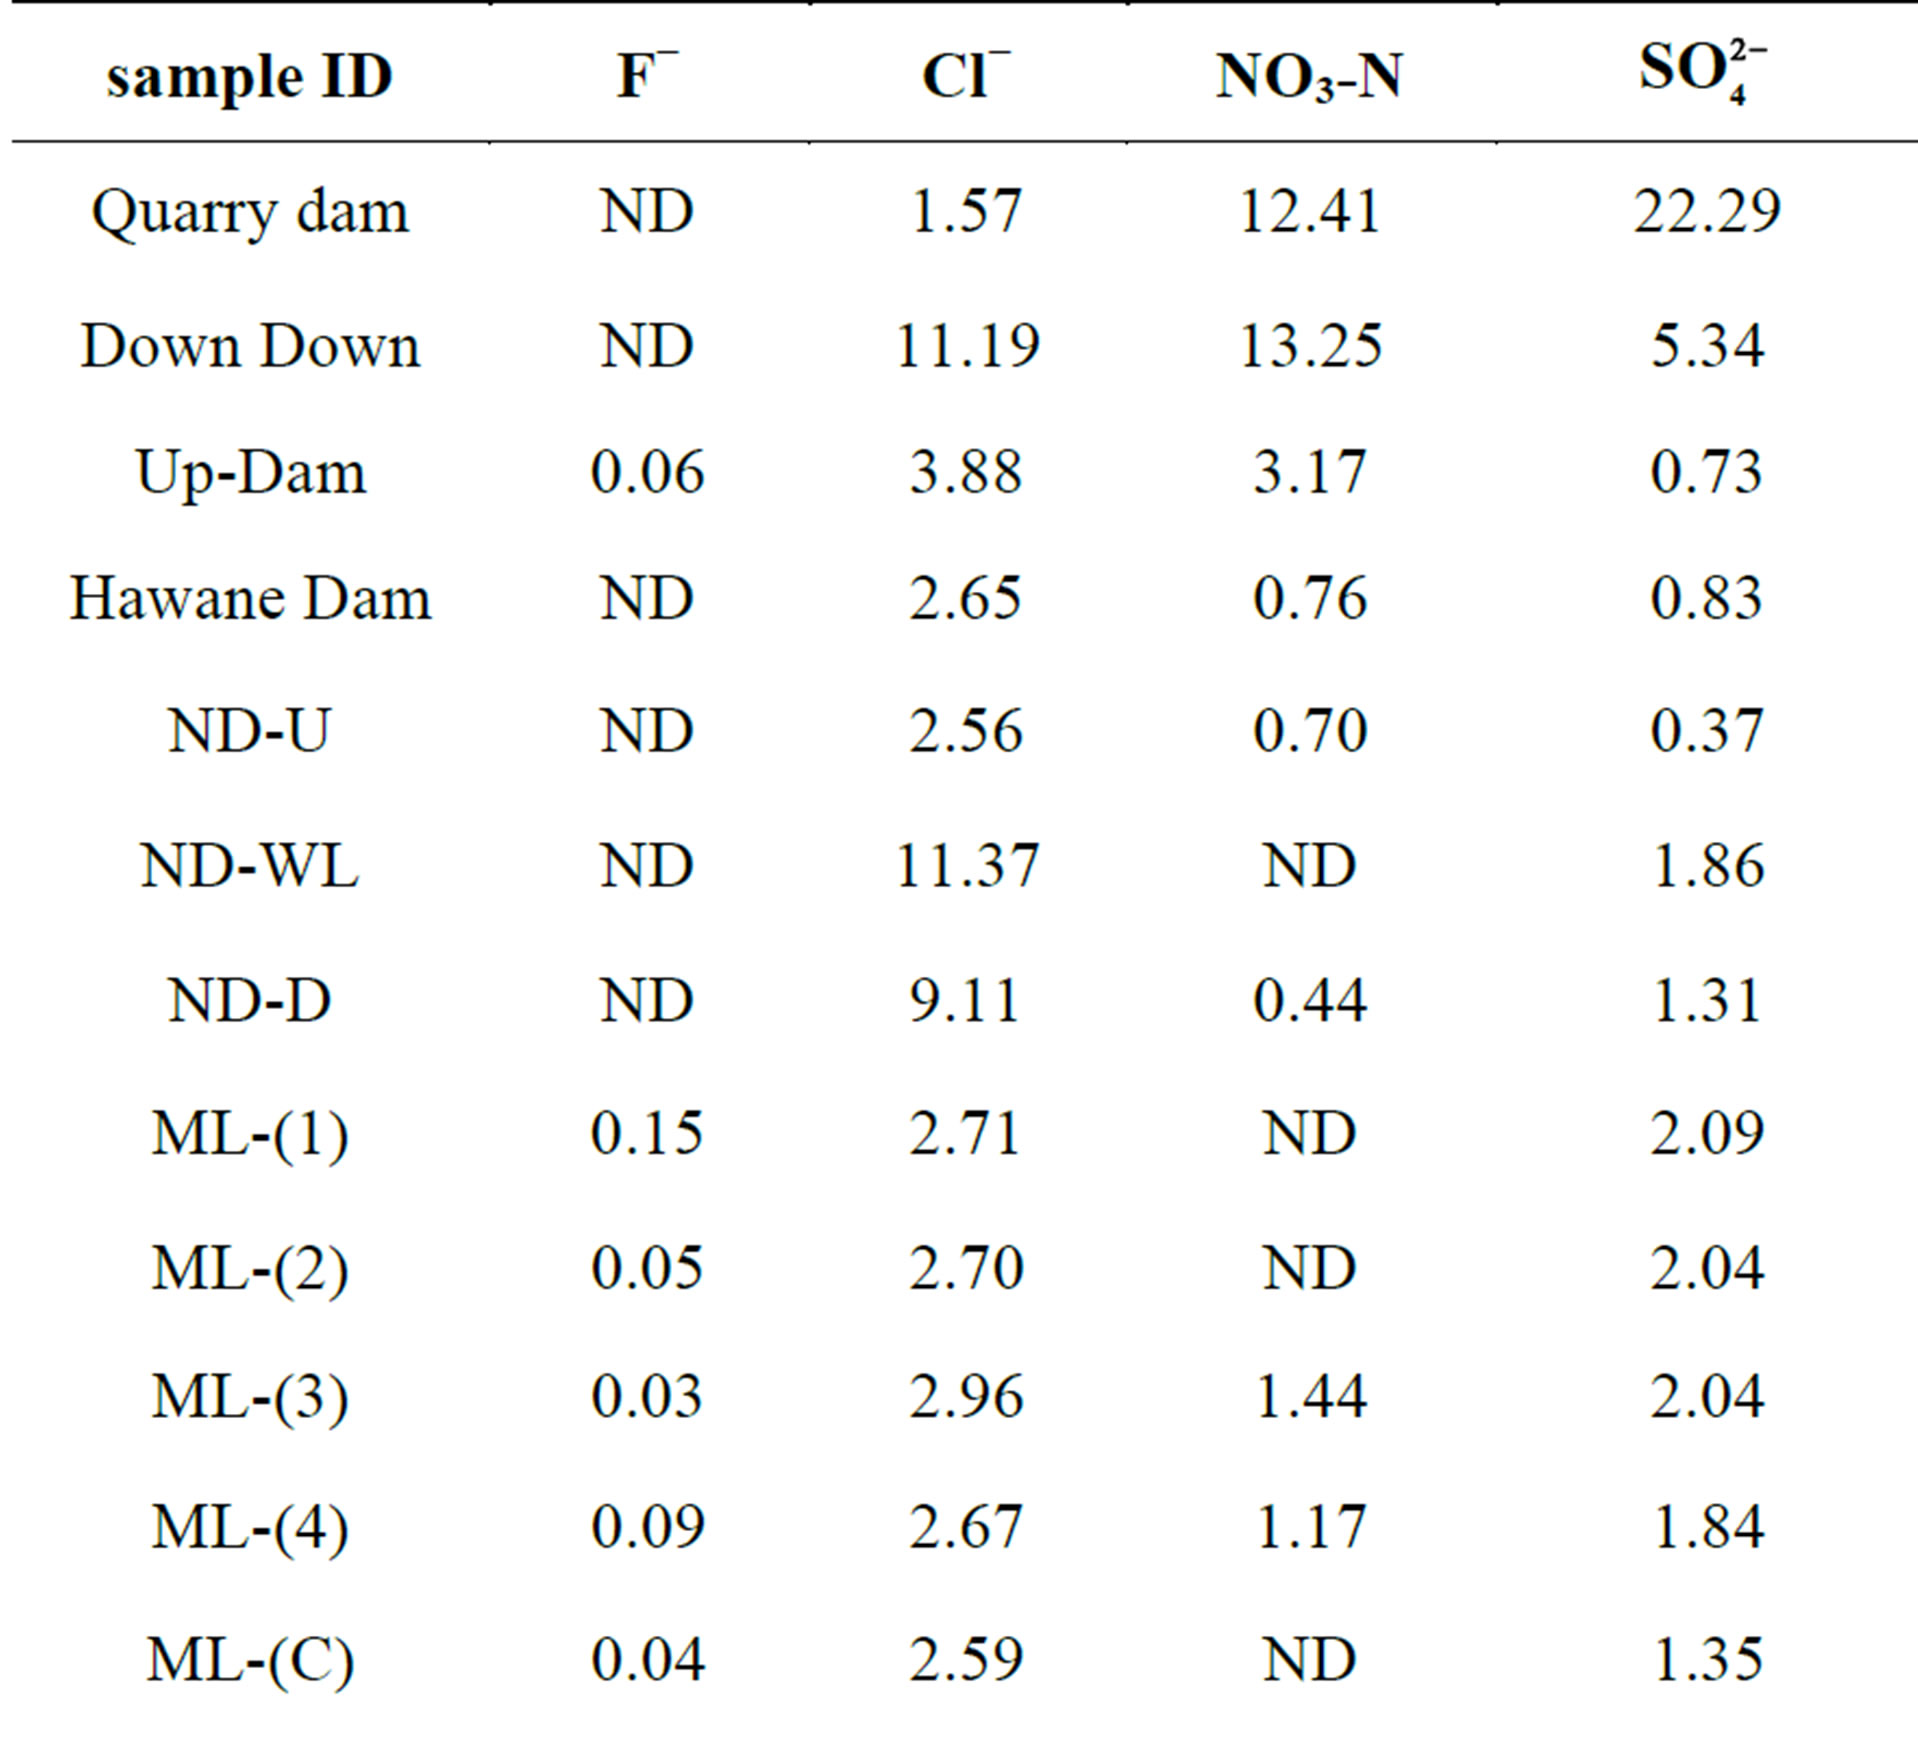
Table 4. Anion levels (ppm) in water bodies around the old Ngwenya Mine.
ND—not detectible.
not detectible in most of the sites. Flourides are the most toxic of the anions detected in this study. They cause dental flourosis when their level is geater than 1.5 ppm in drinking water [25]. It is infered that the users of the water found around Ngwenya are safe from anion toxicity because the levels of all the anions studied are less than their maximum contamination limits. The water in the three sites that had nitrate levels above the MCL are all not used for human consumption.
3.4. Speciation of Iron
The Fe2+ and total iron in selected water samples were quantified by complexation and UV-VIS spectrometry. The Fe3+ levels were obtained by subtraction. Table 5 below shows that the dominant Fe ion in the water samples was the Fe2+. This result is evidence that the waters were affected by AMD pollution because the Fe2+ is one of the immediate products of pyrite oxidation. In the “yellow boy” water, the Fe3+ is dominant because it is gradually produced from the oxidation of the Fe2+ and becomes hydrolysed to form the ferric hydroxide precipitate.
3.5. Heavy Metals in Water
AMD favours heavy metal dissolution in water. The drinking water sites and “yellow boy” water found around Ngwenya Mine were investigated for heavy metal pollution. Heavy metal levels in surface water change due to dilution by rainwater which leads to increase in pH hence precipitation of the dissolved heavy metals out of solution accumulating in the sediments. Decreased water turbulence and evaporation also favour metal precipitation from waters to sediments [28].
The “yellow-boy” water was filtered off from the orange-brown precipitate (an indication of AMD pollution), collected from the banks of acid effluent receiving streams and wetland. Generally, Cr, Mn, Fe and Cu recorded the highest levels while Ni and Cd had the lowest levels in “yellow-boy” water. This suggests that there is some interesting chemistry that must be investigated on this manifestation of AMD pollution, “yellow-boy”, especially because relatively extreme levels of the heavy metals were found in it. The information on heavy metal levels in the studied sites was collected and summarised in Table 6 below.
Most of the sites studied were polluted by Cd (83%). Ingestion of water with high Cd content increases salivation and severe stomach irritation leading to diarrhoea [9]. 71% of the drinking water supply sites had Cr mean levels above the maximum admissible level of 0.10 ppm for drinking water and aesthetic value [8]. This implies
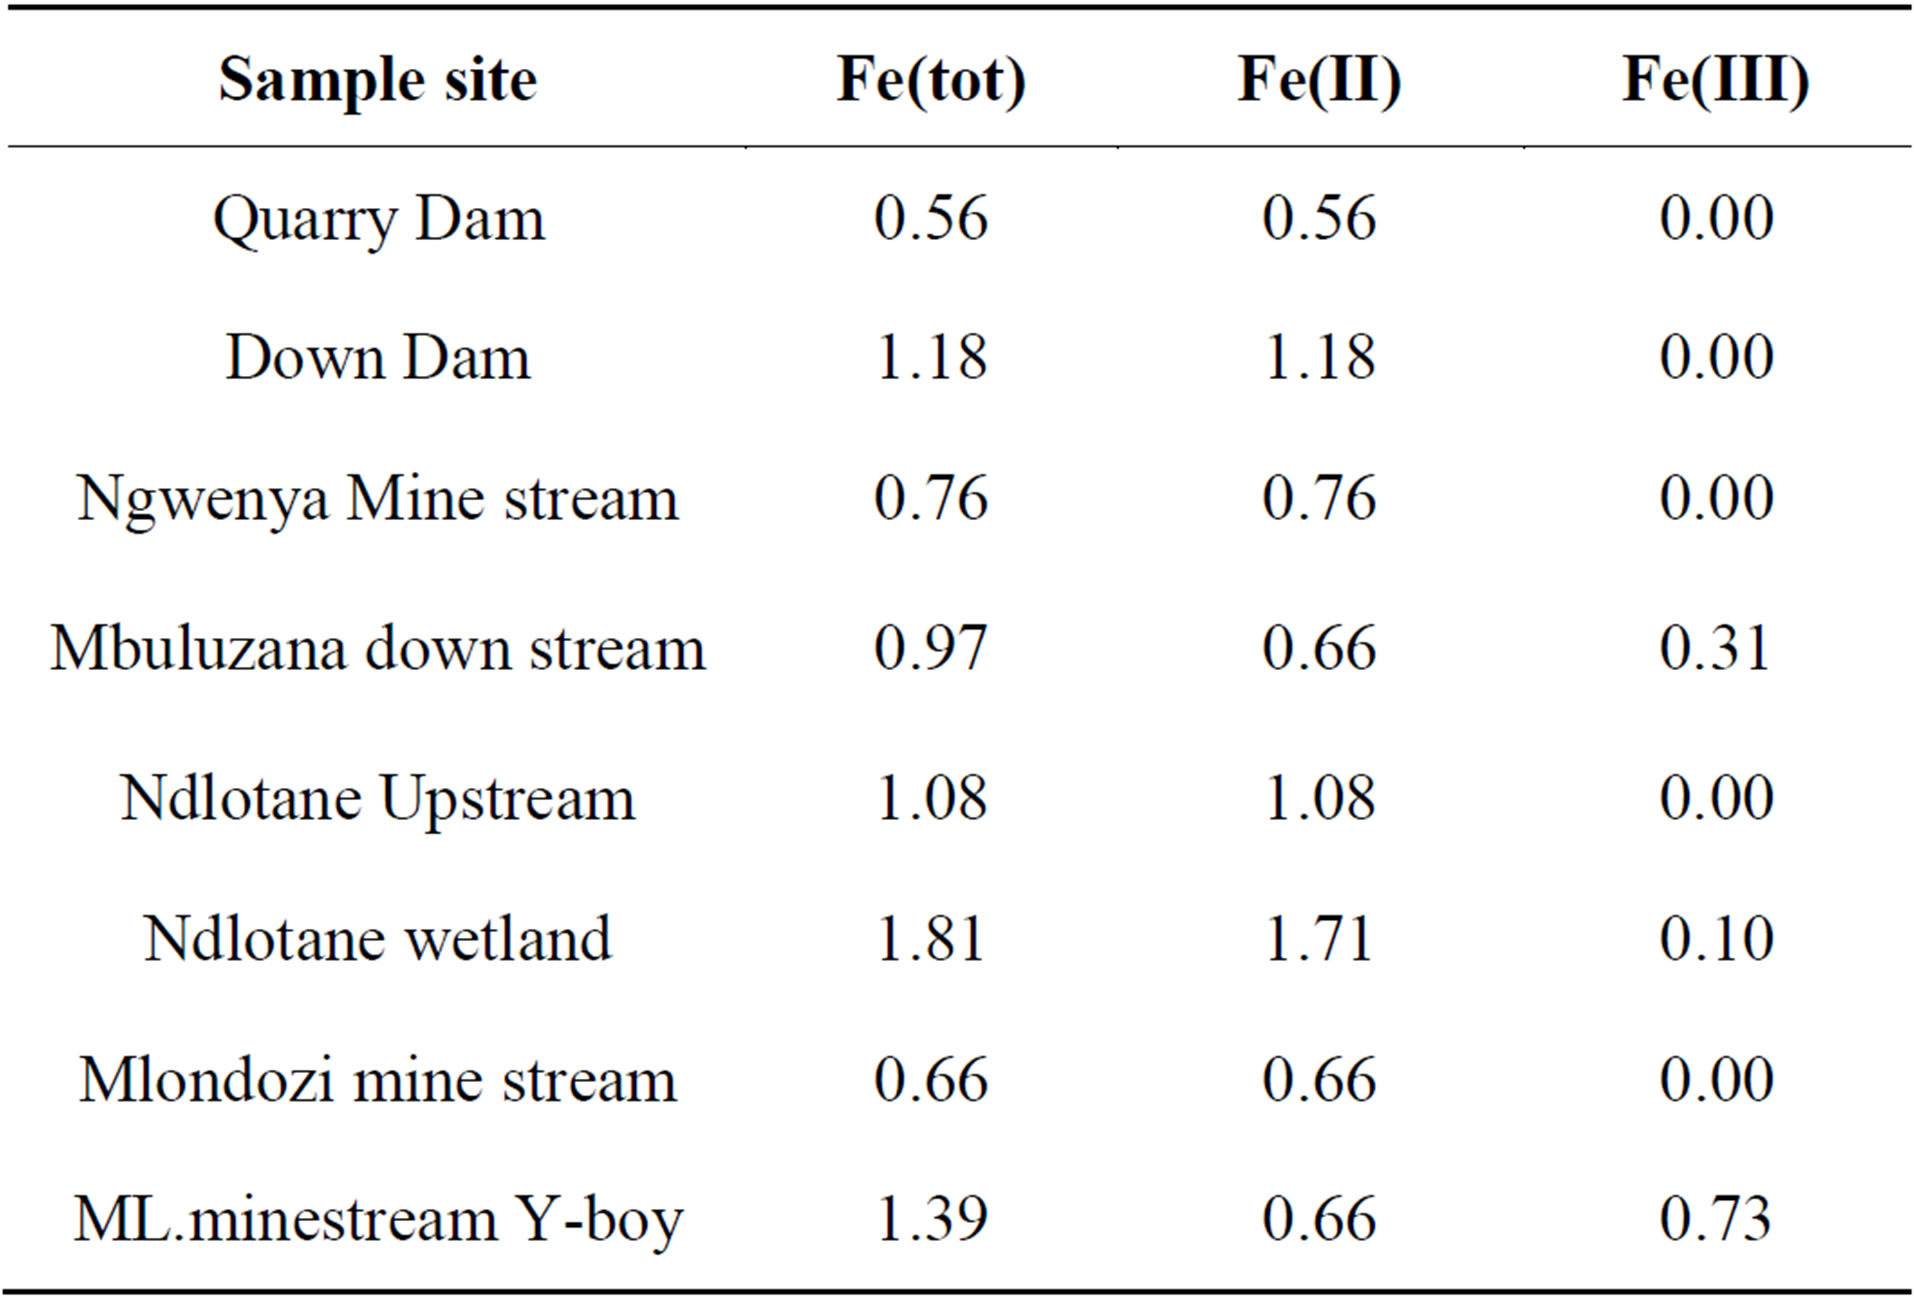
Table 5. Contributions of the [Fe2+] and [Fe3+] in the total iron concentration (ppm) in the water bodies.

Table 6. Summary of the state of each heavy metal in all the sites under investigation.
%—percentage of sites whose heavy metal level is above maximum admissible level.
that the communities that use these water supplies bear the health risk of Cr poisoning; Cr is carcinogenic [9]. Underdevelopment of roots in plants can be caused by Cr exposure which leads to poor plant growth [9]. The average Ni content for all the drinking water samples exceeded the MCL set at 0.10 ppm by WHO [8]. This result implies that all the dams and streams investigated need attention on Ni pollution. Ni is carcinogenic and longterm exposure can result in loss of body weight, heart and liver damage, and skin irritation [9]. 42% of the water bodies under discussion need attention on Co pollution. Ingestion of excess Co causes nausea, vomiting and severe heart effects. Mn mean level was also above the MCL (0.05 ppm) with 17% of the investigated sites polluted with Mn. Only 4% of the sites were polluted with Fe. Excess Fe in the human body may cause toxemia of pregnancy, tumors and may damage heart muscle tissues [29]. In cattle, excess dissolved Fe discourages adequate water intake and consequent adverse effect on milk production [19]. It is worth noting that the yellow-boy water from the wetland recorded high levels of some metals (Mn and Fe). This suggests that wetlands can be used to naturally attenuate dissolved heavy metals in the environment [27]. All the water bodies were free from Cu, Pb and Zn pollution. Finally, the quality of surface water in the vicinity of the Ngwenya Iron Ore Mine is deteriorated due to the activities in the old mine, and it is highly probable that some current human activities exacerbate the situation. Hence, the water pollution by heavy metals is mainly anthropogenic.
4. Conclusion
Safe drinking water is a birthright for all humans while all biota has a right to clean habitable water. Water bodies around the Ngwenya Mine receive contaminants from the old abandoned mine driven by AMD and also by runoff. The presence of AMD pollution in the receiving streams is evidenced by the occurrence of ferric hydroxide (yellow boy) at their banks. There is some interesting Chemistry that should be investigated in the yellow boy because relatively high heavy metal levels were found in its water. The AMD mobilizes the heavy metals into the aquatic environment exposing biota to heavy metal pollution through the use of such contaminated water. Heavy metals pollute the environment through chronic effects. Even if they are available in the water in trace amounts they accumulate in water bodies on a long time exposure until pollution levels are reached. Thus, the population around the mine bears the risk of heavy metal pollution. The State needs to set up sound remediation strategies to save the population around the Ngwenya Mine from the heavy metal pollution they are currently being exposed to by using water polluted by some previous mining activities. This study shows that there is no health risk from anion pollution in waters around the mine.
Acknowledgements
We would like to thank the Swaziland National Trust Commission (SNTC) for granting us the permission of entry from time to time into the study area and an anonymous reviewer for his comments and constructive suggestions.
REFERENCES
- C. L. Dlamini, A. O. Fadiran and J. M. Thwala, “A Study of Environmental Assessment of Acid Mine Drainage in Ngwenya, Swaziland,” Journal of Environmental Protection, Vol. 4, No. 11B, 2013, pp. 20-26. http://dx.doi.org/10.4236/jep.2013.411B003
- S. R. Jennings, D. R. Neuman and P. S. Blicker, “Acid Mine Drainage and Effects on Fish Health and Ecology: A Review,” Reclamation Research Group Publication, Bozeman, 2008.
- R. F. Fuggle and M. A Rabie. “Environmental Management in South Africa,” Juta & Co., Ltd., Cape Town, 2000.
- M. Gosar, “Environmental Impacts of Metal Mining,” RMZ-Materials and Geoenvironment, Vol. 51, No 4, 2004, pp. 2097-2107.
- S. Bega, “No Mine Dump Far Enough, No Corporate Big Enough, by Mariette Liefferink,” FSE Press, 2011.
- A. E. Meadows and A. A. Carpenter, “Acid Mine Drainage and Groundwater Pollution,” Groundwater Pollution Primer, CE 4594: Soil and Groundqwater Pollution. Civil Engineering Department, Virginia Tech., 1997.
- BC Wild and EMCBC, “Acid Mine Drainage: Water and Water Pollution Issues in BC,” Environmental Mining Council of British Columbia, Canada.
- M. Gebrekidan and Z. Samuel, (MEJS), “Concentrations of Heavy metals in Drinking Water from Urban Areas of the Tigray Region, Northern Ethiopia,” Mekelle University, Vol. 3, No. 1, 2011, pp. 105-121.
- R. S. Lokhande, P. U. Singare and D. S. Pimple, “Pollution in Water of Kasardi River Flowing along Taloja Industrial Area of Mumbai, India,” World Environment, Vol. 1, No. 1, 2011, pp. 6-13.
- E. G. Regis, “Assessment of the Effects of Acid Mine Drainage on Mogpog River Ecosystem, Marinduque, Phillippines, and Possible Impacts on Human Communities,” Ph.D. Dissertation, 2006.
- Wikipedia, “Acid Mine Drainage,” 2002
- D. K. Niyogi, W. M. Lewis Jr., and D. M. McKnight, “Effects of Stress from Mine Drainage on Diversity, Biomass and Functions of Primary Producers in Mountain Streams,” Department of Zoology, University of Otago, Dunedin, 2002
- H. Tutu, E. M. Cukrowska, V. Dohnal and J. Havel, “Application of Artificial Neural Networks for Classification of Uranium Distribution in the Central Rand Goldfield, South Africa, and Assessment,” Environmental Modelling, Vol. 10, No. 2, 2005, pp. 143-152. http://dx.doi.org/10.1007/s10666-005-0214-x
- E. U. Etim and G. U. Adie, “Assessment of Toxic Heavy Metal Loading in Topsoil Samples within the Vicinity of a Limestone Quarry in South Western Nigeria,” African Journal of Environmental Science and Technology, Vol. 6, No. 8, 2012, pp. 322-330.
- Tuberose, “Heavy Metal Toxicity,” www.Tuberose.com/Heavy_Metal_Toxicity.html
- M. Jopony and F. Tongkul, “Acid Mine Drainage at Mamut Copper Mine, Sabah, Malaysia,” School of Science and Technology, Universiti Malaysia Sabah, Kota Kinabalu, 2009.
- M. C. Jung, J. S. Ahn and H. Chon, “Environmental Contamination and Sequential Extraction of Trace Elements from Mine Wastes around Various Metalliferous Mines in Korea,” Geosystem Engineering, Vol. 4, No. 2, 2001, pp. 50-60. http://dx.doi.org/10.1080/12269328.2001.10541168
- E. Galan, M. I. Carretero and J. C. Fernandez-Caliani, “Effects of Acid Mine Drainage on Clay Minerals Suspended in the Tinto River (Rio Tinto, Spain). An Experimental Approach,” Clay Minerals, Vol. 34, No. 1, 1999, pp. 99-108. http://dx.doi.org/10.1180/000985599546118
- J. Earle and T. Callaghan, “Impacts of Mine Drainage on Aquatic Life, Water Uses and Man-Made Structures,” Department of Environmental Protection, Harrisburg, 1994.
- Central Statistical Office of Swaziland, “Population for Selected Areas around Ekupheleni (Ngwenya Mine) by Sex,” 2007.
- L. Donnely, “No Quick Fix for Acid Mine Drainage,” Mail and Guardian, 2011.
- Wikipedia, “Acid Mine Drainage,” 2002.
- J. M. Bigham, O. H. Tuovinen, K. S. Brady and T. J. Logan, “Iron Speciation in Acid Mine Effluents: Chemical and Microbial Controls,” Department of Agronomy and Microbiology, The Ohio State university, Columbus, 1984.
- C. Afriyie-Debrah, K. Obiri-Danso and J. H. Ephriam, “Effect of Acid Mine Drainage on Creeks or Streams in a Mining Community in Ghana and Treatment Options,” 2010 International Conference on Environmental Engineering and Applications (ICEEA), 10-12 September 2010, pp. 285-290.
- E. Mswane, “Determination of Levels of Inorganic Anions in Water and Sediments of the Black Mbuluzi River along the Mhlume-Simunye Sugar Plantations in Swaziland,” M.Sc. Final Year Research Report, University of Swaziland, Kwaluseni, 2007.
- N. F. Gray, “Water Quality Problems and Solutions,” John Wiley, New York, 1994, pp. 118-132.
- A. D. O’Sullivan, R. Conlon, B. Moran and M. Otte, “Characterisation of Constructed Wetland Substrates by Chemical Sequential Extraction and X-Ray Diffraction Analyses,” Biology and Environment: Proceedings of the Royal Irish Academy, Vol. 105B, No. 2, 2005, pp. 87-94. http://dx.doi.org/10.3318/BIOE.2005.105.2.87
- A. Concas, C. Ardau, A. Cristini, P. Zuddas and G. Cao, “Mobility of Heavy Metals from Tailings to Stream Waters in a Mining Activity Contaminated Site,” Chemosphere, Vol. 63, No. 2, 2006, pp. 244-253. http://dx.doi.org/10.1016/j.chemosphere.2005.08.024
- S. Singh, S. Lal, J. Harjit, S. Amlathe and H. C. Kataria, “Potential of Metal Extractants in Determination of Trace Metals in Water Sample,” Advanced Studies in Biology, Vol. 3, No. 5, 2011, pp. 239-246.