Journal of Environmental Protection
Vol. 3 No. 8A (2012) , Article ID: 21785 , 11 pages DOI:10.4236/jep.2012.328103
Water Quality Assessment of Jose Antonio Alzate Dam, the Lerma River and Its Tributaries in the State of Mexico, Mexico
![]()
1Área de Química y Fisicoquímica Ambiental, Depto de Ciencias Básicas, División de Ciencias Básicas e Ingeniería, UAM-Azcapotzalco, Ciudad de México, D.F., México; 2Departamento de Ingeniería Química, Universidad de Guadalajara, Centro Universitario de Ciencias Exactas e Ingenierías, Guadalajara, Jalisco, México.
Email: *ibarceloq@gmail.com
Received May 13th, 2012; revised June 14th, 2012; accepted July 17th, 2012
Keywords: Water quality; copper; lead; partition coefficients; chemical speciation
ABSTRACT
Water quality was evaluated at sites of the Jose Antonio Alzate Dam, the rivers Lerma, Tejalpa and Temoaya in the State of Mexico, Mexico. The variables measured included pH, conductivity, temperature, dissolved oxygen (DO), ammonia, nitrates, sulfates, sulfides and metal concentrations (Cu and Pb). Chemical speciation for dissolved metals in the aqueous phase was obtained using measured concentrations and the software MINEQL+ (4.5); metal partition coefficients was also obtained using dissolved and particulate concentrations of metals. Hydraulic behavior of the studied water bodies was investigated and the fate of Cu and Pb ions was simulated. The simulation results indicate that the Lerma River provides the majority of organic matter and metal contaminants as a result of a poor oxygen saturation velocity, and showed a slight improvement when the Lerma River is subjected to its tributaries Tejalapa and Temoaya Rivers. Under the reducing conditions predominating along the dam and from the results of aqueous phase chemical speciation, it was found that sulfide metal-associated species are the ones that predominate. It was demonstrated that in general, the rivers Tejalapa and Temoaya presented the best water quality. The Lerma River oxygen saturation improves after the rainy season, but it worsens during the dry season. Due to irregular topography, the small slope prevailing in the Lerma River, and the almost nonexisting water flow, zones with different characteristics are formed within the dam. The sedimentation contributes in the generation of local eddies causing the existence of a small diffusive flow. The order of partition coefficient was Pb > Cu. Cu presented the highest risk levels in the dissolved phase.
1. Introduction
The southern part of Toluca Valley is a lacustrine zone typical of highly elevated regions of Mesoamerica. Its systematic study started about a decade ago after the disappearance of the aquatic deposit contained within its central area. The cienega or Lerma Lagoon, is one of the most important lacustrine water bodies of State of Mexico which was dry between 1942 and 1951 due to the construction of an aqueduct that supplied water from the Alto Lerma Basin to Mexico City [1,2]. By the end of 1950´s, it was already known that this lagoon was passing through a desiccation process, and it was expected that this process will be more drastic as more and more water was extracted. A second factor influencing the desiccation process, was the agreement established between the State of Mexico and Federal governments signed in 1971, whereby more water volumes were allowed, during 1971 the flow rate permitted was 13 - 14 m3/s, whereas during 1974, 14.6 m3/s were extracted [3]. Since 1978, a decline of water volumes extracted from the lagoon was observed due to the start of the hydric Cutzamala System (that supplies most of the water consumed by nearby Mexico City). During the next years, the flow rates extracted from the lagoon continued declining until it was stabilized at 4 - 5 m3/s during the 1990s [4].
The health status of the ecosystem of this Basin becomes a more complex problem when drinking water supply is done to the population and to industries of the Toluca Valley by means of groundwater exploitation. Consequently, the 4.3 m3/s of clean water that was expected to be dumped into the Lerma River from the Chignahuapan Lagoon, are substituted by 20 m3/s of wastewater that are dumped at the original start of the Lerma River through the dicharges of town Almoloya del Rio. As the Lerma River path moves northward, more inputs are located from sanitary and industrial origin from the populations of Almoloya del Rio, Tultepec, Santiago Tiangistenco, Calimaya, Metepec, San Mateo Atenco, and San Antonio la Isla, as well as agricultural runoffs from the creeks Tejalpa and Temoaya [5]. Finally, when the Lerma River enters Jose Antonio Alzate Dam, this last one becomes not only a useless ecosystem but it also acquires sanitary conditions with whith high exposure potential risks [6]. From the water quality point of view, the dilution factor decreases significantly during the months of May through August due to the low water volumes of the dam and the contaminant concentrations can increase [7], despite the fact that keeping the water levels close to the operational minimum during four consecutive months is not justifiable due to the poor water quality used for agricultural purposes. Eutrophication phenomenon, caused by the elevated volumes of organic matter, phosphates and nitrogen derivatives contained in the discharges received by the dam, considerably affects this water body and favors the growth of aquatic shrubs [8].
Water pollution by metals is mainly associated to water discharges from industrial processes ending up into the Lerma River and into the Jose Antonio Alzate Dam. These metals alter the aquatic systems where they remain trapped and are accumulated due to sedimentation [9]. The uncontrolled wastewaters discharges from municipal and industrial activities, as well as from agricultural runoffs [10], untreated or partially treated; induce contamination of water sources, risking more and more its complete use.
In this work, a study is presented about the water quality of Lerma River, two of its tributaries (Tejalapa and Temoaya Rivers) and some sites of the Jose Antonio Alzate Dam. In addition, copper and lead concentrations evolution with respect to the time based on previous works [11,12] in which point evaluation was insufficient to establish the water quality of the dam, is presented. Given the actual septic conditions of the dam, it was required to establish recovery zones so that simulation of metals transport could be performed. In fact, it has been reported that the water quality variables were related to the kinematics of water quality (BOD5 and DO) [13]. In their study, a mathematical model was complemented by including advection and dispersion processes and resulting into two simultaneous partial differential equations which were solved, in the case of real water bodies using numerical methods establishing initial and boundary conditions.
2. Materials and Methods
Figure 1 shows the sampled sites along the Lerma River and Jose Antonio Alzate dam along with their corresponding keys (Table 1). This figure includes the sites selected within the dam to conduct chemical speciation and evaluation of the partition coefficients. pH, temperature, and conductivity were measured in situ using a Corning instrument (calibrated according to method 120.1 de EPA-600/4-79-020) [14]; dissolved oxygen (DO), was measured with a digital oxymeter YSI model 58. Water samples were collected from each site from the water column at 20 cm deep (considered as surface sampled to avoid contact with atmosphere) and from the bottom using a vanDorn instrument; avoiding remove sediment when sample was collected [8]. Water samples were collected in five polyethylene bottles of one liter with HNO3 acid (1 mL, suprapur) added to preserve samples for analysis of total metal, dissolved metals (filtered to 0.45 micron pore) and suspended solids at each site, where the results were used to calculate the partition coefficients.
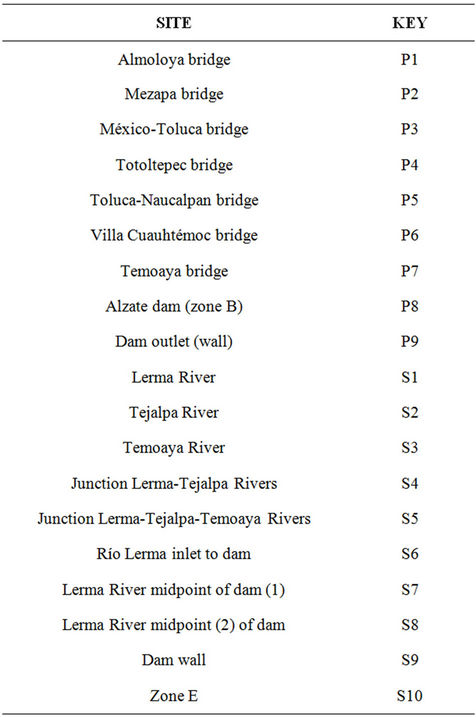
Table 1. Keys for water sample collection sites from Lerma Basin.
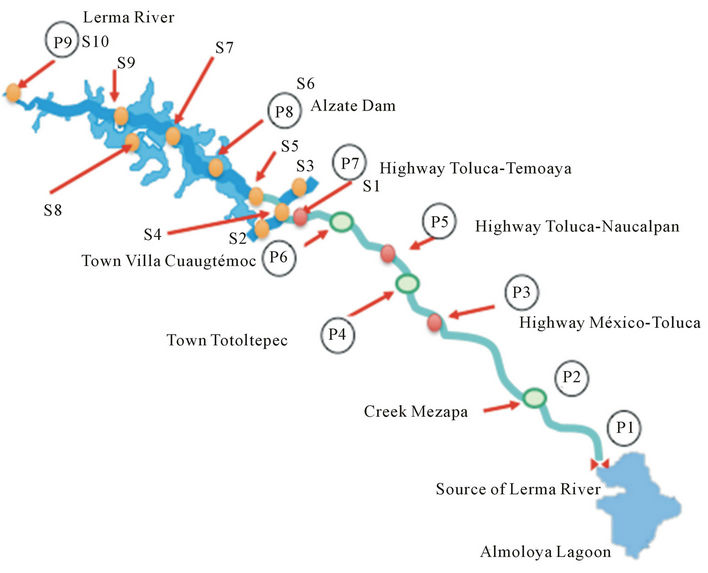
Figure 1. Sampling sites along the Alto Lerma Basin.
For the dissolved chemical speciation (cations) were collected without preservative in polyethylene bottles a total of three liters each site.
All the samples were maintained at 4˚C until analyzed. In the case of anion analysis, samples were collected also in two polyethylene bottles in acid-free of one liter and maintained at 4˚C until analyzed. Anion analysis followed protocols from Standard Methods [15]; HPLC measurements were conducted using a Modular Shimadzu instrument; sulfides were measured using a comercial kit (Hatch); organic carbon was measured using an Analytik Jena multi CN 3000 instrument. All studies were conducted in two sampling campaigns per year during periods of dry season during the years 2008 and 2009.
Samples for copper and lead measurements were centrifuged at 4500 rpm using a Beckman Coulter, Allegra Tm 21 Centrifuge for 20 min and then vacuum filtered using a 0.2 mm MFS filter paper. Filtered samples were acid-digested using suprapur HNO3 and HF acids in a CEM Mars-5 microwave oven. Digested samples were analyzed by Atomic Absorption Spectrometry using a Thermo Elemental, Solaar M6 model in the flame or graphite furnace modes, depending of the element analyzed. Readings were done in triplicate to check for reproducibility of data.
As shown in Figure 1 at the points marked S was carried sampling campaigns in situ physicochemical and physical measurements of water in the Jose Antonio Alzate Dam and it influents to determine the existing conditions and to generate data to run and calibrate the model as well as to do obtain the dissolved speciation using the software MINEQL V 4.0. It has been observed that Jose Antonio Alzate Dam does not present the same behavior throughout the year, but instead it presents seasonally repeated cycles [7,8].
The hydrodynamic mobility of metals was simulated using the software Surface-Water Modeling System (SMS) version 8.1. This software requires a digitalized map of the study zone to generate a net (subroutine GFGEN). The hydrodynamics of the dam was calculated using subroutine RMA2, which is a subroutine that is used to calculate the advective transport of contaminant (subroutine RMA4). Morphology of the dam was obtained from two digital topographic charts [16] and updated using satellite images from Google Earth. Water velocities were measured in the field using a Vernier brand flowmeter at intervals of 0 to 4 m/s and resolution of 0.0012 m/s; the flowmeter was connected to an interface that stores data within a period of 100 s. Directions of surface flow were obtained using a GPS instrument Carmin model Etrex with precision of 1 - 5 m and 15 s of velocity response for both dry and rainy seasons. A net was generated as a function of the morphology of the zone by considering that SMS 8.1 has the limitation of having a maximum of 10,000 nodes and 30,000 elements. Once the net was generated, the hydrodynamic modeling was performed using RMA2. Program RMA2 solves two-dimensional mass and momentum equations and integrates through the deepness of the dam [17]. The equations solved are as follows:
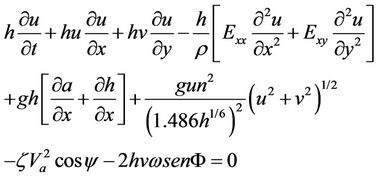 (1)
(1)
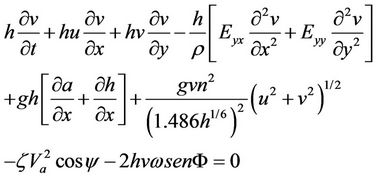 (2)
(2)
 (3)
(3)
where:
h = depth of the water, m u, v = velocities of water in the direction x and y, m/s t = time, s r = density of the fluid, g/m3
E = Eddy viscosity coefficient g = acceleration due to gravity, m/s2
a = elevation of bottom, m n = Manning’s roughness n-value z = Empirical wind shear coefficient Va = Wind speed, m/s Y = Wind direction W = Rate of angular rotation of the Earth F = local Latitude Equations (1) through (3) were solved using finite elements using the Galerkin weighted residuals method. Form functions are quadratic for velocity and linear for deepness. Space integration was performed using gaussian integration. Time-derivatives were replaced by nonlinear finite difference approximations. It was assumed that variables can change on each time interval according to:
 (4)
(4)
Time-derivative is obtained from equation (4) is transformed to a finite difference; a, b, c are constants [17]. Adjustment of parameters of hydrodynamic model was done based on physical considerations and by means of mathematical optimization in a way such that the agreement between the observed data and the model results was the closest possible. Once the hydrodynamic model was solved following the SMS scheme, the next step was to solve, using RMA4, the transport equation for contaminant written in the form [18]:
![]()
 (5)
(5)
where the new variables are:
C = contaminant concentration Dx, Dy = turbulent mixing coefficients (dispersion)
k = first order kinetic specific constant of contaminant R(C) = rainy/evaporation rate.
Once the model was verified and adjusted, the hydrodynamic mobility and fate of copper and lead were established to determine the water quality based upon the protocols established in Mexican regulations [19,20].
3. Results and Interpretation
Shows the mean of all results, the standard deviation was between 3% and 8%, to validate the three replicates per analysis Q test was used with a confidence level of 90%, in each figure shows the corresponding standard desviation.
Figure 2 shows the results of the variation in pH and
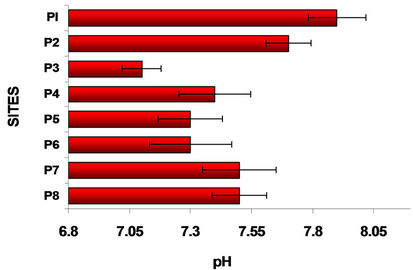
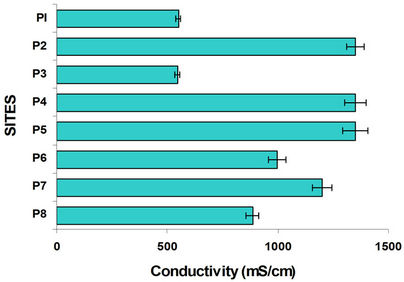
Figure 2. pH and conductivity variation in water columns at different sites.
conductivity along the Lerma River, its tributaries, the mixing of these and the water of Alzate Dam. Site P1 (Almoloya River) is the site where Lerma River starts. The river Lerma presented the more alkaline pH possibly is due to the addition of detergents. The water of Lerma river is flowing from the Mezapa site, where initiates a decrease in pH, stabilizing in in the rest of the sites. Sites with the lowest conductivities were Almoloya River (P1) and Mexico-Toluca (P3). For the P1 site the metal contamination is negligible and in P3 there is a strong sedimentation [21].
According to Barceló [7,8] the intense photosynthetic activity of the daylight hours is reflected in the concentrations of DO. Depending on the size and depth of the water body, oxygenated surface layer has a diurnal variation of DO and can significantly reduce the oxygen at night, but can also occur that are observed supersaturation of DO concentrations during the day. Aerobic surface layer of a highly eutrophic water body as in the case of the Lerma River and dam Alzate [21], acts as a barrier to anaerobic bottom water, containing H2S and CH4. The products of the anaerobic decomposition of sludge deposited on the bottom of the aquatic system and are oxidized in the surface layer of these.
If the aerobic surface layer disappears can present bad odor, what happens from Mezapa bridge (P2) and in all sites of the course of the Lerma River becoming more serious in the Alzate dam, except Tejalpa and Temoaya rivers whose water is of much better quality and little pollution as observed in the conductivity. Figure 3 shows the results of dissolved oxygen along the river at different sites. Significantly, the amount of O2 dissolved in the heart of the Lerma River (Figure 3) is so low in any season at any depth and at any time, meaning that the river water is so heavily polluted that local microbeological activity fails to complete the oxidation processes, on the one hand on the other there is a slow hydrologic flow taking into account the ratio of water flow velocity and winds [8]. Organic carbon was measured at each site varied as shown in Figure 3.
According to Figure 4 the site P1 (Almoloya River) had the highest oxygenation. Figure 4 shows a trend of nitrate to decrease as it progresses in the course the Lerma River increasing the concentration of ammonium which is closely related to dissolved oxygen; due to the reducing environment of each site with little oxygen. Nitrates from agriculture in the region are driven by runoff to water bodies serve as nutrients to the aquatic weed, like the lily, causing eutrophication of these water bodies. The result of the lack of oxygen causes the nitrates are reduced, Figure 4 shows that the nitrate concentration is much lower in places with very low oxygen, increasing the concentration of ammonia.
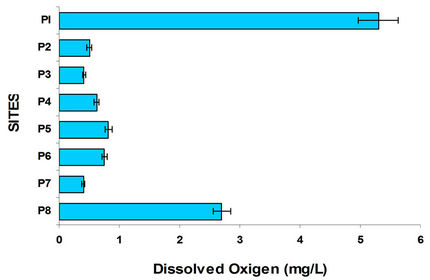
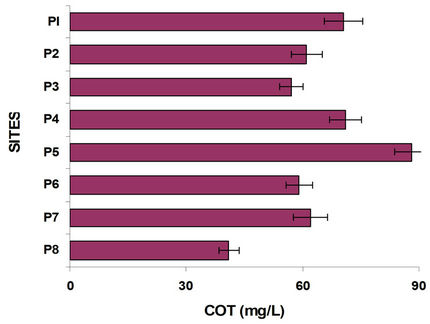
Figure 3. Oxygen and organic carbon variation in the water column at different sites.
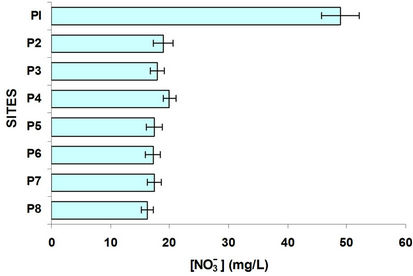
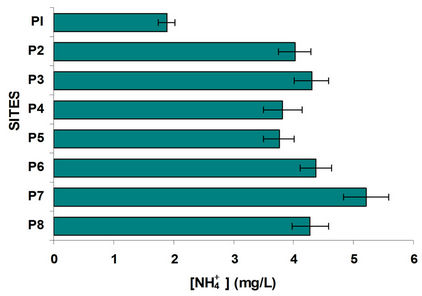
Figure 4. Nitrate and ammonium variation in the water column at different sites.
Was determined and compared the concentration of ammonium with nitrates and sulphates with sulphides, Figures 4 and 5. In the case of sulphates usually come from the discharge of detergents and fertilizers, i.e. municipal waste and agricultural products. Sulfates goes hand in hand with sulphides, where dissolved oxygen is an important parameter of great influence, since in his absence the sulfate is reduced to sulfide; sites with oxygenation problems have decreased levels of sulfates and increased concentrations of sulfides. It is observed that P1 and P2 sites with high population the first and high domestic rural discharges the second have the highest concentration of sulfates; the other sites were low in sulfate. By comparing the graphs in Figure 5 shows the sulfides in opposite direction, it is interesting that even from the P3 site (Highway Mexico-Toluca) exist a dramatic increase in the concentration of sulfides and one decrease in sulfates.
By comparing the graphs of oxygen, sulfur and organic carbon can be observed in P3 and at the following sites, the methanogenesis occurs; there is a strong loss of oxygen and there is high organic load, as indicated by measures of TOC, in the graph of Figure 3. Figure 6 shows the variation of Cu and Pb. Copper present a trend to grow in their concentration, suggesting that comes mainly over agriculture. The incorporation of this metal to the dam J. Alzate is mainly due to the Lerma River. It
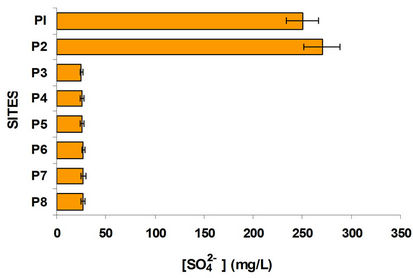
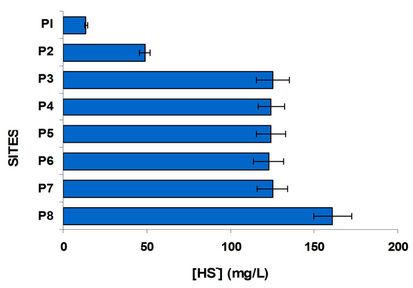
Figure 5. Sulfate and sulfide variation in the water column at different sites.
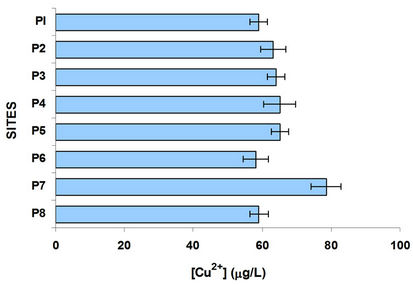
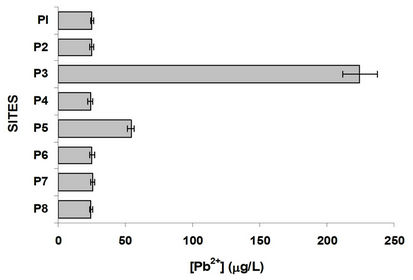
Figure 6. Copper and lead variation in the water column at different sites.
is an ion that has affinity for organic matter and tends mainly associated with organic matter and sulfides, as suggested [7,21-23] in the different studies of this metal in these water bodies, indicating their presence more in sediment than in dissolved form, which is reflected in the relatively low concentration in the aqueous phase. Copper comes from two anthropogenic sources and agriculture industry [21]. Regarding Pb, the P3 site showed the highest concentration, this is located in the industrial zone and with constant traffic; this metal decreases its concentration along the river course.
For the calculations of the chemical speciation of dissolved Cu and Pb were considered average concentration values of these two cations and different anions. In the figure 7 shows the distribution of chemical species of copper [7,21], was observed that the complex ion Cu (HS) is the prevailing practically in water throughout the dam.
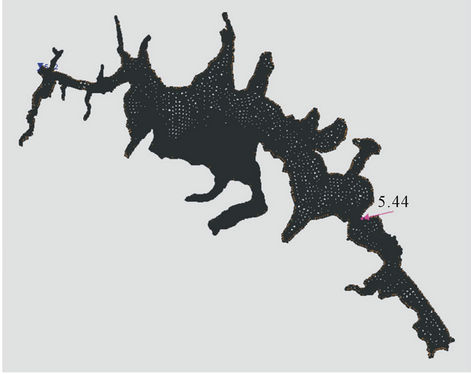
Below is the result of hydrodynamic modeling of the dam Alzate. Taking into account the limitations of RMA2 and RMA4 programs (a maximum of 10,000 nodes and 30,000 elements) and the bathymetry of the dam, Figures 8(a) and 8(b), generated a two-dimensional unstructured mesh with the software GFGEN with the following characteristics: Number of items: 7014, triangular elements: 3895, quadrilateral elements: 3119 and Number of nodes: 18,337. The arrow in both figures
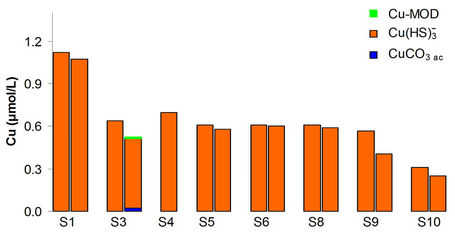
Figure 7. Speciation of copper in the Alzate dam, the checals most relevant are shown.
 (a)
(a)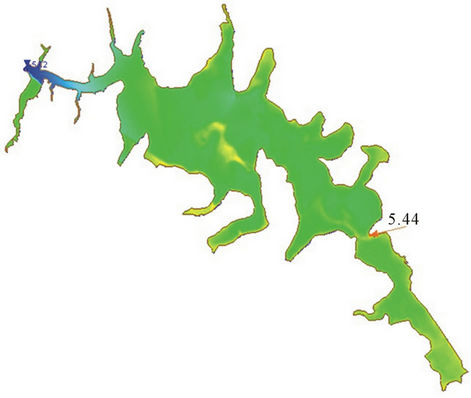 (b)
(b)
Figure 8. (a) Two-dimensional mesh for the morphology of the Jose Antonio Alzate dam; (b) Bathymetry of the dam.
indicates the entry point of the River Lerma to Alzate Dam.
With the mesh generated considering the morphology of the dam, proceeded to the hydrodynamic modeling with RMA2 SMS software subroutine 8.1 (Equations (26), (34) and (35)). This was performed taking the following considerations, the system in steady state, the morphology of the dam was kept constant, the tributary (river Lerma) to the Alzate dam is constant with a value 5.44 m3/s and the level of water in the shade of the dam is 5.72 m. The Manning roughness coefficient n = 0.02 was considered. Although RMA2 has the option of considering the Coriolis force and influence of the wind through the latitude of the site, these options were not used since it did not require calibration, however the turbulent viscosity coefficient if was adjusted for calibrate the flow directions [24-27].
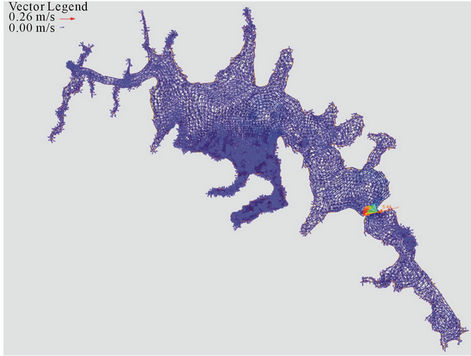
The simulation results are shown in Figures 9(a)-(c). In Figure 9(a) shows the velocity vectors for each node as the software required for use in RMA4. To better understand these results were used to map velocity; figure 9(b) where one can see that the prevailing speed on the dam is less than 0.03 m/s, which is explained by the morphology of the dam and the low slope existing there in.
There are only sites of high speed (sites B and D) but in these flow is concentric as shown in Figure 9(c). Once obtained the hydrodynamic simulation, proceeded to the transport of metals in the dam by the subroutine RMA4. The model was calibrated with data from the samples in the dry season and the period after the rains of 2004.
Figure 10 shows the partition coefficient copper; expect for the zones of the rivers and its convergences the presence of hydroxides and carbonates. In the different sites of the dam the presence of a greater amount of sulphides explain the increase in the particulate material.
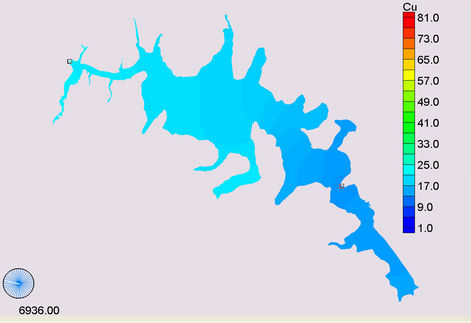
The maximum copper concentration was reached in February and March 2009 (Figure 11(c)) and the minimum in December and January 2009 (Figure 11(d)). The partition coefficient in the Alzate dam was greater than those obtained in the Lerma river and the confluences of the rivers Temoaya and Tejalpa which have similar values, the value of this partition coefficient in the dam may be mainly due to its low depth and pH conditions where it is likely the formation of carbonates mainly in dissolved form.
Copper having a partition coefficient less considered in turn with a smaller diffusion coefficient, where the concentration is affected by changes in the direction of flow and exchange with the sediment. In the case of lead, as for copper, according to the results of speciation the major species are the sulfides (Figure 12) where also the main transporter is the Lerma River. Temoaya River had the lowest concentration of this metal and is where the dissolved fraction was higher. To dam the particulate fraction tends to increase.
Upon arrival at the curtain (S9) of the dam dissolved
 (a)
(a)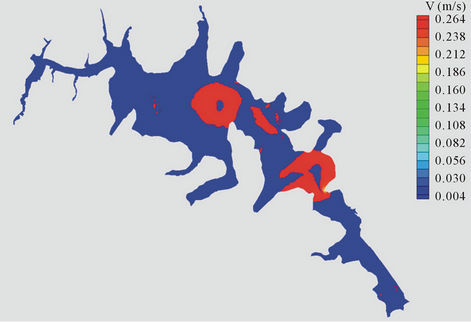 (b)
(b)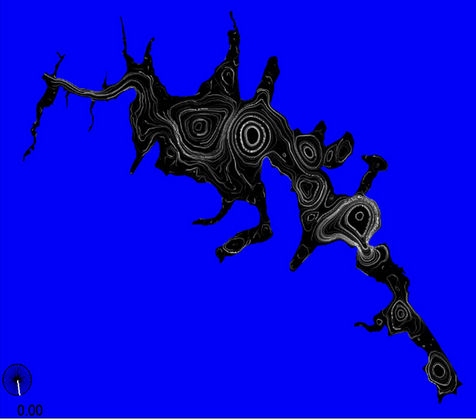 (c)
(c)
Figure 9. (a) Velocity vectors for Jose Antonio Alzate dam; (b) Velocity map of the dam; (c) Lines of flow in the dam.
lead concentration decreases slightly, while reducing the total lead (dissolved lead more lead interacted with the
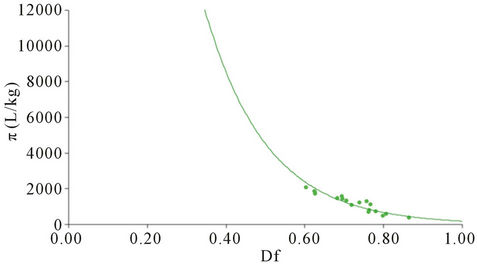
Figure 10. Partition coefficient (π) vs fraction dissolved (Df) of Cu.
particulate matter) is higher, so it is assumed that in this site most of the lead associated with the particulate matter has already sedimented. Can be seen in Figure 13 that there are two groups of behavior, one where the dissolved fraction is almost equal to the particulate and finally one where there is a greater fraction dissolved.
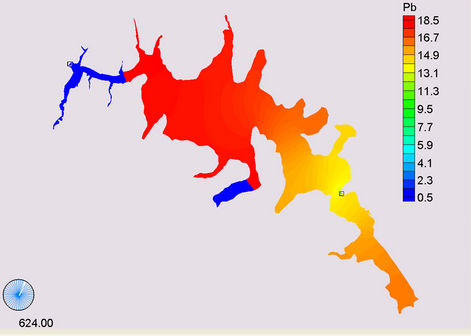
The site E (S10) and the courtain (S9) were found in medium value of partition coefficient, while the rivers and the confluence showed lower values. Lead and copper both had a low partition coefficient therefore considered a lower diffusion coefficient where changes in flow direction did not affect this coefficient. In Figure 14 shows the simulation of lead in different months of the metal in this case the maximum is reached in May (Figure 14(b)) and the minimum in March (Figure 14(d)).
4. Conclusions
The conductivity values reflect the high content of dissolved ions mainly; in Lerma river and dam Alzate. With respect to dissolved oxygen, the best sites were Almoloya of River and Temoaya and Tejalpa rivers since practically all the Lerma River lacks oxygen, increases slightly when it receives water from Tejalpa and Temoaya rivers mainly the latter but deteriorates in Alzate dam. It is noteworthy that after the rainy season improves oxygenation of the Lerma River but is worse in the dry season. From the results obtained of organic carbon mainly Lerma, Tejalpa and Temoaya rivers drag alluvial material toward dam Alzate, adding municipal discharges which increases the high organic load of this body of water that acts as sedimentator. As for Cu and Pb Lerma River downloading them to Alzate dam, Temoaya and Tejalpa rivers download nitrates from agriculture to Alzate dam due to almost no oxygen in the dam these are reduced to ammonium, also sulfates are reduced to sulfides where the important concentrations were determined in addition to the typical smell indicating a strong anaerobic process.
The results of the hydrodynamics led one side that the ss
 (a)
(a)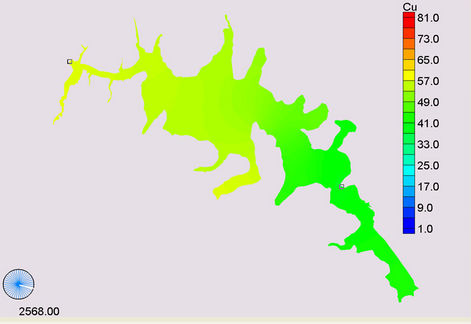 (b)
(b)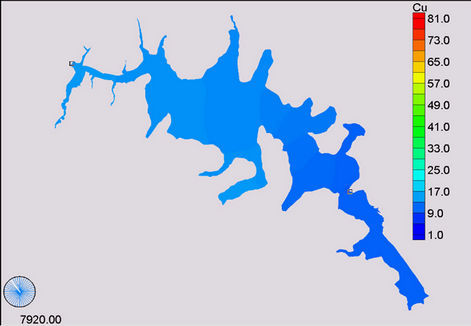 (c)
(c)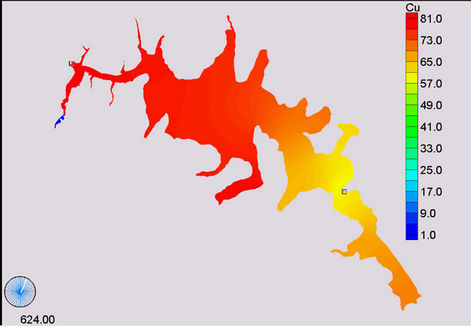 (d)
(d)
Figure 11. Simulation of copper, (a) April; (b) November; (c) January and (d) December.
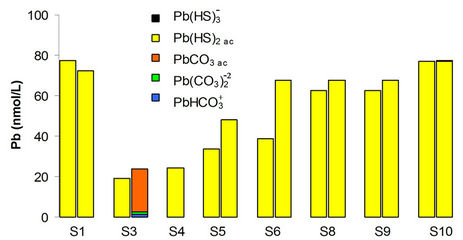
Figure 12. Speciation of lead in the Alzate dam, the chemicals most relevant are shown.
uneven topography of the dam Alzate, the little slope existing in the river Lerma and minimum flow which operates the reservoir, creates zones of different characteristics within the same, also the strong sedimentation contributes to local eddies which allow a diffusive flux small, which leads that copper present a high dispersion of partition coefficient values and indicates the possibility that Cu may be being associated strongly with components of the suspended particulate matter and move to the sediment; situation less strong with lead. The order of
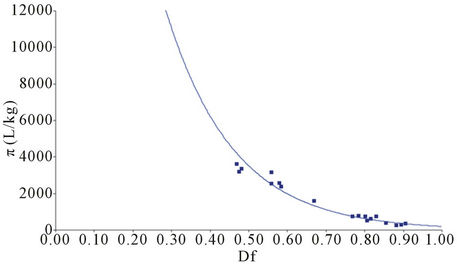
Figure 13. Partition coefficient (p) vs dissolved fraction (Df) of Pb.
the partition coefficient was Pb > Cu, plus it was observed partition coefficient decreased along the dam, reflecting changing system conditions; Alzate dam acts as a metal sequestrant, by phenomena adsorption. Finally we conclude that the Lerma River is the largest contributor of pollutants to the dam, the rivers Temoaya and Tejalpa allow dilution of pollution. Section with the best water quality is the curtain of the dam, while the areas most affected are the entrance to the dam.
 (a)
(a)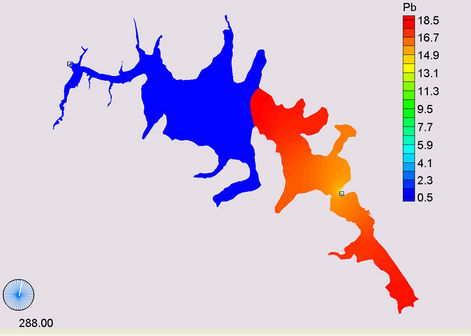 (b)
(b)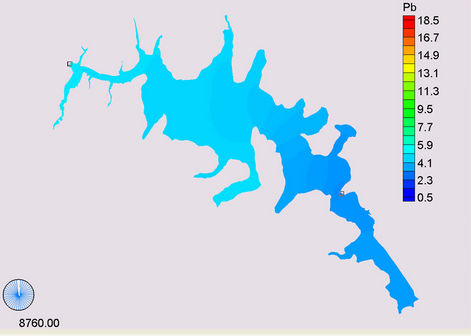 (c)
(c)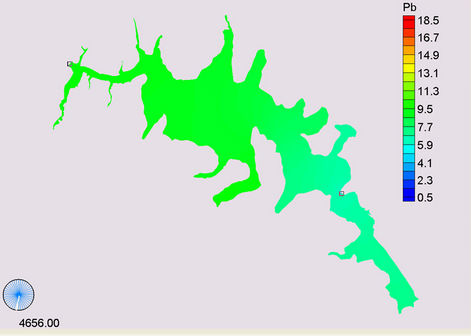 (d)
(d)
Figure 14. Simulation of Lead, (a) April; (b) May; (c) November; (d) March.
REFERENCES
- B. A. Albores Zárate, “Tules y Sirenas. El Impacto Ecológico y Cultural de la Industrialización en el Alto Lerma, México,” El Colegio Mexiquense, A.C. Gobierno del Estado de México, Secretaría de Ecología, México, 1995.
- Gustavo Garza Villarreal, “El Proceso de Industrialización en la Ciudad de México 1821-1970,” El Colegio de México, México, 1985, p. 446.
- Comisión Nacional del Agua, “Actualización de la Información de los Acuíferos del alto Lerma (valles de Toluca e Ixtlahuaca, Edo. de México), y la Adaptación de su Modelo DAS al Lenguaje Basic,” Documento de la DGCOH, México, 1993.
- W. Contreras, “Situación Actual y Perspectivas de los Recursos Forestales, suelo y agua de la Región valle de Toluca,” UAEM, 1989, p. 376.
- M. V. Peña, H. M. Orozco, M. C. Olivera, P. R. Franco, M. C. Castaños, S. J. Infante and C. J. Gutierrez, “Atlas Ecológico de la Cuenca Hidrográfica del río Lerma,” Comité Editorial del Estado de México, Tomo 5, 2000, pp. 13-14.
- Secretaria de Ecología del Estado de México, “Diagnóstico Preliminar Ambiental de la presa José Antonio Alzate,” Dirección General de Estudios y Proyectos Ecológicos, Gobierno del Estado de México, México, Informe Técnico, 1993.
- I. D. Barceló-Quintal, A. L. Bussy and H. E. Solís-Correa, “Applications of Analytical Chemistry in Environmental Research,” Manuel Palomar, Editorial Research Signpost, India, Chapter 10, 2005, pp. 161-188.
- I. D. Barceló-Quintal, “Estudio de la Movilidad de Ca, Cd, Cu, Fe, Mn, Pb y Zn en Sedimentos de la presa José Antonio Alzate en el Estado de México,” Ph.D. Dissertation, Facultad de Ingeniería, Universidad Autónoma del Estado de México, 2000.
- P. Avila-Pérez, G. Zarazúa, L. Carapia-Morales, S. Tejeda, C. Díaz-Delgado and I. D. Barcelo-Quintal, “Evaluation of Heavy Metal and Elemental Composition of Particles in Suspended Matter of Upper Course of the Lerma River,” Journal of Radioanalytical and Nuclear Chemistry, Vol. 273, No. 3, 2007, pp. 625-633. doi:10.1007/s10967-007-0922-6
- Consejo de Subcuenca del Río Lerma, “Minuta de la Cuarta Sesión Ordinaria,” Palacio Municipal, Xonacatlan, Estado de México, 26 de marzo de 2007.
- I. D. Barceló Quintal, E. López-Galván, S. Rosas de Alva, A. L. Bussy Beaurain and H. E. Solís Correa, “Ensayo Metodológico para la Obtención de Datos Cinéticos para el diseño de un Sistema de Tratamiento que pueda Mejorar la Calidad del agua del río Lerma Como Influente de la Presa José Antonio Alzate,” Memorias del Foro Metropolitano del Agua en el Valle de México, Tlalpan, D.F., 2007.
- P. Avila-Pérez, G. Zarazúa-Ortega, I. D. Barceló-Quintal, C. Díaz-Delgado and I. Rosas Pérez, “Afección a los Sistemas Acuáticos por Actividades Antrópicas,” In: C. Díaz Delgado, M.V. Esteller Alberich, F. López-Vera and Editorial RIPDA-CYTED, Eds., Cap. VIII-5 en Recursos hídricos—Conceptos Básicos y Estudios de caso en Iberoamerica, CIRA y Piriguazu, Uruguay, 2005, pp. VIII41-VIII108.
- Streeter and Phelps, “A Study of the Pollution and Natural Purification of the Ohio River,” US Public Health Service, 1925.
- L. Keith, “As Sampling and Analysis Methods,” Lewis Publishers, Inc., 1992.
- Standard Method, “Standard Methods for the Examination of Water and Waste Water,” 20th Edition, American Public Health Association, Washington DC, 1988.
- Instituto Nacional de Estadística, Geografía e Informática (INEGI), “Conjunto de Datos Vectoriales y Toponímicos Correspondientes a las Cartas Topográficas E14A37 y E14A38,” México, 1997.
- US Army Corps, “Users Guide to RMA2 WES Version 4.3,” Wextech Systems, 1997, p. 227.
- US Army, “Users Guide to RMA4 WES Version 4.5,” Wextech Systems, 2001, p. 171.
- Diario Oficial de la Federación, “Norma Oficial Mexicana NOM-001-ECOL-1996, que establece los Límites Máximos Permisibles de Contaminantes en las Descargas Residuales en Aguas y Bienes Nacionales,” 6 de enero de 1997.
- Diario Oficial de la Federación, “Criterios Ecológicos de la Calidad del Agua (CE-CCA-001-89),” 13 de Diciembre de 1989.
- I. D. Barceló-Quintal, H. E. Solís-Correa, A. L. Bussy and A. Allende, “Determination of Cd, Cu and Pb Contamination in Water and Sediment from a Mexican Reservoir Receiving Industrial and Domestic Wastewaters,” 5th IWA Chemical Industry Group Conference, Trends in Sustainable Production: From Wastewater Diagnosis to Toxicity Management and Ecological Protection, Nîmes, Francia, 2002.
- P. Avila-Pérez, M. Balcázar, G. Zarazúa-Ortega, I. D. Barceló-Quintal and C. Díaz-Delgado, “Heavy Metal Concentrations in Water and Bottom Sediments of a Mexican Reservoir,” The Science of the Total Environment, Vol. 234, No. 1-3, 1999, pp. 185-196.
- P. Avila-Pérez, “Dinámica de Metales Pesados no Esenciales en la Interacción Agua-Sedimento-Biota de la presa José Antonio Alzate,” Ph.D. Dissertation, Facultad de Ingeniería, Universidad Autónoma del Estado de México, 2001
- E. López-Galván, I. D. Barceló-Quintal, A. L. Bussy, H. E. Solís-Correa and P. Ávila-Pérez, “Coeficiente de Partición del Cadmio y Plomo en la presa José Antonio Alzate en el Estado de México, México,” Memorias del XXX Congreso de la Asociación Interamericana de Ingeniería Sanitaria y Ambiental (AIDIS), Punta del Este, Uruguay, 2006.
- E. López-Galván, I. D. Barceló-Quintal, A. L. Bussy, H. E. Solís-Correa and P. Ávila-Pérez, “Coeficiente de Partición del Hierro y cromo en la presa José Antonio Alzate en el Estado de México, México,” Memorias del XV Congreso Nacional de Ingeniería Sanitaria y Ambiental (FEMISCA), Guadalajara, Jalisco, 2006.
- E. López-Galván, “Determinación de la Movilidad Geohidrodinámica de Cd, Cu, Cr, Fe, Mn y Pb en la presa José Antonio Alzate en el Estado de México,” Ph.D. dissertation, Instituto Tecnológico de Toluca, Metepec, Estado de México, 2010.
- M. Márquez Vázquez, “Aplicación de un Modelo de Dispersión Superficial de Cu y Cd, en una Sección de la presa José Antonio Alzate,” M.Sc. Universidad Autó- noma Metropolitana, Unidad Azcapotzalco, 2007.
NOTES
*Corresponding author.