Atmospheric and Climate Sciences
Vol.3 No.2(2013), Article ID:30799,10 pages DOI:10.4236/acs.2013.32027
Characteristics of Central Southwest Asian Water Budgets and Their Impacts on Regional Climate
1National Agromet Center, Pakistan Meteorological Department, Islamabad, Pakistan
2York University, Toronto, Canada
3Climate Research Division, Environment Canada, Toronto, Canada
4National Drought Monitoring Center, Pakistan Meteorological Department, Islamabad, Pakistan
Email: *malikkm@hotmail.com
Copyright © 2013 Khalid M. Malik et al. This is an open access article distributed under the Creative Commons Attribution License, which permits unrestricted use, distribution, and reproduction in any medium, provided the original work is properly cited.
Received December 14, 2012; revised January 16, 2013; accepted January 25, 2013
Keywords: Water Budgets; Drought over Central Southwest Asia; Moisture Flux Convergence; Principle Component Analysis; Climate Change
ABSTRACT
Water budgets terms, evapotranspiration (E), precipitation (P), runoff (N), moisture convergence (MC) and both surface as well as atmospheric residual terms have been computed with National Centers for Environmental Prediction (NCEP) (1948-2007) and European Centre for Medium-Range Weather Forecasts (ECMWF) ERA-40 (1958-2001) reanalysis data sets for Central Southwest Asia (CSWA).The domain of the study is 45˚ - 75˚E & 25˚ - 40˚N. Only the land area has been used in these calculations. It is noted in the comparison of both reanalysis data sets with Global Precipitation Climatology Centre (GPCC) that all three data sets record different precipitation before 1970. The maximum is from NCEP and the minimum with ERA-40. However, after 1970 all the data sets record almost the same precipitation. ERA-40 computes two phases of MC. Before 1975, the domain acts as a moisture source, whereas after 1975 it behaves as a moisture sink. The region CSWA is divided into six sub areas with rotational principle factor analysis and we distinguish them by different approached weather systems acting on each area. Finally, NCEP yearly precipitation is further divided into seasons; winter (November to April) and summer (May to October) and two phases have been noted. The variation in winter precipitation is more than summer during last 60-year analysis.
1. Introduction
Central Southwest Asia, which mainly includes, Iran, Afghanistan, Pakistan, Tajikistan, Iraq and Saudi Arabia, is located between 45˚ - 75˚E and 25˚ - 40˚N, from mid-latitudes to the tropics, with the Arabian Sea to the south, Great Himalayas and Karakoram to the east, the Caspian Sea and Russian states in north and the Black Sea and Tigris river basin in west. Southwest Asia is a region of diverse climates and is generally divided into three main climate types. There are arid, semiarid, and temperate as per the Köppen-Geiger classification [1], which factors in seasonal distribution of precipitation and the degree of dryness/coldness of the season. Upland and mountain parts of Pakistan with adjacent areas of India have a dry continental and subtropical climate with a main feature being the southwest monsoon, which lasts for 4 months, from June to September. In this southwest monsoon period, the precipitation is one order of magnitude more than during the rest of the year. The region lies at the boundary of three climate regimes. These are: 1) the cold Siberian High in winter over Central Asia; 2) the monsoon Asian Low in summer over India; and 3) eastward propagating secondary low-pressure systems traveling through the Mediterranean and adjacent areas during non-summer seasons. They are called western disturbances WDs [2].
The region is badly affected during 1999-2001 drought, categorized as severe in the history of drought persisted over the globe in 20th century. To find out the causes of drought, it is vital to understand water budget terms of the region. In southwest Asia precipitation primarily falls from winter storms moving eastward from the Mediterranean, with the high mountains of the region intercepting most of the water. This wintertime precipitation generally occurs between the months of November and April, with the peak between January and March. Much of the precipitation falls as snow at higher elevations and the timing and amount of snowmelt is an important factor in the irrigated agriculture prevalent in the region. Very little precipitation falls in most of southwest Asia during the summer season. However, in eastern parts of Pakistan the primary precipitation season is summer. This is associated with the northernmost advance in the Asia monsoon, which results in a summertime maximum in precipitation in the northern mountain regions of Pakistan but generally suppresses precipitation over Iran and Afghanistan. Our study area is the central southwest Asia covers an area of approximately 4.67 × 10¹² m2, (Figure 1).
2. Water Budget Equation
Two dimensional (vertically integrated) horizontal variations of a key water process in the atmosphere-land surface system adopted by [3] are used in the study.
The atmospheric water equation can be written as
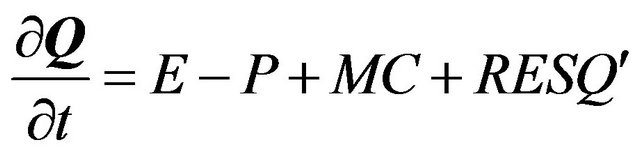 (1)
(1)
and the surface water equation is
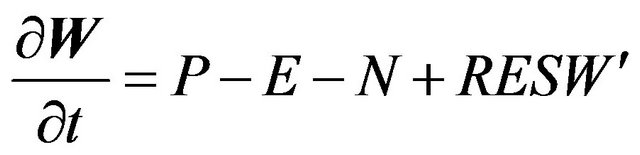 (2)
(2)
The temporal change in surface water W including soil moisture, snow and liquid water and in vertically integrated specific humidity or on atmospheric precipitable water Q, are represented by ∂W/∂t and ∂Q/∂t in above water conservation equations. Solid and liquid water evaporates (E) into the atmosphere from ocean and land surfaces which includes snow and vegetation. Water vapor is transported into the region from the surroundings by atmospheric winds and its convergence flux (MC), will increase atmospheric water vapor over the region while decreasing water vapor over the surroundings. Clouds formed through nucleation, grow by condensation (or diffusion if solid) and convert into large liquid and solid drops by accumulation, which fall as precipitation to the surface, P. Eventually, surface water is increased by precipitation and decreased by evapotranspiration. Rivers and canals transport surface fresh water to other locations and the net divergence of this transport, N (runoff), will increase surface water in low lying regions before discharging it into the oceans. RESQ' and RESW' are the residuals or errors in the budgets. They are implicitly included to force the analyses state variables close to observations. After Roads et al. [3], all vertically integrated reanalysis water budget terms (kg/m2s) are multiplied by 8.64 × 10⁴ s/day to provide individual values in kg/m–2 day or mm/day after dividing by the density of water (1000 kg/m3).
3. Datasets and Methodology
The Global Precipitation Climatological Centre (GPCC) has provided gauge-gridded precipitation data for the whole globe with resolutions of 0.5˚, 1.0˚, and 2.5˚ from 1900 to the present. In this study, we used GPCC-version 4 precipitation data with a resolution of 1˚ × 1˚ for the period 1950-2007 [4]. This data set was formed by gridding monthly precipitation anomalies using the complete set of gauge measurements held at the time in the GPCC station database. The global reanalysis data sets used in this study include the European Center for MediumRange Weather Forecasts [5], 40-years reanalysis (ERA- 40) [6], and the National Centers for Environmental Prediction-National Centre for Atmospheric Research (NCEP-
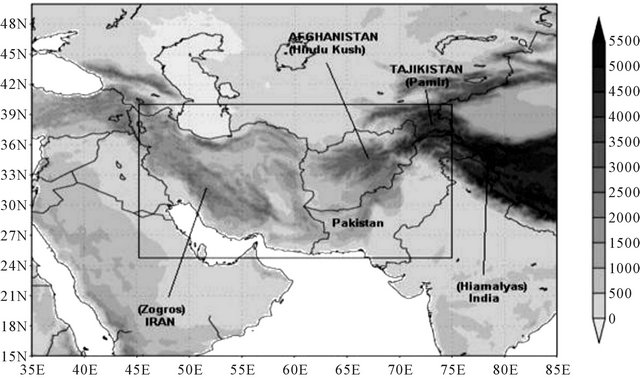
Figure 1. Model domain and topography (m) with a marked boundary with black line used in the study.
NCAR) reanalysis [7]. Data taken from each of these reanalysis data set NCEP for the period (1948-2007) and ERA-40 for (1958-2001) have been used to evaluate the individual terms in both surface and atmospheric water budget equations over a wide range of spatio-temporal scales. To compute the MFC, meridonal wind (u), zonalwind (v) and specific humidity (q) at 2.5˚ resolution with six hourly data from surface to 200 hPa level were used. Evapotranspiration in the NCEP dataset are computed from surface latent heat flux (4x/day) by using, E = L/lrm, where L is the latent heat flux at the surface in W·m–2, l is latent heat of evaporation (2270 kJ·kg–1) and rm is density of water (1000 kg·m–3). Then evapotranspiration was multiplied by 8.64 × 10⁴ s·day–1 to convert into mm day–1. Other surface variables such as runoff, precipitation and surface pressure (six hourly, 2.5˚ resolution in ERA-40 and 1.875˚ resolution in NCEP) were used for the study. Areal average budgets were computed from land areas only.
Principal Component analysis is used for data reduction and can identify different groups with similar characteristics via variance correlation. There are two main techniques used in applications of factor analysis, 1) to reduce the number of variables; and 2) to detect structure in the relationships between variables. The factor analysis is applied as a data reduction or structure detection method (the term factor analysis was first introduced by [8]. The same technique is used on time series of precipitation data of each grid point and forms the different groups of the region. Each group has same characteristics of precipitation data.
4. Analysis, Comparison and Discussion
4.1. Water Budget Comparison-Yearly
Figure 2 illustrates a comparison of the annual averages of water budget terms, Evapotranspiration (E), Runoff (R), Precipitation (P) and Moisture convergence (MC). Inter-comparison of water budget terms in the ERA-40 reanalysis suggests that the region is behaving as a source of moisture during 1958-2001 because no moisture is transported in (MC < 0) and precipitation occurs due to local recycling (Figure 2).
Generally on land it could happen if most of the area in the region is covered with a water surface that causes more evaporation but in this study only land areas have been used. In case of NCEP, MC > 0, implies that moisture is transported into the region because of precipitation. Higher average values of MC indicate that regional precipitation is dependent on moisture advection into the region. The NCEP analysis shows that water is transported in (MC > 0) whereas ERA-40 shows water is transported out from the region. Comparisons of water budget terms of NCEP, ERA-40 and GPCC version 4 (for
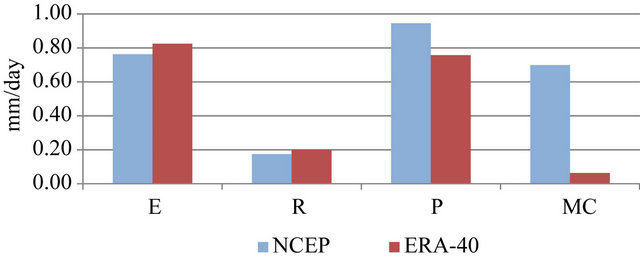
Figure 2. Comparison of annual averages (1948-2007 for NCEP and 1958-2001 for ERA-40) of Evapotranspiration (E), runoff (R), precipitation (P) and Moisture flux convergence (MC) of ERA-40 (dark red) and NCEP (light blue).
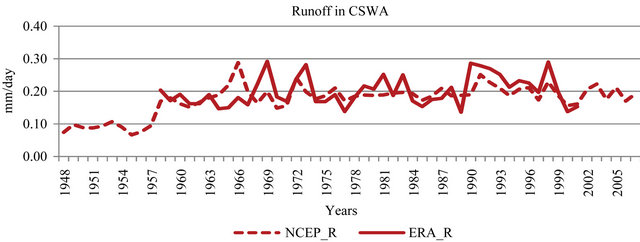
precipitation) are given in Figures 3(a)-(d).
The patterns of runoff in both reanalysis datasets are almost the same except during the period of 1965-1969. Despite the use of sophisticated surface modules in NCEP and ERA-40 models, runoff processes are crudely represented [9]. ERA-40 records maximum peak in 1969 whereas the NCEP maximum is in 1966.The former may be associated with continuous persistence of the same amount of precipitation for the previous three consecutive years and the latter was extremely wet year throughout the study period.
ERA-40 showed two phases of moisture flux, divergence during (1958-1976) and convergence during (1977- 2001). This can be confirmed with the CSWA precipitation during their respective phases; moisture converges with less precipitation and diverges with more precipitation. Moisture flux convergence drops after 1998 with a start to the drought period in the region (1998-2001). In the NCEP analysis [10], two different averages of moisture flux convergence can be observed, one from 1948- 1966 with a higher value and other during 1967-2006 with a lower value.
All the time ERA-40 computes more evaporation than NCEP reanalysis except during 1963-1967. During this period, more moisture had advected in whereas less moisture is lost though runoff from the region. Two peaks are found during 1972 and 1976 with high moisture convergence and runoff from previous years. It implies that a rise in temperature increases the water in rivers because of more water melted from snow.
In panel (d) of Figure 3, a comparison of precipitation of ERA-40, NCEP and GPCC (v4) has been given. All data sets show similar values from 1978 onwards but significant differences before 1968. During 1963-1967, precipitation predicted by NCEP is higher than other two data sets. Higher precipitation relates to higher moisture flux convergence and lower evaporation.
4.2. Water Budget Comparison-Monthly
Comparison of monthly averages over 60 years for NCEP and 44 years for ERA-40 of runoff, MC and
 (a)
(a)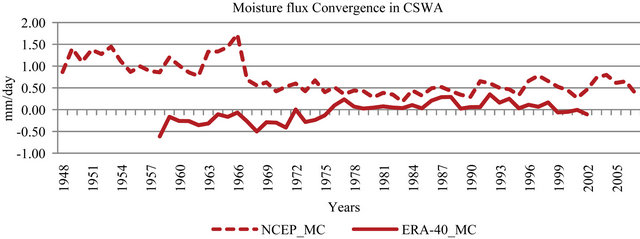 (b)
(b)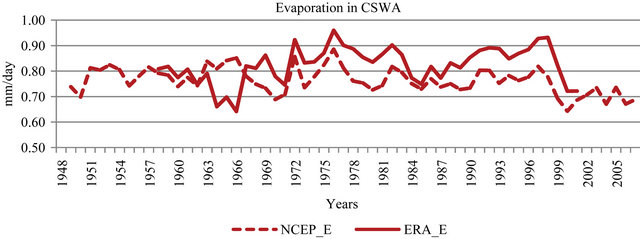 (c)
(c)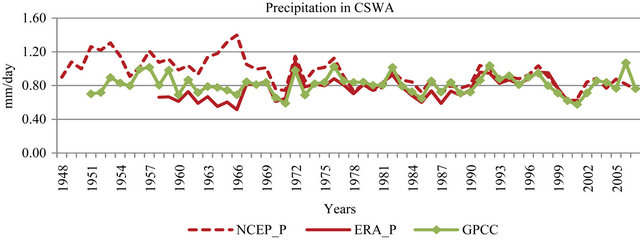 (d)
(d)
Figure 3. Comparison of annual runoff, evaporation, moisture flux convergence and precipitation from CSWA of NCEP (dotted) ERA-40 (solid) and GPCC (solid with cross rectangle mark).
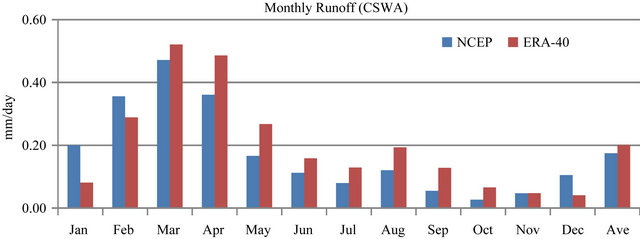
evaporation in CSWA are shown in Figures 4 (a)-(c) and in Figure 4(d) with GPCC of precipitation in addition. The computational details of moisture flux convergence are not mentioned here and can be found in Liu et al. [11]. Both data sets shows maximum values of runoff in March and minimum in October related with the amount of precipitation in the respective months in the region. In August runoff increase from previous months because of two factors, one is due to precipitation in the eastern portion of the region and the second is due to the melting of snow from glaciers which increases inflow in the rivers of the eastern side of the domain.
The moisture convergence occurs from November to April with a maximum in February. Divergence is from May to October with a maximum in June from the ERA-40 analysis. The convergence is related with weather systems approaching from the west in winter and divergence is related to continuous heating and less precipitation in the region. In February, more water is transported into the region from the west and in June, net water transport in to the region is negative due to heating. In July, moisture enters from southeast in the form of monsoon currents causes decreases in moisture flux divergence in the region. In August and September, with the offset of monsoon currents causes increases the divergence again in the region and persists until the onset of winter weather systems.
Figure 4(c) represents the comparison of average monthly evaporation of both data sets. In winter, the region is under the influence of humid air and lower surface temperatures causes less evaporation. In summer dry air and high surface temperatures in the region causes high evaporation. Two peaks of high evaporation can be seen in April and June. The former is due to discontinuous western disturbances caused convert moist air into dry and the latter is due to high heating of the region. In July moist air returns because of the eastern monsoon system and causes a decrease in evaporation. It is observed that in winter NCEP records higher values of runoff, MC and evaporation than ERA-40 whereas in summer ERA-40 computes higher values than NCEP (Figures 4(a)-(c)). These variations are related to the variations of Sea Level Pressure (SLP) in both data sets. It is noted that NCEP predict higher SLP during summer and lower during winter than ERA-40.
Comparison of the average monthly precipitation of CSWA is shown in Figure 4(d). All the data sets have recorded more than 1 mm/day precipitation in January to April and December. In July and August, precipitation increases because the eastern monsoon enters the region from the southeast to cover a portion of the region. The graph shows that winter behaves as a wet period and summer as a dry. The region receives maximum precipitation in March and minimum in October with an average of 0.8 mm·day–1. NCEP computes more precipitation than ERA-40 almost throughout the year and the difference of computed precipitation between both data sets increases in winter and decreases in summer suggesting that temperature plays an important role in the computation of all the water budget terms in both data sets.
4.3. Sub Division of CSWA
Principal component analysis technique is applied on time series of all grid points (variables) (8 × 17) of precipitation of CSWA and formed six factors (region).
Each group has similar precipitation characteristics based on NCEP reanalysis data sets from 1948-2007. In Figure 5, the precipitation at each grid point is divided into six factors and apparently, the first factor (A-1) is generally more highly correlated with the grid point's precipitation than the second factor (A-2) and so on. This is to be expected because, these factors are extracted successively and will account for less and less variance overall.
A-1 covers most of the western portion of the domain and some hilly portion of Pakistan. A-2 includes most of the central parts of the domain which is covered with rocks and uneven surfaces. A-3 includes the northeast portion with high mountain ranges and glaciers. A-4 includes south eastern portion over Pakistan with plains and forests. A-5 includes the central northern portion with a lower altitude rocky surface. A-6 splits into two portions one is the along extreme North West and second coves some of the boundary area of Pakistan and Afghanistan.
Monthly and yearly average precipitation values of each area [12] and the whole domain are given in Figures 6 and 7. Winter precipitation of all sub areas except A-4 is higher than summer, with maxima in March, because of strong western disturbance (WDs) inputs. Precipitation in A-4 is higher in summer (July to September) due to the strong Southeast monsoon. In winter, strong WDs enter from west and give maximum precipitation in the northern half of the domain which includes A-6, A-5 & A-3. The intensity of precipitation reduces as WDs move to the southeast. As a result, WDs enter in A-4 with weak intensity causing less precipitation in winter as compared to the other areas. Shifting of the Inter Tropical Convergence Zone (ITCZ) plays an important role in the prediction of the maximum precipitation month in the winter of each area. Maximum precipitation belts start from north of the Zagros Mountains in the west and turn towards the northeast after crossing the Hindu Kush in Afghanistan. This implies that maximum precipitation would occur in A-1 and A-3 when the ITCZ is in the extreme southern location as in March. As it starts shifting towards the north in April, the maximum
 (a)
(a)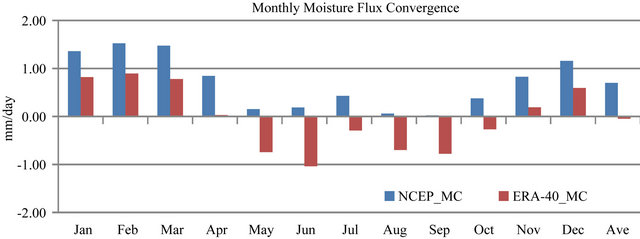 (b)
(b)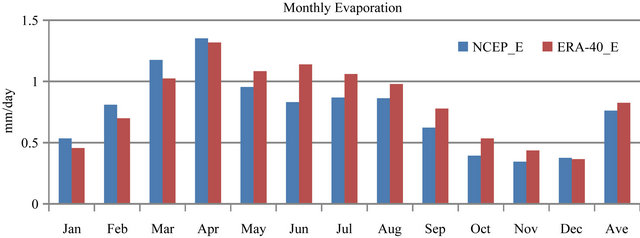 (c)
(c)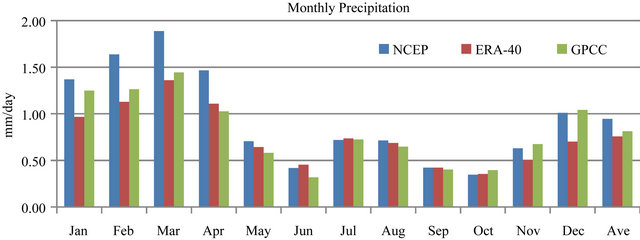 (d)
(d)
Figure 4. Comparison of monthly moisture budget terms in CSWA (a) Runoff; (b) Evaporation; (c) Moisture flux convergence with both reanalysis and (d) Precipitation of NCEP (blue), ERA-40 (red) and GPCC (green).
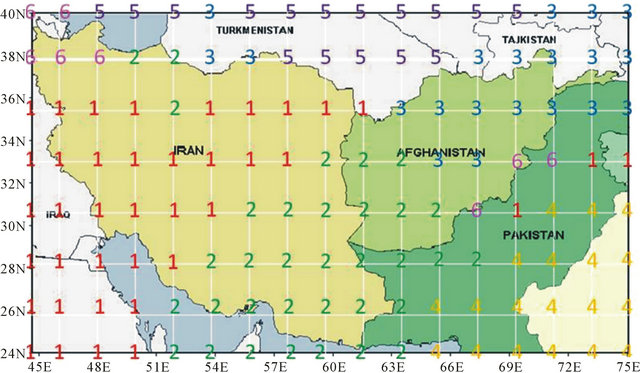
Figure 5. Sub division of CSWA, (A-1 to A-6) with different color & numbers from 1 to 6. The position of each number represents the grid points (1.875˚ × 1.875˚) by longitude and latitude of the NCEP reanalysis-1 data sets [10]. Number 1 (red) shows sub region A-1, 2 (green) is A-2, 3 (blue) is A-3, 4 (yellow) is A-4, 5 (Dark purple) is A-5 and 6 (light purple) is A-6.
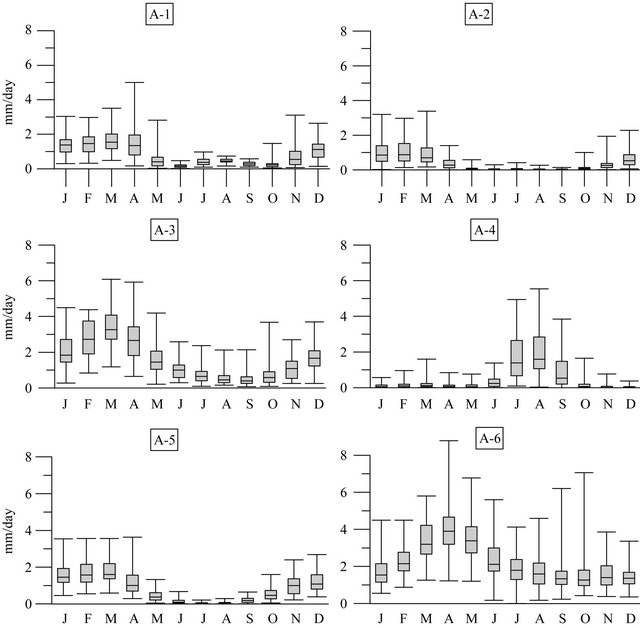
Figure 6. Monthly average precipitation with variance, in mm/day, of each (A-1 to A-6) sub region of CSWA. Box represents the range of the data, 25% as bottom, 75% as top and 50% with centre line.
precipitation area will also shift northwards towards A-6 and A-5.
A-1 shows slightly higher precipitation in July and August during summer, which is not due to monsoon current in the region. This relates to adjacent areas of extreme northwest of the domain. Precipitation is higher on higher latitudes and decreases on lower latitudes during summer. As the area is close to A-6 in the Northwest, we expect more precipitation and as the area goes towards south, it records less in summer (June to August).
In Figure 7, yearly average precipitation of each area is given. A-6 and A-3 cover the northwest and northeast portions of the domain and show higher yearly average precipitation than CSWA with maximum more than 2 mm/day in A-6. A-6 records higher precipitation because of intense WD and continuous increasing moisture from Caspian Sea. Higher precipitation in A-3 is the result of its topography. High mountains ranges and glaciers in A-3 produce anticylonic circulation which captures more moisture from water surfaces in the area and causes increased precipitation. Weather systems enter in to the region from west, give more variance in A-1 and from east, give more variance in A-4. The central portion of the domain A-2, compressed in between WDs and southeast monsoon weather systems has less average precipitation with less variance as in A-5. A-1 and A-5 show the same yearly average precipitation as CSWA in the range of 0.75 - 0.85 mm·day–1. A-2 and A-4 show less precipitation in the region with a minimum of 0.39 mm·day–1 in A-2.
Figure 8, shows how the decadal precipitation has decreased in CSWA and its sub areas. All the areas except A-4 and A-5 show a decreasing trend whereas A-4 shows increasing and A-5 is steady. Precipitation increasing in A-4 means that monsoon precipitation increases in the region. In the last two decades, precipitation in A-5 also increases suggesting a higher intensity of WDs in the extreme north of the region. Between 1989-1998 and 1999-2007, all the areas except A-6 showed an increasing trend and over all precipitation increases in the region. During 1999-2007, precipitation in the entire region except A-5 decreases due to drought (1999-2001).
4.4. Drought in CSWA
Figure 9 shows annual precipitation anomalies during (1997-2002) based on NCEP reanalysis (1948-2007). CSWA received less precipitation then normal and this pushed the area into severe drought. Drought starts in the region from 1999 and persisted for three years. During 1999, it started from west in A-1 & A-6 and moved towards the southeast. The region got severe drought during 2000 which affected the whole domain except for A-5 & A-6 (extreme north portion of the region) with maximum impart in A-4. During 2001, severity of drought has been decreased in A-4 because of more than average monsoon precipitation. The most affected areas were A-4 and A-2 during 2000 and 2001 respectively. Drought in the CSWA occurred as a result of weak WDs during this period. This implies that recent drought in
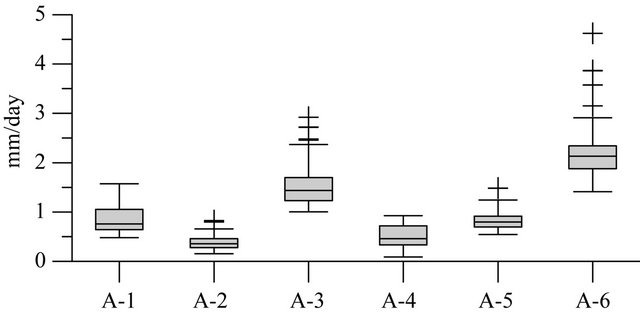
Figure 7. It represents yearly average precipitation of each area (A-1 to A-6) and + sign indicates outliers. Box represents the range of the data, 25% as bottom, 75% as top and 50% with centre line.
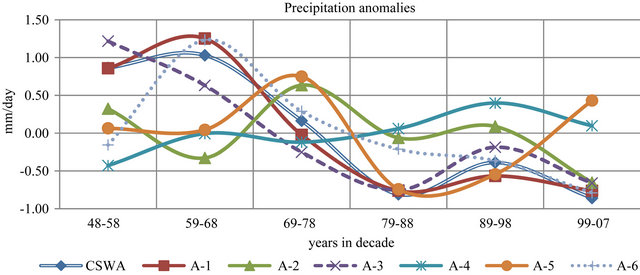
Figure 8. Decadal variation of precipitation anomalies of CSWA (line with square mark), A-1 (double solid line with rectangle mark), A-2 (line with triangle), A-3 (dashed line with cross), A-4 (line with star), A-5 (line with solid circle) and A-6 (dotted line with cut vertically) is given. The grid point on x axis represents one decade.
CSWA was a global phenomenon and occurred with a variation of the weather systems that approached the region.
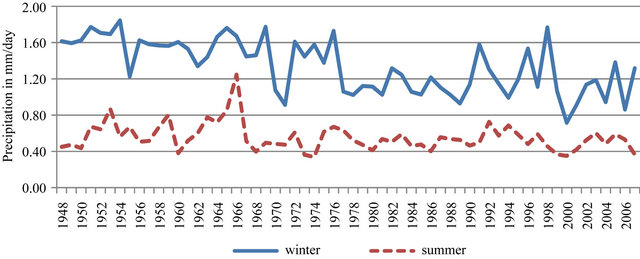
4.5. Variation of Seasonal Precipitation
Seasonal precipitation: 1) winter from November to April and 2) summer from May to October, is illustrated in Figure 10(a). Average seasonal precipitation of CSWA in summer is 0.55 mm/day which is 30% of total yearly precipitation and the remaining 70% falls in winter.
Two peaks can be seen in two phases, in late sixties (phase I) and late nineties (phase II). In phase-I, precipitation increases from 1966 up till 1969 and then start decrease up till mid eighties (Figure 10(b)). In next 6 - 7 years it persists at the same average and then in phase-II, it increases from the early nineties up till late nineties
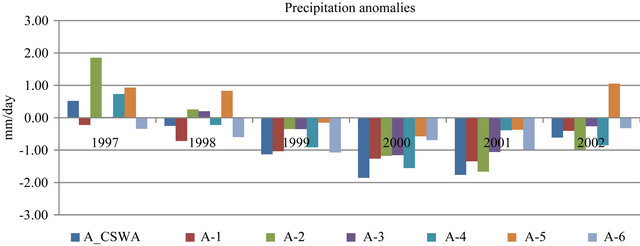
Figure 9. Anomalies of CSWA and its sub areas precipitation during drought period (1997-2002) A_CSWA stands anomalies of CSWA and A_GP1 to A_GP6 is anomalies for each area from A-1 to A-6.
 (a)
(a)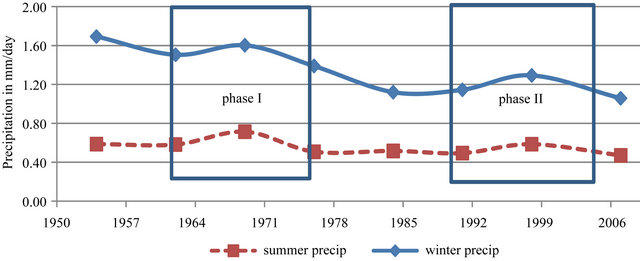 (b)
(b)
Figure 10. (a), (b) show yearly seasonal and 6 - 7 years average precipitation respectively. Summer includes May to Oct with dotted line and winter is from Nov to Apr with solid line.
and start decreases from 1998 up till 2007. It suggests that a decreasing trend in precipitation may be continued in future if it follows the same pattern. The larger decrease in average winter season precipitation than summer season indicates that precipitation changes in the region through western disturbance has more influence than monsoon effects.
5. Summary and Conclusions
The study has been conducted to compute the water budgets in Central Southwest Asia region and will be used to identify the drought areas. Water budget terms including evapotranspiration, runoff, moisture convergence and precipitation over CSWA have been summarized and examined in a comprehensive manner.
Precipitation data over CSWA of all three data sets (NCEP, ERA-40 and GPCC) gave similar results after 1978 whereas from 1948 to 1977, NCEP computes more precipitation than other data sets. During this period (1958-2001) ERA-40 computes more evaporation than precipitation in the area which in general is not realistic. The NCEP data set computes more precipitation than evaporation and gave confidence that it would be a better option to compute water budget terms from NCEP, especially for CSWA area. Two weather systems frequently approach the region, one from the west in winter and other is from the east in form of southeast monsoon in summer.
Maximum runoff occurs in April because of winter precipitation and one peak is observed in August because of snow melting in the Northern areas of the region. In winter, moisture converges with maximum magnitude in February and in summer moisture diverges in the region with a maximum in June because of high temperatures. Evaporation has a maximum in April due to winter precipitation and in June it increases again from May because of the rise in temperature. All the data sets record maximum precipitation in March during winter and in July during summer. It is noted that meteorological drought occurred in the areas of CSWA which are under the influence of WDs as well as the southwest monsoon and implies that it is a global phenomenon and not a local one. Weak approaching weather system decreased precipitation in the region.
Precipitation occurs more during winter on the western side and more during summer on the southeastern side of the region. The areas towards the extreme northwest had maximum precipitation throughout the year. Precipitation showed a decreasing trend in decadal anomalies in all areas except A-4. The increasing precipitation trend in A-4 indicates that monsoon precipitation in the region is increasing with time. Furthermore, It is concluded that winter precipitation is decreasing continuously whereas summer is receiving essentially same for the whole study period.
REFERENCES
- Köppen-Geiger, “Climate zones,” Centre for International Development at Hervard University, 1999.
- D. Martyn, “Climates of the World,” Elsevier, Amsterdam, 1992, 436 p.
- J. Roads, et al., “CSE Water and Energy Budgets in the NCEP-DOE Reanalysis II,” Journal of Hydrometeorology, Vol. 3, No. 3, 2002, pp. 227-248. doi:10.1175/1525-7541(2002)003<0227:CWAEBI>2.0.CO;2
- T. Dinku, et al., “Comparison of Global Gridded Precipitation Products over a Mountainous Region of Africa,” International Journal of Climatology, Vol. 28, No. 12, 2008, pp. 1627-1638. doi:10.1002/joc.1669
- ECMWF, ECMWF Reanalysis Data. http://data-portal.ecmwf.int/data/d/era40_daily/
- S. M. Uppala, et al., “The ERA-40 Re-Analysis,” Quarterly Journal of the Royal Meteorological Society, Vol. 131, No. 612, 2005, pp. 2961-3012. doi:10.1256/qj.04.176
- R. Kistler, et al., “The NCEP-NCAR 50-Year Reanalysis: Monthly Means CD-ROM and Documentation,” Bulletin of the American Meteorological Society, Vol. 82, No. 2, 2001, pp. 247-267. doi:10.1175/1520-0477(2001)082<0247:TNNYRM>2.3.CO;2
- L. L. Thurstone, “Multiple Factor Analysis,” Psychological Review, Vol. 38, No. 5, 1931, pp. 406-427. doi:10.1037/h0069792
- K. K. Szeto, et al., “The MAGS Water and Energy Budget Study,” Journal of Hydrometeorology, Vol. 9, No. 1, 2008, pp. 96-115. doi:10.1175/2007JHM810.1
- NCEP, NECP Reanalysis Data. http://www.cdc.noaa.gov/cdc/reanalysis/reanalysis.shtml
- J. L. Liu, et al., “Characteristics of the Water Vapour Transport over the Mackenzie River Basin during the 1994/95 Water Year,” Atmosphere-Ocean, Vol. 40, No. 2, 2002, pp. 101-111. doi:10.3137/ao.400202
- N. Panigrahy, et al., “Algorithms for Computerized Estimation of Thiessen Weights,” Journal of Computing in Civil Engineering, Vol. 23, No. 4, 2009, pp. 239-247. doi:10.1061/(ASCE)0887-3801(2009)23:4(239)
NOTES
*Corresponding author.