Atmospheric and Climate Sciences
Vol.2 No.2(2012), Article ID:18834,8 pages DOI:10.4236/acs.2012.22023
Application of Merged Precipitation Estimation Technique to Study Intense Rainfall Events over India and Associated Oceanic Region
Divecha Centre for Climate Change/Centre for Atmospheric and Oceanic Sciences, Indian Institute of Science, Bangalore, India
Email: anoopmishra_1@yahoo.co.in
Received December 29, 2011; revised February 8, 2012; accepted February 23, 2012
Keywords: Precipitation; Remote Sensing; Radar
ABSTRACT
In this paper, an effort has been made to study heavy rainfall events during cyclonic storms and active monsoon cycle over Indian land and associated oceanic regions from recently developed merged rainfall technique using rain gauge and multi-satellite observations from Precipitation Radar (PR) onboard Tropical Rainfall Measuring Mission (TRMM), Special Sensor Microwave Imager (SSMI) onboard Defense Meteorological Satellite Program (DMSP) and Meteosat of Eumetsat. Four recent cyclonic events namely Gonu, Bijli, Aila and Laila were qualitatively analyzed using rainfall from this technique. This technique is validated against another merged rainfall product TRMM-3B42V6 and rain gauge observations during heavy rainfall events of the years 2007, 2008, 2009, 2010. Results presented in this study show that the heavy rainfall events are efficiently monitored by this technique.
1. Introduction
Floods are the most destructive natural disaster in India, claiming more lives and causing more property damage than any other natural hazards. Almost all of India is flood-prone, and extreme precipitation events have become increasingly common in India (specially over central India) over the past few decades [1]. Heavy rainfall events are generally associated with cyclonic disturbances such as depressions or cyclonic storms moving and active monsoon cycle across the country. These disturbances form over warm waters surrounded by the country and usually have a lifetime of about 3 - 4 days. An accurate prediction of high rainfall events is essential for prevention and management of disasters. In India, there is a low spatial density of automatic rain gauges and Doppler Weather Radars (DWR) [2]. Satellite observations can provide rainfall estimates more frequently and over a larger area than conventional rain gauge measurements; they thus can be useful in detecting heavy rain events. Near real time rainfall estimation using geosynchronous satellite data from Infra-Red (IR) observation is very essential for such studies. Arkin and Meisner [3] developed most common GOES Precipitation Index (GPI) technique, based on a simple infrared-brightness temperature (IR-TB) threshold algorithm. However, rainfall estimations based on IR measurements from satellite have large errors because IR radiances from cloud tops have only indirect and weak relationship with surface rainfall [4-7]. Satellite microwave (MW) measurements, on the other hand, though have a very good physical connection with the rain and hydrometeors but are at a disadvantage on temporal and spatial scale because of coarser spatial resolution, and lower orbiting satellites provide less coverage [8]. The development of hybrid techniques using the strengths of both MW and IR, based on proper inter-calibration over the common areas of overlap is, therefore, highly desirable. Adler et al. [9] improved precipitation estimates by combining both IR and MW observations so that the strengths of each individual technique are maintained and their weaknesses are compensated for. Over the last few years, a number of groups have embarked on development of so-called hybrid techniques by synergistic use of multi-satellite sensor observations [10]. Use of neural networks to combine both IR and MW observations was explored by Sorooshian et al. [11]. These merged rainfall estimates were utilized to study rainfall events over Indian region. Pinori et al. [12] used IR and MW observations to study heavy rain producing storms over Mediterranean area. Jiang et al. [13] used merged observations from IR and MW to study heavy rainfall events during tropical cyclones that made landfall over United States during 1998-2004. Krishna and Rao [14] studied the intensity of super cyclone Gonu using satellite observations. Mugnai et al [15] retrieved heavy precipitation from combined satellite and ground based lightning measurements. Preethi et al. [16] utilised Climate Prediction Center (CPC) merged rainfall product to study extremes in summer monsoon precipitation over India. Prakash et al. [17] studied heavy rainfall events during tropical cyclones over the North Indian Ocean using TRMM-based precipitation products. Laviola et al. [18] used both satellite and model observations to investigate heavy rain events over the Central Mediterranean. In this study, an effort has been made to study heavy rainfall events from merged rainfall product, recently developed by Mishra et al. [7] using rain gauge and multi-satellite measurements over Indian land and associated oceanic regions. This technique estimates (daily accumulated) rainfall from gauge and satellite observations over Indian land and associated oceanic region (30˚S - 50˚N, 40˚E - 120˚E) at 0.25˚ × 0.25˚ spatial resolution. It is based on observations of rain gauges, SSM/I PR onboard TRMM and geostationary satellite Meteosat of Eumetsat. It utilizes available rain gauge observations (specially over southern part of Indian region), microwave observations using regional scattering indices generated by Mishra et al. [8] and microwave calibrated infrared observations [4,5]. Pixels over land portion of study area are filled with available rain gauge observations. Pixels over the remaining study area are filled with available microwave observations. If microwave observations are unavailable, then the pixels are filled with microwave-calibrated infrared observations. Several cyclonic events were analyzed using rainfall from above technique. This technique is validated against TRMM- 3B42 and rain gauge observations.
2. Data Used
The primary data used in this study are IR and water vapor (WV) observations from geostationary satellites and MW observations from Tropical Rainfall Measuring Mission (TRMM) and Defence Meteorological Satellite Program (DMSP) satellites, which are in low Earth orbits. Conventional data were obtained from the AWS network for validation. Rainfall obtained from present technique was intercompared using standard product TRMM- 3B42V6.
2.1. Meteosat and TRMM Satellite Data
Meteosat is a geostationary Earth-observation satellite launched by the European Space Agency and now operated by the European Organization for the exploitation of Meteorological Satellites. It provides thermal infrared (TIR) and WV images at half-hourly intervals with spatial resolution of 4 km. In the present study, we use TIR and WV data from Meteosat-7. The TRMM, launched in late November 1997 into a near-circular orbit with 35˚ inclination from the equatorial plane, provides data recorded by passive instruments in the optical and MW regions. It also carries a Precipitation Radar (PR). We use the surface rainfall data of Precipitation Radar Version 6 (2A25) [19] and Meteosat IR and WV data for development of the algorithm, and a standard merged IR and MW data product called 3B42 [20] for the intercomparison.
2.2. AWS Rain Gauge Data
The AWS designed by the Indian Space Research Organization (ISRO) is a compact, modular, rugged, powerful and low-cost system housed in a portable, selfcontained package. In contrast to many other sensors, it has a tipping bucket rain gauge with unlimited rain measuring capacity and accuracy better than 1 mm. The data are relayed through a satellite and made available on the website www.mosdac.gov.in. For development and validation of the present algorithm, AWS rain gauge data for 2007, 2008, 2009 and 2010 are used. The AWS distribution over India is shown in Figure 1.
2.3. SSM/I Data
The SSM/I instrument was developed as part of the DMSP and was flown aboard the Air Force Block 5D polar-orbiting satellite on June 19, 1987. The sensor built by Hughes Aircraft Company operates at four frequencies of 19.35, 22.235, 37.0 and 85.5 GHz. All frequencies except the WV absorption channel at 22.235 GHz are dual polarized. The resolution depends on the frequency and ranges from approximately 50 km at 19 GHz to 15 km at 85.5 GHz. The present study takes SSM/I (F13) data for the years 2007, 2008, 2009 and 2010.
3. Results and Discussions
The present technique has been developed based on rain gauge, MW and MW-calibrated IR observations. Usefulness of this technique in heavy rainfall study was examined by applying it to numerous contrasting heavy rain events associated with cyclones and southwest and northeast monsoon seasons. A few case studies are presented below for brevity.
3.1. Case Study 1
For this case study, we identified a Tropical Super Cyclonic storm Gonu, developed over eastern Arabian Sea during 1 June 2007 at 15.00˚N/68.50˚E, bringing out maximum daily accumulated rainfall as 275mm (Figure 2(a)). It developed from a persistent area of deep convection [21]. Super cyclones like Gonu are extremely rare over Arabian Sea, since most storms over this region

Figure 1. Density of ISRO AWS rain gauges. Dots represent AWS stations.
tend to be small and dissipate quickly. Initially, the system moved towards west direction and concentrated into a deep depression on 2 June 2007 centered near 15.00˚N/ 67.00˚E (Figure 2(b)).
Maximum accumulated rainfall on 4 June 2007 was in range of 200 - 275 mm (Figure 2(d)). Moving in a westnorthwesterly direction, it crossed Oman coast during 6 June 2007. The system emerged into the Gulf of Oman and finally moved towards north-westerly direction and made landfall over coast of Iran near 58.50 E on 7 June 2007 (Figures 2(f) and (g)).
3.2. Case Study 2
A low pressure area developed over the southeast Bay of Bengal on 14 April 2009 (Figure 3(a)). It is observed from Figure 3(a) that maximum accumulated rainfall associated with this system was in range of 275 - 300 mm on 14 April 2009.
It concentrated into a depression later in the day on 14 April over the southeast and adjoining east central Bay of Bengal. It moved in a north-northeasterly direction towards coast and intensified into a cyclonic storm Bijly from an area of low pressure on 15 April 2009 over the east-central Bay of Bengal (Figure 3(b)). On April 16 2009, the storm turned towards the northeast, paralleling the eastern coast of India (Figure 3(c)), bringing out maximum rainfall in range of 200 - 250 mm. It thereafter moved in a north direction and finally dissipated during 17 - 18 April 2009 (Figures 3(d), (e)). It caused moderate damage in Bangladesh.
3.3. Case Study 3
A low pressure system Aila developed and concentrated into a depression on 23 May 2009 over Bay of Bengal near 16.5˚N/88.0˚E (Figure 4(a)). It intensified further with its centre at 15.00 N/85.50 E and produced maximum accumulated rainfall as 300 mm of the same day (Figure 4(a)). It moved towards north direction and intensified into a deep depression and lay centred at 18.0˚N/ 88.5˚E on 24 May 2009, bringing out maximum rainfall as 350 - 400 mm (Figure 4(b)). It further intensified into a cyclonic storm, and lay centered near 18.5˚N/88.5˚E.
After the landfall, the system continued to move in a northerly direction, gradually weakened on 25 May 2009 over Gangetic West Bengal (Figure 4(c)). While it continued its movement towards north, it finally dissipated on 26 May over Sub-Himalayan west Bengal & Sikkim (Figure 4(d)).
3.4. Case Study 4
A low pressure system developed over Bay of Bengal at 10.5˚N/88.5˚E on 17 May 2010, producing maximum rainfall amount 300 - 350 mm (Figure 5(a)).
It was the worst storm to hit Andhra Pradesh over the last decade. It moved towards west-northwest and intensified into a cyclonic storm, Laila on 18 May 2010 over Bay of Bengal and produced maximum accumulated
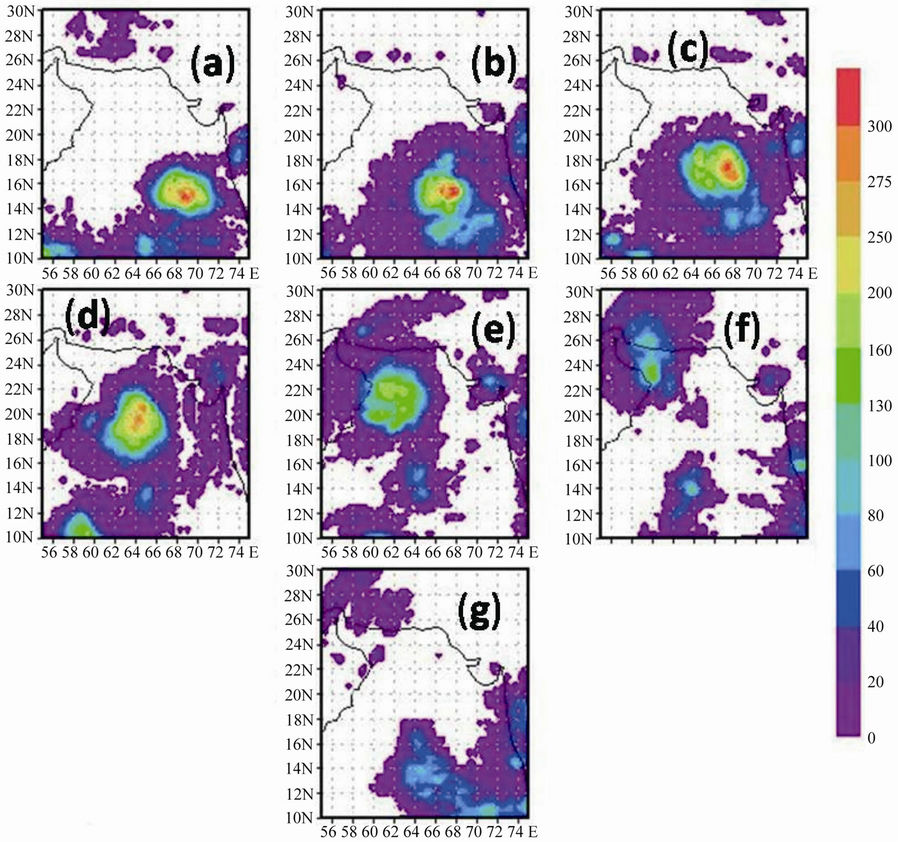
Figure 2. Daily accumulated rainfall during Gonu Cyclone on June (a) 1; (b) 2; (c) 3; (d) 4; (e) 5; (f) 6; (g) 7, 2007. Rainfall is in mm.
rainfall in range of 350 - 375 mm (Figure 5(b)). It continued moving towards southwest and southeast Bay of Bengal during 19 May 2010. Maximum rainfall during 19 May 2010 was in the range of 300 - 400 mm (Figure 5(c)). It moved towards north very slowly and crossed coastal Bapatla (15.8˚N/81˚E) on 20 May 2010 bringing out maximum rainfall as 350 mm (Figure 5(d)). Its motion continued to be slow in the north-northeasterly direction after the landfall and weakened on 21 May 2010. Maximum rainfall was reduced to 275 mm (Figure 5(e)). Finally, it dissipated on 22 May 2010 (Figure 5(f)).
3.5. Validation with TRMM-3B42V6 and Rain Gauges
A quantitative comparison is made between the rainfall from present technique and that from TRMM-3B42V6. For this purpose, 67853 temporally and spatially collocated data points of daily accumulated rainfall during heavy rainfall events over land and oceanic regions are selected.
This data set includes heavy rainfall cases associated with cyclonic events, heavy rainfall spells over southern and northern part of India during south west monsoon season of 2007, 2008, 2009 and 2010. Figure 6 is a scatter plot of the two rainfall estimates, and Table 1 shows the associated statistics. Rainfall derived using the present technique and that derived from TRMM-3B42 V6 shows a correlation coefficient of 0.83, root-mean-square error of 18.24 mm and bias of 6.27 mm. Finally, usefulness of the technique to estimate heavy rainfall is examined by validation with rain gauge observations. For this purpose, 2632 spatially and temporally collocated data points from present technique and rain gauge observations for the heavy rainfall events during active monsoon period and
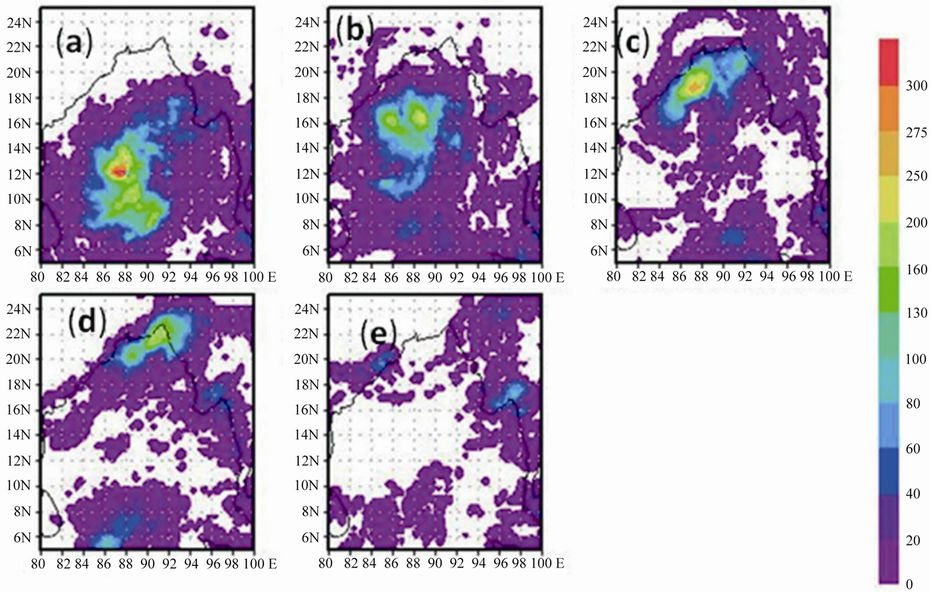
Figure 3. Daily accumulated rainfall during Bijli Cyclone on April (a) 14; (b) 15; (c) 16; (d) 17; (e) 18, 2009. Rainfall is in mm.
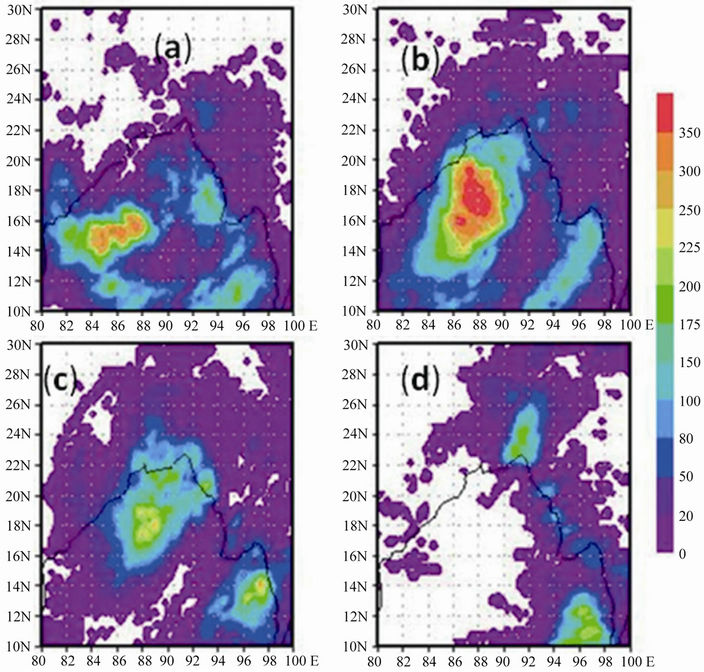
Figure 4. Daily accumulated rainfall during Aila Cyclone on May (a) 23; (b) 24; (c) 25; (d) 26, 2009. Rainfall is in mm.
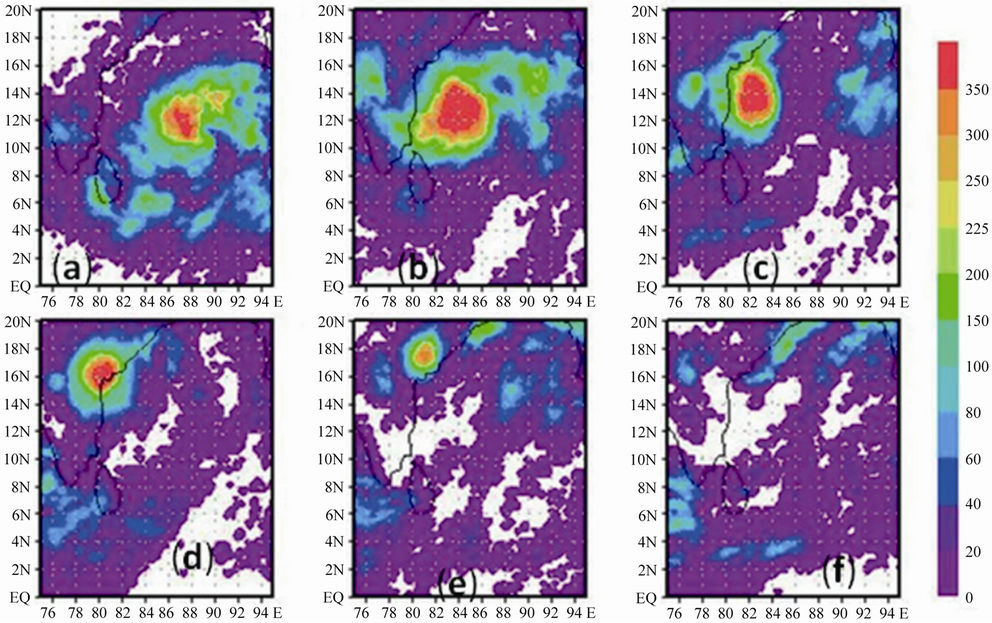
Figure 5. Daily accumulated rainfall during Laila Cyclone on May (a) 17; (b) 18; (c) 19; (d) 20; (e) 21; (f) 22, 2010. Rainfall is in mm.
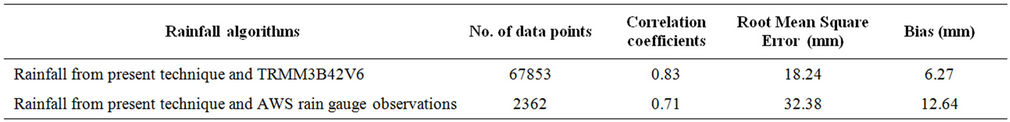
Table 1. Error statistics of rainfall from present technique with that from TRMM3B42V6 and AWS rain gauge.

Figure 6. Scatter plot between present technique and TRMM3B42V6 during heavy rain events. Rainfall is in mm.
cyclonic landfall are selected. Figure 7 shows scatter plot and Table 1 exhibits associated statistics. These two observations have a correlation coefficient of 0.71, rootmean-square error of 32.38 mm, and bias of 12.64 mm. It is confirmed from the above results that observations from rain gauges and multi-satellite sensors are able to study the heavy rainfall events accurately.
4. Conclusion
In summary the results of the present study reveal the capabilities of merged rainfall observation technique to monitor the heavy rainfall events during cyclonic storms and active cycle of Indian monsoon. The present study has proved that sparsely available rain gauge and microwave observations combined with IR data can accurately estimate the high rainfall. Recently, Indo-French mission Megha-tropiques (M-T) was successfully placed in an 867 km orbit with an inclination of 20˚ to the equator on
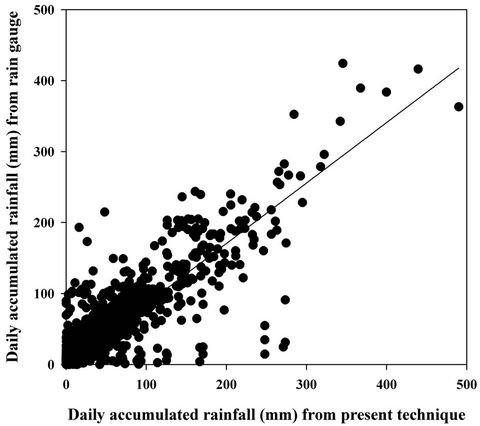
Figure 7. Scatter plot between present technique and AWS rain gauge during heavy rain events. Rainfall is in mm.
October 12, 2011. Additional channel of 157 GHz of microwave imager Microwave Analysis and Detection of Rain and Atmospheric Structures (MADRAS) will be very helpful in detecting cyclonic storms. The M-T offers an excellent opportunity to study heavy rainfall events during cyclones in near real-time along with future Indian mission INSAT-3D. The approach presented in the present study can be used to monitor the convective systems by using frequent observations from M-T and future geostationary satellite INSAT-3D.
5. Acknowledgements
Data received from TRMM, DMSP, EUMATSAT is thankfully acknowledged. AWS rain gauge data obtained from MOSDAC, SAC, ISRO is also appreciated. Useful discussions with Prof J Srinivasan is thankfully acknowledged.
REFERENCES
- B. N. Goswami, V. Venugopal, D. Sengupta, M. S. Madhusoodanan and P. K. Xavier, “Increasing Trend of Extreme Rain Events over India in a Warming Environment,” Science, Vol. 314, No. 5804, 2006, pp. 1442-1445. doi:10.1126/science.1132027
- A. Mishra, R. M. Gairola, A. K. Varma and V. K Agarwal, “Improved Rainfall Estimation over Indian Land Oceanic Regions Using Satellite Infrared Technique,” Advances in Space Research, Vol. 48, No. 1, 2011, pp. 49-55. doi:10.1016/j.asr.2011.02.016
- P. A. Arkin and B. N. Meisner, “The Relationship between Large Scale Convective Rainfall and Cold Cloud Cover over the Western Hemisphere during 1982-1984,” Monthly Weather Review, Vol. 115, No. 1, 1987, pp. 51-74. doi:10.1175/1520-0493(1987)115<0051:TRBLSC>2.0.CO;2
- A. Mishra, R. M. Gairola, A. K. Varma and V. K. Agarwal, “Study of Intense Heavy Rainfall Events over India Using KALPANA-IR and TRMMPrecipitation Radar Observations,” Current Science, Vol. 9, No. 5, 2009, pp. 689-695.
- A. Mishra, R. M. Gairola, A. K. Varma and V. K. Agarwal, “Remote Sensing of Precipitation over Indian Land and Oceanic Regions by Synergistic Use of Multi-Satellite Sensors,” Journal of Geophysical Research, Vol. 115, 2010, 12 p. doi:10.1029/2009JD012157
- A. Mishra, R. M. Gairola and V. K. Agarwal, “Rainfall Estimation from Combined Observations Using KALPANA-IR and TRMM-Precipitation Radar Measurements over Indian Region,” Journal of Indian Society of Remote sensing, Vol. 40, No. 1, 2011, pp. 65-67. doi:10.1007/s12524-011-0128-9
- A. Mishra, R. M. Gairola and A. Yatagai, “Estimation of Precipitation over India and Associated Oceanic Regions by Combined Use of Gauge and Multi-Satellite Sensor Observations at Fine Scale,” Global Environmental Research, Vol. 15, No. 2, 2012, pp. 131-138.
- M. Anoop, R. M. Gairola, A. K. Varma, A. Sarkar and V. K. Agarwal, “Rainfall Retrieval over Indian Land and Oceanic Regions from SSM/I Microwave Data,” Advances in Space Research, Vol. 44, No. 7, 2009, pp. 815-823. doi:10.1016/j.asr.2009.05.010.01
- R. F. Adler, G. J. Huffman and P. R. Keehn, “Global Rain Estimates from Microwave Adjusted Geosynchronous IR Data,” Remote Sensing Review, Vol. 11, No. 1-4, 1993, pp. 125-135. doi:10.1080/02757259409532262
- I. Jobard and M. Desbois, “Satellite Estimation of the Tropical Precipitation Using the Meteosat and SSM/I Data,” Atmospheric Research, Vol. 34, No. 1-4, 1994, pp. 285-298. doi:10.1016/0169-8095(94)90097-3
- S. Sooroshian, K. L. Hsu, X. Gao, H. V. Gupta, B. Imam and D. Braithwaite, “Evaluation of PERSIANN System Satellite-Based Estimates of Tropical Rainfall,” Bulletin of American Meteorological Societies, Vol. 81, No. 9, 2000, pp. 2035-2046. doi:10.1175/1520-0477(2000)081<2035:EOPSSE>2.3.CO;2
- S. Pinori, C. Adamo, S. di Michele, S. Dietrich, A. Mugnai, A. Tassa, G. J. Tripoli and E. A. Smith, “Satellite Observations of Heavy Rain Producing Storms over the Mediterranean Area,” Proceedings of the 4th EGS Plinius Conference, Mallorca, 2-4 October 2002, pp. 1-4.
- H. Jinag, J. B. Halverson, J. Simpson and E. J. Zipser, “Hurricane ‘Rainfall Potential’ Derived from Satellite Observations Aids Overland Rainfall Prediction,” Journal of Applied Meteorology and Climatology, Vol. 47, No. 4, 2008, pp. 944-959. doi:10.1175/2007JAMC1619.1
- K. M. Krishna and S. R. Rao, “Study of the Intensity of Super Cyclonic Storm GONU Using Satellite Observations,” International Journal of Applied Earth Observation and Geoinformation, Vol. 11, No. 2, 2009, pp. 108-113. doi:10.1016/j.jag.2008.11.001
- A. Mugnai, S. Dietrich, D. Casella, F. di Paola, M. Formenton and P. Sanò, “Heavy Precipitation Retrieval from Combined Satellite Observations and Ground-Based Lightning Measurements,” 12th Plinius Conference on Mediterranean Storms Corfu Island, Corfu Island, 1-4 September 2012, pp. 12-28.
- B. Preethi, J. V. Revadekar and A. A. Munot, “Extremes in Summer Monsoon Precipitation over India during 2001-2009 Using CPC High-Resolution Data,” International Journal of Remote Sensing, Vol. 32, No. 3, 2011, pp. 717-735. doi:10.1080/01431161.2010.517795
- S. Prakash, C. Mahesh, R. M. Gairola and P. K. Pal, “Comparison of High-Resolution Trmm-Based Precipitation Products during Tropical Cyclones in the North Indian Ocean,” Natural Hazards, Vol. 61, No. 2, 2011, pp. 689- 701. doi:10.1007/s11069-011-0055-7
- S. Laviola, A. Moscatello, M. M. Miglietta, E. Cattani and V. Levizzani, “Satellite and Numerical Model Investigation of Two Heavy Rain Events over the Central Mediterranean” Journal of Hydrometeorology, Vol. 12, No. 4, 2011, pp. 634-649. doi:10.1175/2011JHM1257.1
- T. Iguchi, T. Kozu, R. Meneghini, J. Awaka and K. Okamoto, “Rain-Profiling Algorithm for the TRMM Precipitation Radar,” Journal of Applied Meteorology, Vol. 39, No. 12, 2000, pp. 2038-2052. doi:10.1175/1520-0450(2001)040<2038:RPAFTT>2.0.CO;2
- G. J. Huffman, R. F. Adler, D. T. Bolvin, G. Gu, E. J. Nelkin, K. P. Bowman, Y. Hong, E. F. Stocker and D. B. Wolf, “The TRMM Multisatellite Precipitation Analysis (TMPA): Quasi-Global, Multiyear, Combined-Sensor Precipitation Estimates at Fine Scales,” Journal of Hydrometeorology, Vol. 8, No. 1, 2007, pp. 38-55. doi:10.1175/JHM560.1
- IMD Report, “Cyclonic Disturbances over North Indian Ocean during 2007,” 2008. www.imd.gov.in/section/nhac/dynamic/RSMC-2007.pdf