International Journal of Astronomy and Astrophysics
Vol.2 No.4(2012), Article ID:26296,10 pages DOI:10.4236/ijaa.2012.24033
The Orbital Modulation for the Spectrum and Mass Accretion Rate in Circinus X-1
1Xinjiang Astronomical Observatory, Chinese Academy of Sciences, Urumqi, China
2University of Chinese Academy of Sciences, Beijing, China
3Key Laboratory of Particle Astrophysics, Institute of High Energy Physics, Chinese Academy of Sciences, Beijing, China
Email: dinggq@gmail.com
Received September 16, 2012; revised October 20, 2012; accepted November 30, 2012
Keywords: Accretion Disk; Compact Object; Neutron Star; Individual (Circinus X-1)
ABSTRACT
Using the data from the Proportional Counter Array on board the Rossi X-Ray Timing Explorer satellite, we study the orbital modulation for the spectrum and mass accretion rate of Cir X-1 during its two orbital periods. We use a model consisting of a blackbody, a multicolor disk blackbody, and a line component to fit the spectrum and find that the spectrum is obviously modulated by the orbital phase. It is shown that the disk accretion rate in Cir X-1 undergoes three states during the orbital period. At the periastron with orbital phase 0 - 0.1, the disk accretion rate is sup-Eddington, then from phase 0.1 to the apastron (phase 0.5) it decreases dramatically and becomes near-Eddington, and from the apastron to the next periastron (phase 1) the disk accretion rate approximates Eddington and tends to be steady. We argue that the evolution of the disk accretion rate is attributed to the high orbital eccentricity of this source. The mass accretion rate onto the neutron star is much less than that onto the inner disk, indicating significant outflows in this source.
1. Introduction
1.1. Cir X-1
Circinus X-1 (Cir X-1), a peculiar X-ray binary with an orbital period of ~16.6 days [1] and a distance of 5.5 kpc [2], was suspected to be a black hole or a neutron star (NS) ago. It cannot easily be classified into any of the major categories of X-ray binaries and it is debatable whether it is a low-mass X-ray binary (LMXB) or a high-mass X-ray binary (HMXB). Cir X-1 was discovered by Margon et al. [3]. Due to the close similarity in the millisecond variability in X-ray emission from black hole candidate Cyg X-1 and Cir X-1, Toor [4] suggested that it is a black hole. From the optical, infrared (IR), and radio emission, Nicolson et al. [5] believed that it is a binary in which a compact object is surrounded by an accretion disk that is being replenished by a companion. A strong radio flare of Cir X-1 was observed with the observations of Very Long Baseline Interferometry (VLBI) [6]. The European Space Agency’s Observatory, EXOSAT, observed type I X-ray bursts from Cir X-1, indicating that its compact star is a NS [7,8]. Also from EXOSAT observations, low-frequency (1.4 Hz, 5 - 20 Hz) quasi-periodic oscillations (QPOs) and much higher frequency (100 - 200 Hz) QPOs were detected in this source [9,10]. Qu et al. [11,12] investigated the time lags of this source.
Since the early 1990s, the observations with unprecedented resolutions have updated our understanding to Cir X-1. The high-resolution radio studies with the Australia Telescope showed clear evidence for jet-like structure within the nebula surrounding Cir X-1, implying that Cir X-1 is a runway binary from the supernova explosion [13]. Oosterbroek et al. [14] reported that its fast-timing properties resemble those of atoll sources sometimes. The observation from the Advanced Satellite for Cosmology and Astrophysics (ASCA) showed the spectral evidence for partial covering near zero phase [15]. Using the observations from the Rossi X-ray Timing Explorer (RXTE), Shirey et al. [16,17] detected Z-source QPOs in Cir X-1, refuting the hypothesis for Cir X-1 to be an atoll source. With Chandra observations, the X-ray Cygni lines were discovered in Cir X-1, which may arise in the moderate temperature (~5 × 10⁶ K) region of the wind from an X-ray-heated accretion disk, suggesting a relatively edge-on disk [18]. Using observations from RXTE, Ding et al. [19] studied the hard X-ray tail on its hardness-intensity diagram (HID) and found the similarity between this source and Z sources. Also using RXTE observations, Boutloukos et al. [20] discovered twin kHz QPOs in Cir X-1, which have been detected in many NS X-ray binaries (NSXBs).
Cir X-1 is an NSXB in which both radio and X-ray outflows (jets) have been observed. Fender et al. [21] observed its ultra-relativistic radio outflows and found that the velocity of the outflow is comparable to the fastest-moving flows detected in active galactic nuclei (AGNs). Heinz et al. [22] found the evidence of X-ray jet from Cir X-1, making it the first NSXB in which an extended X-ray jet is detected. Calvelo et al. [23,24] reported that from the radio and millimetre observations of Cir X-1 the flare was detected at the periastron and it proceeded and declined afterwards, showing the orbital modulation for radio emission. Miller-Jones et al. [25] carried out observations of radio resolved imaging, then observed the milliarcsecond-scal jets in detail, and found that the radio emitting is symmetric and mildly relativistic. Moreover, using Chandra observations, Soleri et al. [26] detected X-ray structures. Additionally, the Chandra observations revealed the bipolar X-ray outflows spatially coincident with the radio jets and with wide opening angles, suggesting that the jets are either not very well collimated or precessing [27]. From the X-ray spectra obtained with the High-Energy Transmission Grating Spectrometer on Chandra, a rich set of X-ray P Cygni lines were detected, which indicates the presence of a high-velocity outflow in this source, interpreted as an accretion-disk wind [18,28]. Considering the rotational effect of the NS, from the “relativistic precession” model, Török et al. [29] estimated the mass range of the compact object of Cir X-1, which extends up to 3 M⊙. Using the observations from three satellites, i.e. RXTE, Swift, and Chandra, D’Aì et al. [30] studied the broadband X-ray spectral evolution of Cir X-1 during its 2010 May-June outbursts and found that the X-ray spectrum can be satisfactorily described by a thermal Comptonization model.
1.2. The Orbital Modulation in Cir X-1
One of the special parameters of Cir X-1 is its high orbital eccentricity (e ~ 0.7 - 0.9) [31-33], which makes it a peculiar source. Oosterbroek et al. [14] suggested that it is its highly eccentric orbit that leads to the complex spectral and fast-timing behaviors of this source. Using ASCA observations for Cir X-1, Iaria et al. [34] studied its spectral evolution along one orbital period and found that this source experiences three states during the orbital period. Making use of RXTE observations, Ding et al. [35] investigated the evolution of its broadband spectra (3 - 220 keV) during two orbital periods and found that its hard X-ray emission is modulated by the orbital phase. With RXTE observations, Shirey et al. [36] studied the evolution of the Fourier power density spectrum during one orbital period and found strong correlation between the QPO behavior and the phase.
Johnston et al. [33] made the optical and IR observations for Cir X-1. In order to interpret the the optical and IR emission lines, Johnston et al. [33] consider Cir X-1 as a system which comprises a giant star with mass 3 - 5 M⊙ and a NS orbiting around the star on an orbit with high eccentricity. Furthermore, from their model, Johnston et al. [33] proposed a scenario for the mass accretion to evolve along the orbital phase: during the periastron (phase 0) the NS is closest to the companion star, so the accretion disk might be disrupted by the huge tidal force, possibly resulting in large X-ray fluctuation; after the periastron passage until the apastron (phase 0.5), an accretion disk is formed gradually; after the apastron, steady accretion via the disk occurs. From the scenario proposed by Johnston et al. [33], it is feasible to foresee the evolution of mass accretion rate along the orbital phase: the mass accretion rate will be high at the periastron due to much mass transferred from the companion star to the NS, then after the periastron it will be decreased, because the NS departs from the companion star, and until after the apastron the mass accretion rate on the disk will be steady, owing to the cease of mass transfer. However, the mass accretion rates of Cir X-1 at different orbital phases have never been calculated quantitatively.
In this work, using the data for Cir X-1 from the Proportional Counter Array (PCA) on board the RXTE, we study its spectra, calculate its mass accretion rates during two orbital periods, and investigate the orbital modulation for mass accretion rate. We describe our data analysis in Section 2, describe and discuss the results in Section 3, and present our conclusions in Section 4.
2. Data Analysis
2.1. Section of Observations and the Spectral Model
In this work, we choose the observations during two orbital periods of Cir X-1 to perform our analysis. The first and second orbital periods include 18 and 11 OBSIDs, respectively, which were made between 1996 September
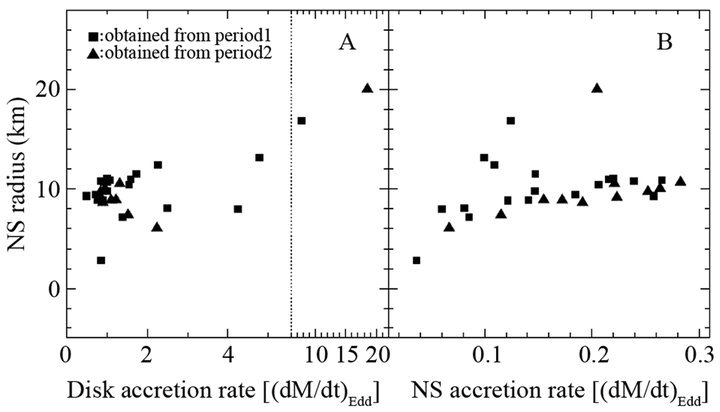
Figure 1. The correlation between the inferred NS radius and the disk accretion rate as well as the NS accretion rate.
21 and October 7 (MJD 50,347 - 50,363), and between 1996 March 8 and March 19 (MJD 50,150 - 50,161), respectively. Following Stewart et al. [37], the time of zero phase is given by the ephemeris equation
 . (1)
. (1)
We use this equation to determine the orbital phase interval of every OBSID.
We use the Standard Mode 2 data from PCA to extract the spectra and use the bright background model supplied by RXTE team to produce the background spectra. We use software HEASOFT 6.11 and FTOOLS V6.11 to perform our data analysis. The soft color is defined as the ratio of count rate in 6.3 - 13 keV to that in 2 - 6.3 keV, while the hard color is defined as the ratio of count rate in 13 - 18 keV to that in 6.3 - 13 keV. The source intensity is the count rate per PCA top layer in 2 - 18 keV. Figure 2 shows the evolution of the source intensity, soft color, and hard color along the orbital phase. When the spectra are produced, only the data from the top layers of the five Proportional Counter Units (PCUs) are used and the observations with RXTE pointing offsets larger than 0.02˚ or elevation angles less than 10˚ are discarded.
Ding et al. [35] used the data from PCA and the data from High-Energy X-ray Timing Experiment (HEXTE) during the two orbital periods together to study the broadband spectra of Cir X-1 and found the orbital modulation for the hard tail. In order to have sufficient statistics for the
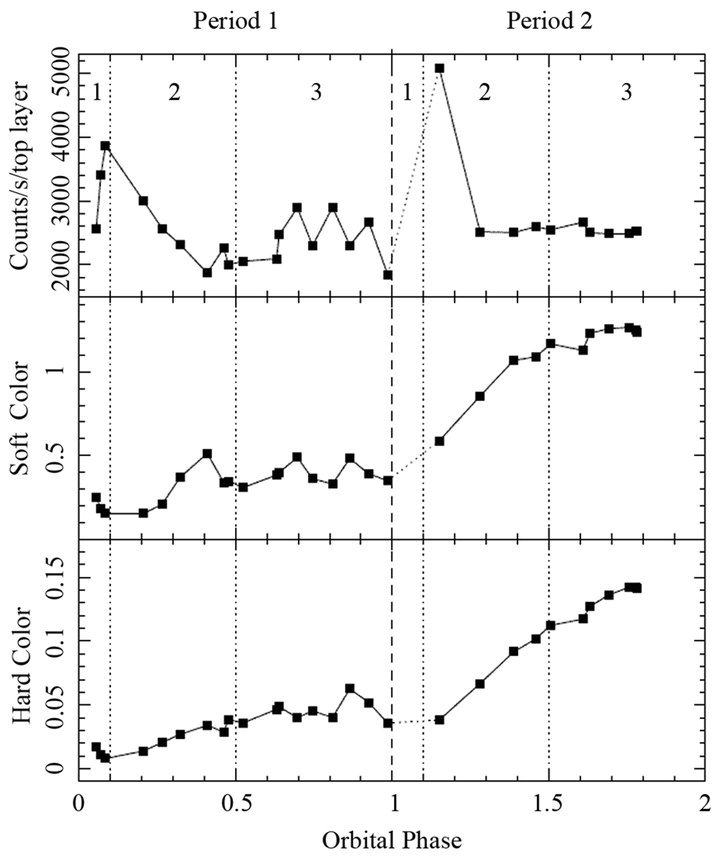
Figure 2. Top: the source intensity in 2 - 18 keV. Mid: soft color. Bottom: hard color. Every point represents the 16 s averaged value.
HEXTE spectra, several observations were combined together to produce a broadband spectrum. Ding et al. [35] extracted 11 broadband spectra using the data from the same 29 OBSIDs. Nevertheless, in this work we focus on the orbital modulation for the low-energy spectrum and mass accretion rate. The PCA spectrum is feasible to our investigation and, moreover, we wish to have enough statistics for this study, so we discard the data from HEXTE and extract 29 PCA spectra.
Shirey et al. [17] used several spectral models to fit the PCA spectra of Cir X-1 and found that the best-fit model is the so-called “Eastern model”, consisting of a blackbody (BB) and a multicolor disk blackbody (MCD), which are interpreted as the emission from the NS surface and the optically thick accretion disk, respectively. We adopt this model and use it to fit the 29 PCA spectra. Generally, a line component, interpreted as the iron emission line, is detected in the spectrum of X-ray binaries, so a line component is included in the spectral model. The interstellar absorption is also taken into account and, however, the lack of spectrum below ~3 keV presents XSPEC from determining the hydrogen column density (NH), so we fix it at 1.80 × 1022 cm−2 [34,38]. We us XSPEC version 12.7 to fit the spectrum. When fitting, a systematic error of 1% is added to the spectrum due to the calibration uncertainties. Figure 3 shows two unfolded spectra and the corresponding residuals. The spectral fitting results are listed in Table 1.
2.2. Estimate of Mass Accretion Rate
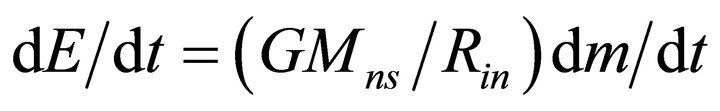
In the duration , attracted by the NS gravity, when mass
  is accreted from the infinity to the inner disk radius
 , the released gravitational potential energy
  will be
 , (2)
, (2)
where  and
and  are the gravitational constant and NS mass, respectively. From the above equation, we have
 , (3)
, (3)
where  should be the disk luminosity provided by accretion and
  is the mass accretion rate of the disk. Let
  and
and , we get
 , (4)
, (4)
where ![]() and
and  are the disk luminosity and the inner disk radius, respectively, which can be obtained from spectral fitting. With known
  and
and  (Mns = 1.4 M⊙), we can calculate the mass accretion rate of the disk by using Equation (4).
Some accreting matter will not stop at the inner disk edge and goes across the magnetospheric surface onto
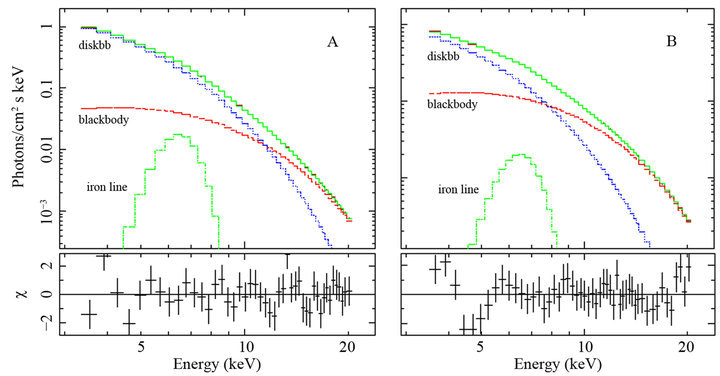
Figure 3. Panel A: the unfolded spectrum and the corresponding residual at orbital phase 0.32 in period1. Panel B: the unfolded spectrum and the corresponding residual at orbital phase 0.76 in period 2. The individual components are shown, namely, a blackbody (dash line), a diskbb (dot line), and an iron emission line at ~6.6 keV (dot-dash line). The solid line on the top represents the sum of the three individual components.
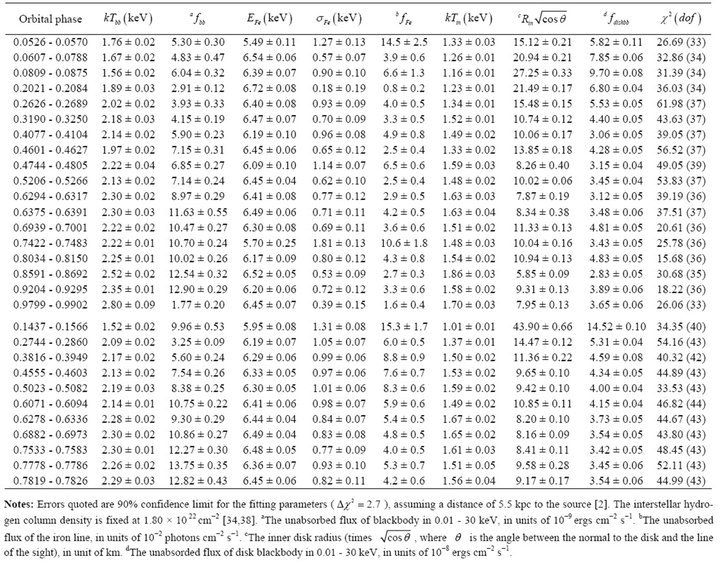
Table 1. The spectral fitting parameters during two orbital periods of Cir X-1, using a model consisting of a blackbody, a line, plus a multicolor disk blackbody.
the NS to form accretion columns above the magnetic poles [39]. Applying Equation (4) to the accretion onto the NS, we get the mass accretion onto the NS as
 , (5)
, (5)
where Rns is the NS radius (Rns = 10 km), Lns is the NS luminosity, which can also be derived from spectral fitting. Therefore, the NS mass accretion rate can be inferred from Equation (5).
When Ldisk and Lns are computed, a distance of 5.5 kpc to the source is taken [2] and the flux in the whole energy band is used. The flux below ~2 keV cannot be estimated from the PCA response matrix. Due to the inner disk temperature  or the blackbody temperature
  is lower than several keV, the disk flux below ~2 keV or the NS flux lower than ~2 keV contributes a considerable portion of the flux in the whole energy band. We apply the XSPEC command “dummyrsp” to create a dummy response matrix below ~2 keV, so that we obtain the flux in the whole energy band.
In the case of a spherically symmetric accretion flow, the NS Eddington luminosity was given by Burger and Katz [40] as
 , (6)
, (6)
where ![]() (0.398 cm−2 g−1) is the opacity and
(0.398 cm−2 g−1) is the opacity and ![]() is the light velocity. The NS Eddington luminosity will be 1.76 × 1038 ergs s−1 under condition Mns = 1.4 M⊙, and the NS Eddington accretion rate will be
is the light velocity. The NS Eddington luminosity will be 1.76 × 1038 ergs s−1 under condition Mns = 1.4 M⊙, and the NS Eddington accretion rate will be
 . (7)
. (7)
Taking the NS radius to be 10 km, the NS Eddington accretion rate  will be 1.50 × 10⁻⁸ M⊙ yr−1. Hereafter, in order to discuss more physically, we take the Eddington accretion rate as the unit of accretion rate. The estimated mass accretion rates are listed in Table 2.
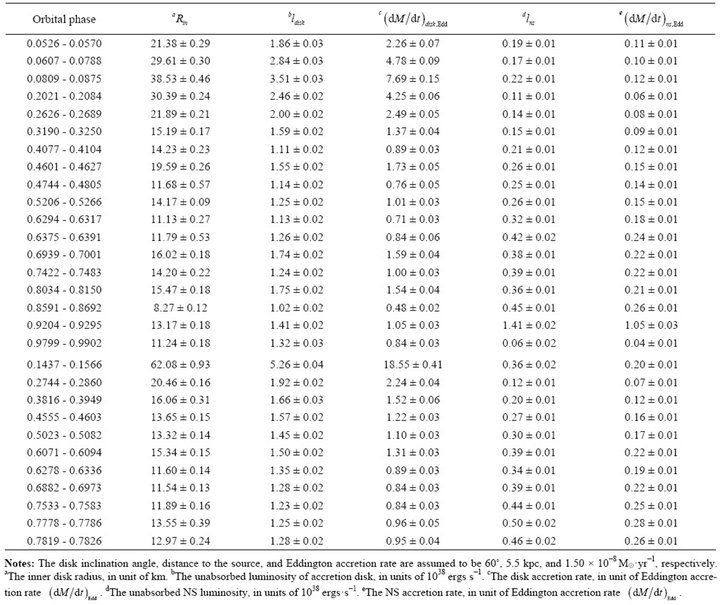
Table 2. The estimated mass accretion rates of Cir X-1.
The BB in our spectral model is interpreted as the emission from the NS, so the BB radius inferred from BB parameters, including BB temperature and BB luminosity, will be the NS radius. However, we find that the inferred BB radii are much less than the typical NS radius (10 km). Therefore, in order to get the typical NS radius 10 km, the inferred BB radii are multiplied by a coefficient.
3. Result and Discussion
3.1. The Evolution of Spectral Parameter along the Orbital Phase
As shown in Figure 2, the source intensity and colors are obviously modulated by the orbital phase. Each of the two periods can be divided into three epochs with orbital phase 0 - 0.1 (or 1 - 1.1), 0.1 - 0.5 (or 1.1 - 1.5), and 0.5 - 1 (or 1.5 - 2), respectively. In the first epoch, around the periastron, the source intensity increases dramatically with orbital phase, while the colors decrease. However, in the second epoch from orbital phase 0.1 to the apastron (phase 0.5), the source intensity continuously decreases with the orbital phase and meanwhile the colors increase. In the third epoch, both the count rate and the colors do not show obvious evolution, in other words they basically keep unvaried or fluctuate around a central value. Our results are generally in agreement with those of Iaria et al. [34], whereas some of ours are different from theirs: during the whole orbital period, the source intensity continuously decreases with the orbital phase; within the orbital phase interval 0 - 0.1, the hardness decreases with the orbital phase, but during all the left orbital phases from 0.1 to 1, the hardness continuously increases with the orbital phase.
Figure 4 shows the orbital modulation of the spectral parameters. In the first epoch, with increase of orbital phase, both the disk temperature and the BB temperature decrease and, however, both the disk flux and the inner disk radius increase. The evolution of thermal temperatures, or disk flux, or inner disk radius in the second epoch is just the opposite from that in the first epoch. In the third epoch, the BB temperature increases, but the inner disk temperature, or the disk flux, or the inner disk radius fluctuates.
As shown in the two bottom panels in Figure 4, it is peculiar that the NS radius, inferred from the BB parameters, fluctuates around the typical NS radius (10 km) during the two orbital periods and it is an only independent parameter, which gives us the confidence for our spectral model. Moreover, Figure 1 shows that in most cases, the inferred NS radius is not correlated with the disk accretion rate or the NS accretion rate. However, Shirey et al. [17] found that as long as the mass accretion rate increases along the direction of the “Z” track, the BB radius increases with the mass accretion rate.
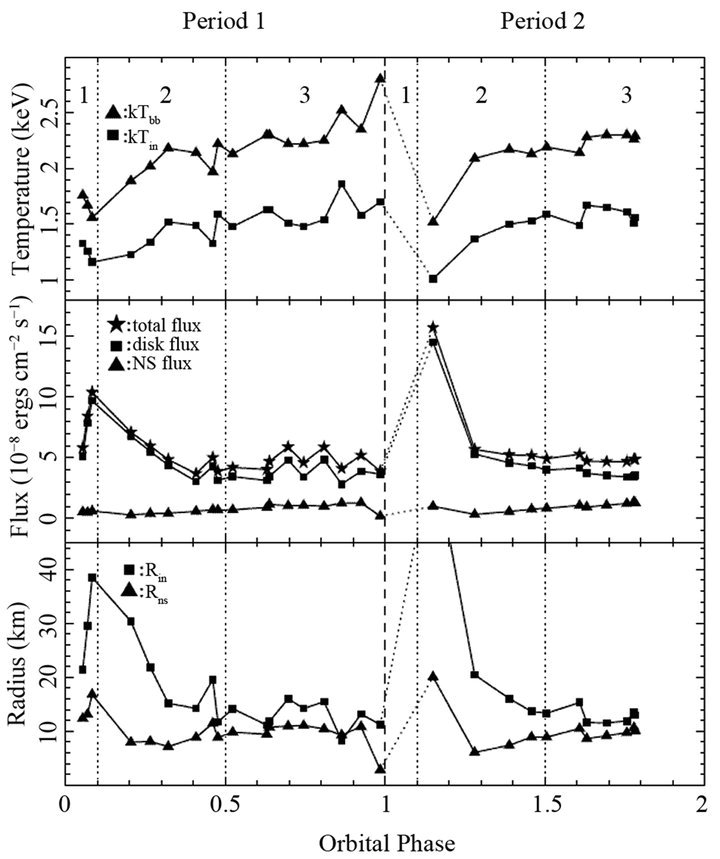
Figure 4. The spectral parameters at different orbital phases. The spectra are fitted by the BB + MCD + LINE model. The fluxes are the ones in 0.01 - 30 keV. The NS radius (Rns) is inferred from the blackbody temperature and blackbody luminosity.
3.2. The Orbital Modulation for Mass Accretion Rate
In this work, with the spectral fitting parameters, we calculate the mass accretion rates of Cir X-1 at different orbital phases, which are shown in Figure 5. One can see the obvious orbital modulation for the disk accretion rate. At the periastron with phase 0 - 0.1, the disk accretion rate is super-Eddington and increases abruptly, then from phase 0.1 to the apastron (phase 0.5) it decreases and becomes near-Eddington, and from the apastron to the next periastron (phase 1) the disk accretion rate approaches Eddington and basically keeps unvaried as well. As suggested by Johnston et al. [33], the orbital modulation for the disk mass accretion rate is attributed to the high orbital eccentricity of this source.
At the first epoch with phase 0 - 0.1, i.e. at the periastron, the NS is close to the companion star which overfills its Roche lobe, resulting in the mass transfer from the companion star to the NS at the super-Eddington mass accretion rate. Meanwhile, at this episode, due to tidal interactions, it is difficult for the accretion disk to form or the disk is disrupted, leading to large X-ray fluctuations (see the top panels of Figure 2 or the middle panels of Figure 4). Some special phenomena have been observed at the periastron. Shiery et al. [17] detected a
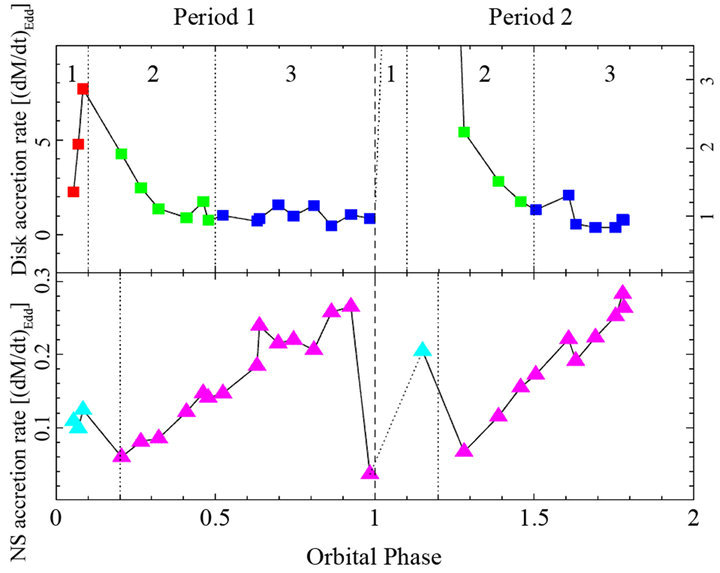
Figure 5. The orbital modulation for the mass accretion rates. Top: the disk mass accretion rate. It is shown that in the first epoch (orbital phase 0 - 0.1, or 1 - 1.1), the disk mass accretion rate increases with orbital phase, but it decreases with orbital phase in the second epoch (orbital phase 0.1 - 0.5, or 1.1 - 1.5), and it steadies in the third epoch (orbital phase 0.5 - 1, or 1.5 - 2). Bottom: the NS mass accretion rate. The NS mass accretion rate fluctuates in the orbital phase interval 0 - 0.2 (or 1 - 1.2), and, however, after orbital phase 0.2 (or 1.2) it continuously increases with orbital phase. Additionally, the NS accretion rate is much less than the disk accretion rate.
line component at ~10 keV in the spectrum of this source, and Ding et al. [35] conformed it and found that it only occurs at the periastron. Also at the periastron, the partial covering was found by Brandt et al. [15] and a long-term dip was present, which could be attributed to the partial covering [41]. Maybe, these special behaviors are linked to the tidal interaction at the periastron. The huge tidal force could destroy the disk and the matter of the damaged disk might be thrown out by the large NS radiation pressure to form outflows. Sequentially, the line component at ~10 keV could be resulted from the emission of some heavy elements such as Ni, as suggested by Asai et al. [42], which could come from the outflows, and the outflows might cover the source’s emission partially.
In the second epoch from phase 0.1 to the apastron (phase 0.5), the NS departs from the companion star, then the companion star partially overfills its Roch-lobe surface, and thus the mass transfer decreases, resulting in the rapid decrease of accretion rate. Meanwhile, an accretion disk is gradually formed, which might be geometrically thick, because the disk accretion rate exceeds or approaches the Eddington limit.
After the apastron passage, the NS is far away from the companion star, then the companion star is detached from its Roch-lobe surface, so mass transfer ceases. However, accretion via a steady disk continues to operate till the next periastron passage, where the disk is disrupted by the tidal interaction. When the NS proceeds the next periastron, the companion star overfills its Roch-lobe again, switching on another cycle of super-Eddington accretion, formation of disk, and steady disk accretion.
When accretion onto the inner disk takes place in the steady disk, the accreting matter approaches the magnetosphere, then it will be controlled by the NS magnetic field and moves along the magnetic field line onto the NS to form an accretion column above the magnetic poles. We investigate the accretion onto the NS and calculate the mass accretion rate onto the NS using Equation (5). Mass continuity requires that the mass accretion rate onto the NS should be equal to the disk mass accretion rate. However, as shown by Figure 5, the disk accretion rate is much larger than the NS accretion rate, indicating significant outflows in this system. Moreover, the evolution of the NS mass accretion rate differs from that of the disk mass accretion rate. Except at the periastron, the NS accretion rate continuously increases with the orbital phase. It is likely that the increase of NS accretion rate is attributed to the steady accretion in the disk. After the periastron passage, an accretion disk is formed and the steady mass accretion in the disk takes place, resulting in that the accreting matter is accumulated in the inner disk and more accreting matter is supplied for the NS accretion.
3.3. The Evolution of the Inner Disk Radius along the Orbital Phase
As demonstrated in Figure 6, the disk luminosity deviates from the relation of , which is obviously attributed to that the inner disk radius
  or the disk
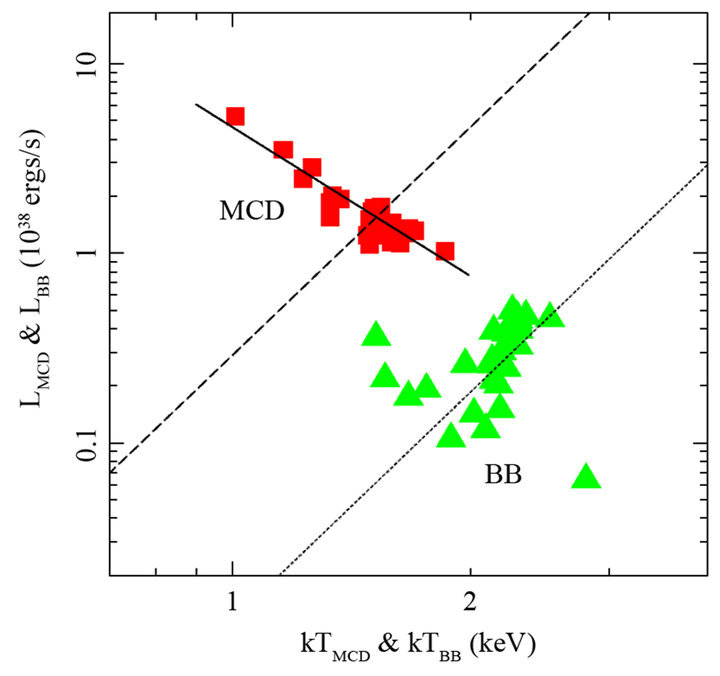
Figure 6. The luminosities of spectral components (MCD/ BB) vs. their characteristic temperatures. The red squares and blue triangles represent the results of MCD and BB, respectively. The dashed line and dotted line correspond to , with
  km and
  km, respectively. The solid line corresponds to
 .
.
emission area  is varied, because the disk luminosity
 , the inner disk temperature
 , and the inner disk radius
  are correlated via [43]
 , (8)
, (8)
where σ is the Stefan-Boltzmann constant. The bottom panels of Figure 4 shows the evolution of the inner disk radius along the orbital phase. From phase 0.1 to the apastron, the inner disk radius decreases rapidly, in other words, the disk goes to the NS fast. Shirey et al. [36] reported that in the phase interval ~(0.4 - 0.8), the frequency of QPOs increases with the increase of phase, just in agreement with the decrease of inner disk radius, if the QPO frequency is assumed to be the kepler’s frequency of the inner disk. After the apastron, the inner disk radius fluctuates around a value slightly larger than the NS radius (10 km), indicating that the disk neighbors the NS. It is interesting that the disk luminosity is inversely correlated with the inner disk temperature (see Figure 6). This inverse relation is resulted from that when the NS departs from the companion star, the inner disk temperature increases slowly and, however, the inner disk radius decreases rapidly.
Similarly, the disk emission of the first transient Z source XTE J1701-462 also deviates from the relation of , which Lin et al. [44] attributed to the local Eddington limit, while Ding et al. [45] ascribed to the interaction between the disk and the magnetosphere of the NS. However, Lin et al. [46] found that the inner disk radius is unvaried in two atoll sources, i.e. 4U 1608-52 and Aql X-1, and suggested that the constant inner disk radius is set by the innermost stable circular orbit (ISCO). The NS surface magnetic field might be responsible for the evolution of inner disk radius. The NS surface magnetic field strength of atoll sources might be low, so that the magnetosphere possibly shrinks within the ISCO and then the inner disk edge terminates at the ISCO, which is similar to the case of black hole X-ray binaries (BHXBs) [47]. However, in Z sources, the NS surface magnetic field strength is high, so the magnetosphere could exceed the ISCO and, therefore, the magnetosphere interacts with the disk, resulting in the evolution of the inner disk.
Additionally, in Figure 6, it is shown that the NS emission also does not obey the relation of , which is resulted from the fact that the BB emission radius
  or area
  is changed, because the BB luminosity
 , the BB temperature
 , and the BB radius
  are correlated via
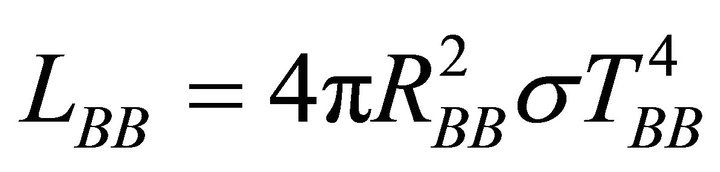 . (9)
. (9)
The varied BB emission radius or area indicates that the size of the hot spot formed by the accreting matter onto the NS surface is changed.
4. Conclusion
We analyzed the spectra of Cir X-1 during its two orbital cycles and investigated the evolution of mass accretion rates along the orbital phase. The spectra can be fit by a model consisting of a BB, plus a MCD. At the periastron, the disk accretion rate is super-Eddington and increases abruptly, then after the periastron passage until the apastron it decreases rapidly and becomes near-Eddington, and finally after the apastron until the next periastron, the disk accretion rate approaches the Eddington and keeps steady. We propose that the evolution of the disk accretion rate is attributed to the high orbital eccentricity of this source. The disk emission deviates from the relation of  and the disk luminosity is inversely correlated with the inner disk temperature, which is resulted from the slow increase of inner disk temperature and, however, the rapid decrease of inner disk radius during the passage for the NS to leave the companion star.
5. Acknowledgements
This research has made use of the data obtained through the High Energy Astrophysics Science Archive Research Center (HEASARC) On-line Service, provided by NASA /Goddard Space Flight Center (GSFC). This work is partially supported by the National Basic Research Program of China (973 Program 2009CB824800), the Natural Science Foundation of China under grant nos. 11143013, 11173024, and 11203064, the Program of the Light in Chinese Western Region (LCWR) under grant nos. LHXZ 200802 and XBBS 201121 provided by Chinese Academy of Sciences (CAS), and the Natural Science Foundation of Xinjiang Uygur Autonomous Region of China under grant no. 200821164.
REFERENCES
- L. J. Kaluzienski, S. S. Holt, E. A. Boldt and P. J. Serlemitsos, “Evidence for a 16.6 Day Period from Circinus X-1,” Astrophysical Journal, Vol. 208, No. 2, 1976, pp. L71-L75. doi:10.1086/182235
- G. L. Case and D. Bhattacharya, “A New Sigma-D Relation and Its Application to the Galactic Supernova Remnant Distribution,” Astrophysical Journal, Vol. 504, No. 2, 1988, pp. 761-772. doi:10.1086/306089
- B. Margon, M. Lampton, S. Bowyer and R. Cruddace, “A Pulsing X-Ray Source in Circinus,” Astrophysical Journal, Vol. 169, 1971, pp. L23-L25. doi:10.1086/180806
- A. Toor, “Millisecond X-Ray Bursts from Circinus X-1,” Astrophysical Journal, Vol. 215, No. 2, 1977, pp. L57- L60. doi:10.1086/182477
- G. D. Nicolson, I. S. Glass and M. W. Feast, “Recent Changes in the Optical, Infrared and Radio Emission from Circinus X-1,” Monthly Notices of the Royal Astronomical Society, Vol. 191, 1980, pp. 293-299.
- R. A. Preston, D. D. Morabito, A. E. Wehrle, D. L. Jauncey, M. J. Batty, R. F. Haynes, A. E. Wright and G. D. Nicolson, “VLBI Observations of a Radio Flare of Circinus X-1,” Astrophysical Journal, Vol. 268, No. 2, 1983, pp. L23-L26. doi:10.1086/184022
- A. F. Tennant, A. C. Fabian and R. A. Shafer, “The Discovery of X-Ray Bursts from CIR X-1,” Monthly Notices of the Royal Astronomical Society, Vol. 219, 1986, pp. 871-881.
- A. F. Tennant, A. C. Fabian and R. A. Shafer, “Observation of Type I X-Ray Bursts from CIR X-1,” Monthly Notices of the Royal Astronomical Society, Vol. 221, 1986, pp. 27P-31P.
- A. F. Tennant, “High-Frequency Oscillations from CIR X-1,” Monthly Notices of the Royal Astronomical Society, Vol. 226, 1987, pp. 971-978.
- A. F. Tennant, “Observations of 1.4-Hz Quasi-Periodic Oscillations in CIR X-1,” Monthly Notices of the Royal Astronomical Society, Vol. 230, 1988, pp. 403-404.
- J. L. Qu, W. Yu and T. P. Li, “The Cross Spectra of Circinus X-1: Evolution of Time Lags,” The Astrophysical Journal, Vol. 555, No. 1, 2001, pp. 7-11. doi:10.1086/321460
- J. L. Qu, Y. Lu, G. Q. Ding, F. Zhang, Y. J. Lei and Z. B. Li, “The Time Lag Spectrum of Cir X-1 on Its Normal Branch,” Science China Physics, Mechanics and Astronomy, Vol. 53, No. 1, 2010, pp. 60-63. doi:10.1007/s11433-010-0035-z
- R. T. Stewart, J. L. Caswell, R. F. Haynes and G. J. Nelson, “Circinus X-1—A Runaway Binary with Curved Radio Jets,” Monthly Notices of the Royal Astronomical Society, Vol. 261, No. 3, 1993, pp. 593-598.
- T. Oosterbroek, M. van der Klis, E. Kuulkers, J. van Paradijs and W. H. G. Lewin, “Circinus X-1 Revisited: Fast-Timing Properties in Relation to Spectral State,” Astronomy and Astrophysics, Vol. 297, No. 1, 1995, pp. 141-158.
- W. N. Brandt, A. C. Fabian, T. Dotani, F. Nagase, H. Inoue, T. Kotani and Y. Segawa, “ASCA Observations of the Iron K Complex of Circinus X-1 near Zero Phase: Spectral Evidence for Partial Covering”, Monthly Notices of the Royal Astronomical Society, Vol. 283, No. 3, 1996, pp. 1071-1082.
- R. E. Shirey, H. V. Bradt, A. M. Levine and E. H. Morgan, “Quasi-Periodic Oscillations Associated with Spectral Branches in Rossi X-Ray Timing Explorer Observations of Circinus X-1,” The Astrophysical Journal, Vol. 506, No. 1, 1998, pp. 374-383. doi:10.1086/306247
- R. E. Shirey, H. V. Bradt and A. M. Levine, “The Complete “Z” Track of Circinus X-1,” The Astrophysical Journal, Vol. 517, No. 1, 1999, pp. 472-487. doi:10.1086/307188
- W. N. Brandt and N. S. Schulz, “The Discovery of Broad P Cygni X-Ray Lines from Circinus X-1 with the Chandra High-Energy Transmission Grating Spectrometer,” The Astrophysical Journal, Vol. 544, No. 2, 2000, pp. L123-L127. doi:10.1086/317313
- G. Q. Ding, J. L. Qu and T. P. Li, “Evolution of Hard X-Ray Spectra along the Branches in Circinus X-1,” The Astrophysical Journal, Vol. 596, No.2, 2003, pp. L219- L222. doi:10.1086/379338
- S. Boutloukos, M. van der Klis, D. Altamirano, M. Klein-Wolt, R. Wijnands, P. G. Jonker and R. P. Fender, “Discovery of Twin kHz QPOs in the Peculiar X-Ray Binary Circinus X-1,” The Astrophysical Journal, Vol. 653, No. 2, 2006, pp. 1435-1444. doi:10.1086/508934
- R. Fender, K. Wu, H. Johnston, T. Tzioumis, P. Jonker, R. Spencer and M. van der Klis, “An Ultra-Relativistic Outflow from a Neutron Star Accreting Gas from a Companion,” Nature, Vol. 427, No. 6971, 2004, pp. 222-224. doi:10.1038/nature02137
- S. Heinz, N. S. Schulz, W. N. Brandt and D. K. Galloway, “Evidence of a Parsec-Scale X-Ray Jet from the Accreting Neutron Star Circinus X-1,” The Astrophysical Journal, Vol. 663, No. 2, 2007, pp. L93-L96. doi:10.1086/519950
- D. E. Calvelo, R. P. Fender, A. K. Tzioumis, N. Kawai, J. W. Broderick and M. E. Bell, “Radio Observations of Circinus X-1 over a Complete Orbit at an Historically Faint Epoch,” Monthly Notices of the Royal Astronomical Society, Vol. 419, No. 1, 2012, pp. 436-451. doi:10.1111/j.1365-2966.2011.19708.x
- D. E. Calvelo, R. P. Fender, A. K. Tzioumis and J. W. Broderick, “Millimetre Observations of a Sub-Arcsecond Jet from Circinus X-1,” Monthly Notices of the Royal Astronomical Society: Letters, Vol. 419, No. 1, 2012, pp. L54-L58. doi:10.1111/j.1745-3933.2011.01175.x
- J. C. A. Miller-Jones, A. Moin, S. J. Tingay, C. Reynolds, C. J. Phillips, A. K. Tzioumis, R. P. Fender, N. J. McCallum, G. D. Nicolson and V. Tudose, “The First Resolved Imaging of Milliarcsecond-Scale Jets in Circinus X-1,” Monthly Notices of the Royal Astronomical Society: Letters, Vol. 419, No. 1, 2012, pp. L49-L53. doi:10.1111/j.1745-3933.2011.01176.x
- P. Soleri, S. Heinz, R. A. Fender, R. Wijnands, V. tudose, D. Altamirano. P. G. Jonker, M. van der Klis, L. Kuiper, C. Kaiser and P. Casella, “A Parsec Scale X-Ray Extended Structure from the X-Ray Binary Circinus X-1,” Monthly Notices of the Royal Astronomical Society: Letters, Vol. 397, No. 1, 2009, pp. L1-L5. doi:10.1111/j.1745-3933.2008.00574.x
- P. H. Sell, S. Heinz, D. E. Calvelo, V. Tudose, P. Soleri, R. P. Fender, P. G. Jonker, N. S. Schulz, W. N. Brandt, M. A. Nowak, “Parsec-Scale Bipolar X-Ray Shocks Produced by Powerful Jets from the Neutron Star Circinus X-1,” The Astrophysical Journal, Vol. 719, No. 2, 2010, pp. L194-L198. doi:10.1088/2041-8205/719/2/L194
- N. S. Schulz and W. N. Brandt, “Variability of the X-Ray P Cygni Line Profiles from Circinus X-1 near Zero Phase,” The Astrophysical Journal, Vol. 572, No. 2, 2002, pp. 971-983. doi:10.1086/340369
- G. Török, P. Bakala, E. Šrámková, Z. Stuchlík and M. Urbanec, “On Mass Constraints Implied by the Relativistic Precession Model of Twin-Peak Quasi-Periodic Oscillations in Circinus X-1,” The Astrophysical Journal, Vol. 714, No. 1, 2010, pp. 748-757. doi:10.1088/0004-637X/714/1/748
- A. D’Aì, E. Bozzo, A. Papitto, R. Iaria, T. Di Salvo1 L. Burderi, A. Riggio, E. Egron and N. R. Robba, “A Complete X-Ray Spectral Coverage of the 2010 May-June Outbursts of Circinus X-1,” Astronomy & Astrophysics, Vol. 543, 2012, p. 20. doi:10.1051/0004-6361/201118577
- P. Murdin, D. L. Jauncey, I. Lerche, G. D. Nicolson, L. J. Kaluzienski, S. S. Holt and R. F. Haynes, “Binary Model of Circinus X-1. I—Eccentricity from Combined X-Ray and Radio Observations,” Astronomy and Astrophysics, Vol. 87, No. 3, 1980, pp. 292-298.
- T. M. Tauris, R. P. Fender, E. P. J. van den Heuvel, H. M. Johnston and K. Wu, “Circinus X-1: Survivor of a Highly Asymmetric Supernova,” Monthly Notices of the Royal Astronomical Society, Vol. 310, No. 4, 1999, pp. 1165- 1169. doi:10.1046/j.1365-8711.1999.03068.x
- H. M. Johnston, R. Fender and K. Wu, “High-Resolution Optical and Infrared Spectroscopic Observations of CIR X-1,” Monthly Notices, Vol. 308, No. 2, 1999, pp. 415- 423. doi:10.1046/j.1365-8711.1999.02702.x
- R. Iaria, T. Di Salvo, L. Burderi and N. R. Robba, “Spectral Evolution of Circinus X-1 along Its Orbit,” The Astrophysical Journal, Vol. 561, No. 1, 2001, pp. 321-328. doi:10.1086/323226
- G. Q. Ding, S. N. Zhang, T. P. Li and J. L. Qu, “Evolution of Hard X-Ray Spectra along the Orbital Phase in Circinus X-1,” The Astrophysical Journal, Vol. 645, No. 1, 2006, pp. 576-588. doi:10.1086/504308
- R. E. Shirey, H. V. Bradt, A. M. Levine and E. H. Morgan, “X-Ray Timing and Spectral Evolution of Circinus X-1 versus Orbital Phase with the Rossi X-Ray Timing Explorer,” The Astrophysical Journal, Vol. 469, No. 1, 1996, pp. L21-L24. doi:10.1086/310264
- R. T. Stewart, G. J. Nelson, W. Penninx, S. Kitamoto, S. Miyamoto and G. D. Nicolson, “On the Puzzling Nature of the X-Ray Binary Circinus X-1,” Monthly Notices of the Royal Astronomical Society, Vol. 253, 1991, pp. 212- 216.
- R. Iaria, T. Di salvo, N. R. Robba and L. Burderi, “Study of the Circinus X-1 Broadband Spectrum at Orbital Phases Close to the Apoastron,” The Astrophysical Journal, Vol. 567, No. 1, 2002, pp. 503-509. doi:10.1086/338507
- F. K. Lamb, C. J. Pethick and D. Pines, “A Model for Compact X-Ray Sources: Accretion by Rotating Magnetic Stars,” The Astrophysical Journal, Vol. 184, 1973, pp. 271-290. doi:10.1086/152325
- H. L. Burger and I. J. Katz, “The Eddington Limit and Supercritical Accretion. II—Time-Dependent Calculations,” The Astrophysical Journal, Vol. 265, 1983, pp. 393-401. doi:10.1086/160684
- G. Q. Ding, J. L. Qu and T. P. Li, “Partial Covering during Long-Term Dips in Circinus X-1,” The Astronomical Journal, Vol. 131, No. 3, 2006, pp. 1693-1701. doi:10.1086/499921
- K. Asai, T. Dotani, K. Mitsuda, F. Nagase, Y. Kamado, E. Kuulkers and L. M. Lorraine, “Spectral Variations along the Branches in GX 5-1,” Publications of the Astronomical Society of Japan, Vol. 46, No. 5, 1994, pp. 479-491.
- K. Mitsuda, H. Inoue, K. Koyama, K. Makishima, M. Matsuoka, Y. Ogawara, K. Suzuki, Y. Tanaka, N. Shibazaki and T. Hirano, “Energy Spectra of Low-Mass Binary X-Ray Sources Observed from TENMA,” Publications of the Astronomical Society of Japan, Vol. 36, No. 4, 1984, pp. 741-759.
- D. Lin, R. A. Remillard and J. Homan, “Spectral States of XTE J1701-462: Link Between Z and Atoll Sources,” The Astrophysical Journal, Vol. 696, No. 2, 2009, pp. 1257- 1277. doi:10.1088/0004-637X/696/2/1257
- G. Q. Ding, S. N. Zhang, N. Wang, J. L. Qu and S. P. Yan, “On the Nature of the First Transient Z Source XTE J1701-462: Its Accretion Disk Structure, Neutron Star Magnetic Field Strength, and Hard Tail,” The Astronomical Journal, Vol. 142, No. 2, 2011, pp. 34-51. doi:10.1088/0004-6256/142/2/34
- D. Lin, R. A. Remillard and J. Homan, “Evaluating Spectral Models and the X-Ray States of Neutron Star X-Ray Transients,” The Astrophysical Journal, Vol. 667, No. 2, 2007, pp. 1073-1086. doi:10.1086/521181
- S. N. Zhang, W. Cui and W. Chen, “Black Hole Spin in X-Ray Binaries: Observational Consequences,” The Astronomical Journal, Vol. 482, No. 2, pp. L155-L158. doi:10.1086/310705