Journal of Diabetes Mellitus
Vol. 2 No. 4 (2012) , Article ID: 24767 , 14 pages DOI:10.4236/jdm.2012.24065
Urinary type IV collagen excretion predicts an increased urinary albumin-to-creatinine ratio in normoalbuminuric patients with diabetes*#
![]()
1Division of Nephrology, Endocrinology and Vascular Medicine, Tohoku University Hospital, Sendai, Japan; †Corresponding Author: ogawa-s@hosp.tohoku.ac.jp
2Center for the Advancement of Higher Education, Tohoku University, Sendai, Japan
3Division of Clinical Epidemiology, Jikei University School of Medicine, Tokyo, Japan
4Center for Translational and Advanced Research, Tohoku University Graduate School of Medicine, Sendai, Japan
Received 23 August 2012; revised 22 September 2012; accepted 30 September 2012
Keywords: Type IV Collagen; Diabetic Nephropathy; Oxidative Stress; Monocyte Chemoattractant Protein-1
ABSTRACT
Aims: We evaluated whether urinary excretion of type IV collagen (U-COL) may predict an increase in the urinary albumin-to-creatinine ratio (ACR) and what factors regulate U-COL in 145 normoalbuminuric patients with type 2 diabetes. Methods: We measured HbA1c, systolic blood pressure (SBP), urinary 8-hydroxydeoxyguanosine (8-OHdG) and monocyte chemoattractant protein (MCP)-1 at start of this study (Baseline), ACR and U-COL in addition to these measurements at one year later (Evaluation-1), and ACR and SBP after two years of the Evaluation-1 (Evaluation-2). The relationships were investigated between the increase of ACR and the U-COL. The effect of angiotensin receptor blockers (ARB) treatment on the correlations between U-COL and ACR at Evaluation-2 on one hand, and between U-COL and percent change of ACR on the other, was also analyzed. Furthermore, we investigated whether the increase in 8-OHdG and in MCP-1 in a year prior to the Evaluation-1 were risk factors of the rise in U-COL levels. Results: Both U-COL and SBP at Evaluation-1, but not ARB treatment, were independent risk factors for an increased ACR after 2 years. ARB treatment significantly suppressed the increase in ACR after 2 years in patients with higher U-COL excretion. The percentage changes in 8-OHdG (%8-OHdG) and MCP-1 (%MCP-1) in one year prior to Evaluation-1 measurements are independent risk factors for U-COL. HbA1c and SBP values one year prior to Evaluation-1 are independent risk factors not only for %8-OHdG but also, for baseline U-COL. The %8-OHdG is an independent risk factor for %MCP-1. Conclusions: U-COL may predict an increase in the ACR. The U-COL seems to be increased with oxidative stress and inflammation induced by past hyperglycemia.
1. INTRODUCTION
Preventing the progression of diabetic nephropathy (DN) is a fundamental issue in the treatment of diabetes mellitus (DM) and as in many diseases, early detection and intervention is very important. Urinary albumin excretion measured through the albumin-to-creatinine ratio (ACR) is commonly used as an early-stage marker of nephropathy. However, even at the microalbuminuric stage, functional and morphological alterations of the diabetic kidney have already occurred [1,2]. Therefore, a more sensitive marker for earlier stages of nephropathy would be extremely useful.
Histologically, incipient DN is characterized by thickening of the glomerular basement membrane (GBM) and increases in the mesangial matrix, which both precede the appearance of microalbuminuria [1,2]. Type IV collagen (COL) is the primary component of the GBM and mesangial matrix, and a small amount of COL is exncreted into the urine in healthy subjects, although its main origin is not fully clear [3-6]. Moreover, urinary type IV collagen (U-COL) excretion is less susceptible to physiological changes than urinary albumin (Alb) is [4,7].
Hyperglycemia activates various inflammatory pathnways both directly and via gene transcription to induce oxidative stress (reactive oxygen species: ROS), transforming growth factor (TGF)-β, renin-angiotensin system (RAS), and monocyte chemoattractant protein (MCP)- 1, leading collectively to podocyte injury, malfunction, apoptosis, and protein deposition in extracellular matrix of the nephron with albumin leak [8-10].
The activation of RAS induced by ROS contributes to a further increase of ROS in tubuloglomerular cells, again increasing the ACR [11]. Nevertheless, treatment with angiotensin II receptor blockers (ARBs) is known to suppress the ROS and to decrease both the ACR and U-COL excretion [12]. Based on these facts, we proposed that 1) U-COL value may be used to predict the subsequent development of microalbuminuria in normoalbuminuric patients; 2) an increase of MCP-1 may associate with increase COL production; 3) ROS production leads to U-COL excretion; and that 4) ARB may be effective in preventing the development of albuminuria in normoalbuminuric patients with higher U-COL excretion. These hypotheses were tested in the observational clinical study carried out here.
2. MATERIALS AND METHODS
This observational study was carried out over three years following the protocol shown in Figure 1. All 276 subjects were patients with type 2 diabetes undergoing outpatient treatment at our hospital. Their National Glycohemoglobin Standardization Program (NGSP) Hemoglobin A1c (HbA1c), systolic blood pressure (SBP), urinary 8-hydroxydeoxyguanosine (8-OHdG) and MCP-1 excretions have been measured at Baseline (on enrollment into this study) and one year later (Evaluation-1) [11,12]. The U-COL levels and ACR were measured in all 276 patients at Evaluation-1. In addition, ACR and SBP were measured two years after Evaluation-1 (Evaluation-2). Of the 276 patients, 145 had normoalbuminuria at the Evaluation-1. We focused only on 145 normoalbuminuria patients to examine whether individuals who cannot be evaluated by ACR can be evaluated by U-COL. (Supplementary Figure S1) These 145 normoalbuminuric patients were selected as the analytical subjects in this study (their characteristics at the Evaluation-1 are shown in Table 1) and as some normoalbuminuric patients had high U-COL values (Figure S1(b)), they were divided into two groups: those with high U-COL values (H-COL, n = 39) and those with normal U-COL values (N-COL, n = 106). The benchmark values were set as “U-COL = 4.9 µg/g Cre” for subjects aged 40 or older (n = 132), and “U-COL = 4.0 µg/g Cre” for subjects younger than 40 years old (n = 13). (These benchmark values are as set in commercial ELISA kit used for the measurement). Subjects whose values exceeded these levels were included in the H-COL group.
The correlation between U-COL at Evaluation-1 and ACR at Evaluation-2 was studied. In addition, we employed a multiple regression analysis to identify whether U-COL at Evaluation-1 was an independent risk factor

Figure 1. Protocal of the study. The protocol used in our study is shown in Figure 1. HbA1c, systolic blood pressure (SBP), urinary 8-hydroxydeoxyguanodine (8-OHdG) excretion, and urinary monocyte chemoattractant protein (MCP)-1 excretion were measured at the baseline of the study and after the 1-year (Evaluation-1). At the Evaluation-1, urinary albumin excretion (albumin-to-creatinine ratio: ACR), urinary type IV collagen (U-COL) excretion, HbA1c and SBP were also measured. The ACR and SBP were measured after the 3-year of the Baseline (Evaluation-2). After two years from the Evaluation-1, Evaluation-2 was done.
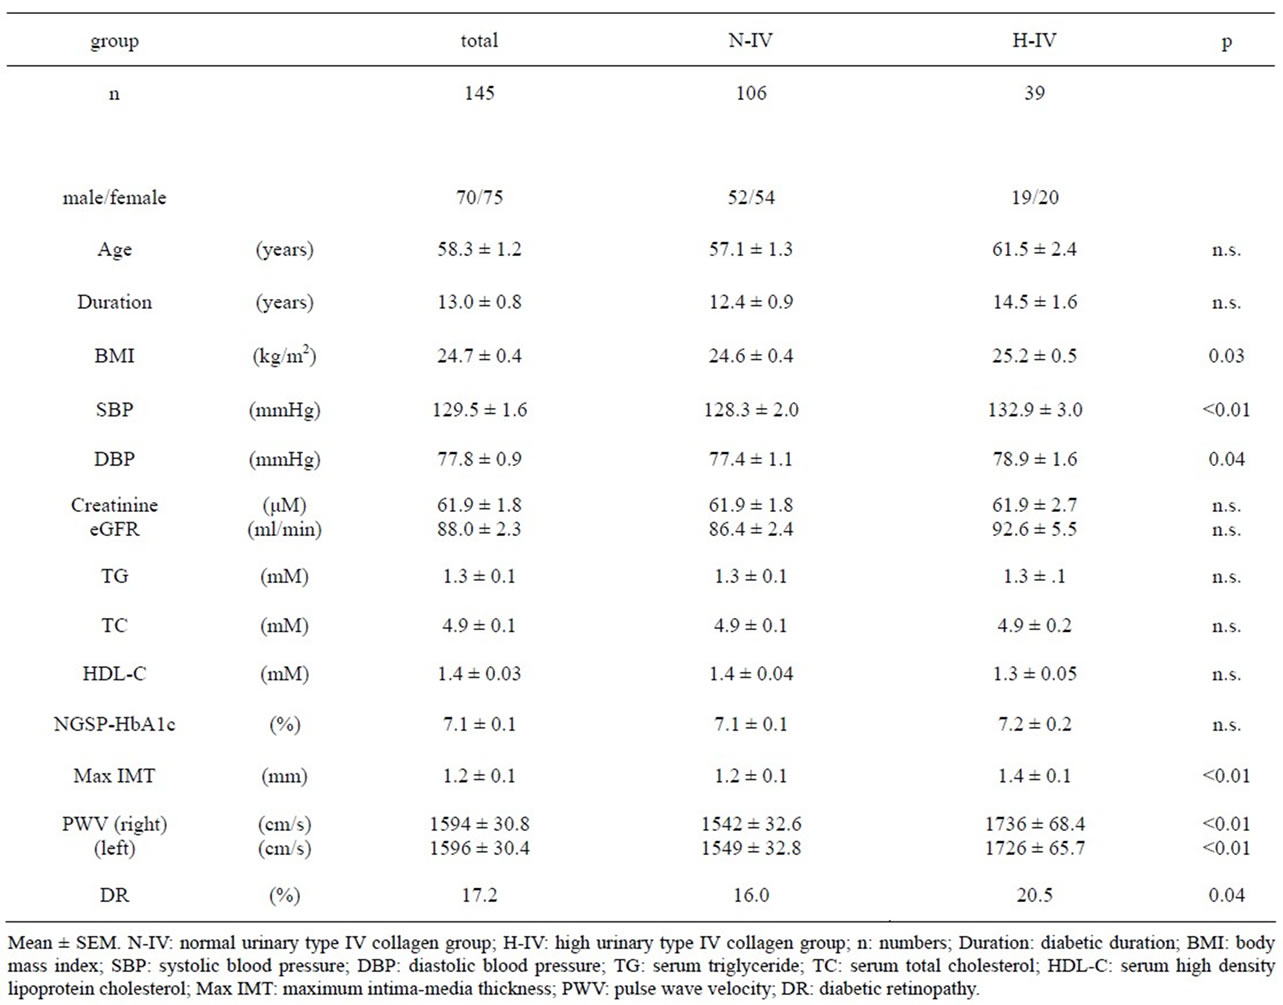
Table 1. Clinical characteristics of the 145 normoalbuminuric study subjects at Evaluation-1.
for 2-year changes from the Evaluation-1 to the ACR (%ACR) at Evaluation-2. Similarly, we studied the effect of SBP at Evaluation-1 or of ARBs on the %ACR. Specifically, multiple regression analyses were performed using U-COL, body mass index (BMI), SBP, HbA1c, intima-media thickness (IMT), pulse wave velocity (PWV), age at Evaluation-1 and ARB administration at Evaluation-2 as independent variables, and the %ACR as the dependent variable. Furthermore, we also tried to clarify Baseline factors that influenced U-COL at Evaluation-1. To clarify our hypotheses, correlations of the U-COL with factors such as the percent changes from Baseline to Evaluation-1 in urinary 8-OHdG excretion (%8-OHdG), in urinary MCP-1 excretion (%MCP-1), and clinical parameters such as BMI, HbA1c and SBP at Baseline or at Evaluation-1 were assessed by single regression analyses. We also examined the correlation between %8-OHdG, %MCP-1 and %ACR, respectively, and these clinical factors. Moreover, multiple regression analyses were performed, using the U-COL value at Evaluation-1, %MCP- 1, and %8-OHdG as dependent or objective variables, and factors such as %8-OHdG, %MCP-1, HbA1c, SBP at Baseline or at Evaluation-1, BMI and diabetic duration at Evaluation-1 as independent variables. The samples during fasting blood and early morning urine were collected. Levels of COL, 8-OHdG and MCP-1 in urine were determined using a Urinary Type IV collagen EIA kit (DAIICHI FINE CHEMICAL CO., LTD., Japan) [13], New 8-OHdG Check ELISA kit (Japan Institute for the Control of Aging, Shizuoka, Japan) and MCP-1 ELISA kit (R&D Systems, Minneapolis, MN), respectively [11, 12]. The PWV was measured using Form PWV/ABI, version 112 (Colin Electronics Co., Ltd., Komaki City, Japan), and IMT, by the ATL Ultramark HDI 5000 Ultrasound System (Bothell, Washington DC). Diabetic retinopathy was diagnosed by the ophthalmology department specialist.
We investigated taking ARBs and calcium channel blockers (CCBs) in all the points. During this observational study, ARBs and CCBs were administered in accordance with the 2004 Japanese Society of Hypertension (JSH) Guidelines.
The present study was carried out in accordance with the Helsinki Declaration and after obtaining the written informed consent from all subjects. The study protocol was approved by the ethics committee of Tohoku University Hospital.
3. STATISTICAL ANALYSES
All statistical analyses were carried out using Statview 5.0 (SAS Institute, Cary, USA) and STATA 11 (StataCorp LP, TX, USA). Measurements that showed a normal distribution are presented as the mean ± standard error of the mean (SEM), and those that did not at some point had their median value (range) noted in addition. To compare the numerical values between the H-COL and N-COL groups (Table 1), we used the Student t-test for parametric values and the Mann-Whitney U-test for non-parametric values. The prevalence rates of diabetic retinopathy (DR) were compared between the two groups using the c2 test. Correlations were determined using Spearman’s rank correlation test. To determine if the gradients of the two lines [ARB (–) or (+)] differed or not, we performed an analysis of covariance (ANOCOVA) and checked if the interaction term was signifycant or not (Table 2). P < 0.05 was regarded as statistically significant.
4. RESULTS
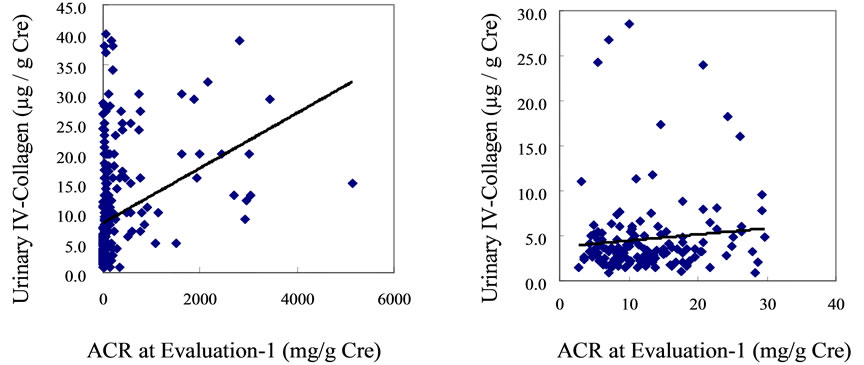
A significant correlation existed between the U-COL value and ACR at Evaluation-1 when all 276 patients with diabetes included in the analysis were studied (r = 0.3354, P = 0.001) (Supplementary Figure S1(a)). However, this correlation disappeared when only the 145 patients with normoalbuminuria were assessed (r = 0.0981, P = 0.652) (Figure S1(b)).
From Baseline to Evaluation-1, 8-OHdG (ng/mg Cre) and MCP-1 (pg/mg Cre) increased from 344 (35.8 - 3170) to 433 (37.9 - 3810) and from 8.1 ± 0.4 to 9.0 ± 0.5 respectively. The value of U-COL (µg/g Cre) was 3.4 (0.9-28.5) at Evaluation-1. From Evaluation-1 to Evaluation-2, ACR (µg/mg Cre) was increased from 11.5 (2.7 - 29.8) to 14.8 (1.2 - 437.6). The value was expressed with mean ± SEM or median (range).
The normoalbuminuric patients were divided into two groups: patients with high and normal U-COL. The patients’ profiles and clinical parameters at Evaluation-1 in this study are shown in Table 1. The H-COL group had significantly greater BMI (P < 0.05), BP (P < 0.01) and IMT (P < 0.05) than in the N-COL group. The prevalence of retinopathy was also significantly higher in the H-COL group (P < 0.05) as was the PWV. When the ACR was followed for two years in the 145 normoalbuminuric patients, 76.8% (30/39) of the H-COL group developed albuminuria (ACR ≥ 30 mg/g Cr) as opposed to 22.6% (24/106) patients in the N-COL group. With respect to anti-hypertensive treatment, none of the patients was undergoing hypotensive treatment at Baseline, at Evaluation-1 46.2% (18/39) of the H-COL group and 3.8% (4/106) of the N-COL group (P < 0.05) were taking ARBs, whereas 18.0% (7/39) of the H-COL group and 18.9% (20/106) of the N-COL group were receiving CCBs. By contrast, at Evaluation-2 66.7% (26/39) of the H-COL group and 5.7% (6/106) of the N-COL group (P < 0.05) were taking ARBs, while 38.5% (15/39) of the

Table 2. Multiple regression analyses, using the percent change in ACR during a 2-year period (from Evaluation-1 to Evaluation-2) as a dependent variable and some parameters at Evaluation-1 as independent variables.
H-COL group and 23.6% (25/106) of the N-COL group were receiving CCBs. Clearly, more patients in the H-COL group took ARBs than in the N-COL group during the study, whereas there were no significant differences in CCBs administered to the two groups. Of the 145 patients, 22 were given ARBs at Evaluation-1 (18 patients in the H-COL group, and 4 patients in the N-COL group). Moreover, 32 patients were given ARBs at Evaluation-2, 10 patients newly started to receive ARBs during a period between Evaluations 1 and 2. (8 patients were in the H-COL group and 2 patients were in the N-COL group). In the H-COL group, no differences in the rate of change of ACR were seen between the 18 patients given ARBs at Evaluation-1 and the 8 patients who began treatment with ARBs from Evaluation-1 to Evaluation-2. There were no subjects of taking angiotensin converting enzyme inhibitors.
At Evaluation-1, BP control was poorer in the H-COL group as 69.2% (27/39) had high BP (SBP ≥ 130 mmHg) as opposed to 46.2% (49/106) of the N-COL group. After patients in the H-COL group received intensive antihypertensive treatment for two years, the two groups displayed similar BP at Evaluation-2: 43.6% (17/39) in the H-COL group and 42.5% (45/106) in the N-COL group had high BP.
Interestingly, the U-COL was significantly correlated with the ACR at Evaluation-2 (r = 0.5785, P < 0.005), as well as with %ACR (r = 0.4585, P = 0.006). (Supplementary Figure S2.) Significant correlations also existed between SBP at Evaluation-1 and U-COL (r = 0.2742, P < 0.05), between SBP and ACR at Evaluation-1 (r = 0.3458, P < 0.05), between SBP at Evaluation-1 and ACR at Evaluation-2 (r = 0.6108, P < 0.01), as well as between SBP at Evaluation-1 and %ACR (r = 0.5259, P < 0.01). (Supplementary Figure S3) The effect of ARB treatment on the correlations between U-COL and ACR at Evaluation-2 on one hand, and between U-COL and %ACR on the other, was also analyzed. The higher the U-COL level is, the greater the effects of the ARBs on ACR suppression at Evaluation-2 [ARB (–); y = 13.803x – 8.2944, r = 0.6460, P < 0.01, ARB (+); y = 4.7133x + 47.33, r = 0.3539, P < 0.05]. (Supplementary Figure S4 panel (a)) The higher the U-COL level the more strongly the %ACR was suppressed by ARB treatment [ARB (–); y = 136.03x – 185.39, r = 0.4874, P < 0.01, ARB (+); y = 50.274x + 317.7, r = 0.3520, P < 0.05] (S4 panel (b)). Such effects of ARB were not evident on the correlations regarding values associated with SBP (such as SBP at Evaluation-1, SBP at Evaluation-2 and %SBP) (S4 panels (c), (d)).
Multiple regression analyses were performed using %ACR as dependent variable and certain parameters as independent variables (U-COL, BMI, SBP, IMT, PWV, HbA1c, age at Evaluation-1, presence/absence of ARB treatment at Evaluation-2, and interaction term of UCOL/ARB treatment: Table 2). Both U-COL and SBP at Evaluation-1 were independent risk factors for %ACR after two years.
Changes from the Baseline to Evaluation-1 value were calculated in some parameters. Urinary MCP-1 and 8-OHdG excretions increased from Baseline to Evaluation-1. Conversely, HbA1c and SBP decreased from Baseline to Evaluation-1 (Supplementary Figure S5).
Correlation coefficients were calculated between each parameter by single regression analysis (Table 3). HbA1c at Baseline, %8-OHdG, SBP at Baseline and at Evaluation-1, and the %MCP-1 were correlated to U-COL. The %MCP-1 was the factor very strongly correlated with UCOL. (Supplementary Figure S6) The HbA1c at Baseline, 8-OHdG at Evaluation-1 and the %8-OHdG were correlated with %MCP-1, of which the %8-OHdG was the factor very strongly correlated to %MCP-1. (Supplementary Figure S7) HbA1c and SBP at Baseline, SBP at Evaluation-1, and %MCP-1 were correlated to % 8-OHdG. (Supplementary Figure S8) SBP (S3 B, C), Urinary 8-OHdG excretion at Evaluation-1, %8-OHdG and %MCP-1 were correlated to %ACR (Supplementary Figure S9).
Multiple regression analyses were carried out using the U-COL, %MCP-1, and %8-OHdG as objective variables and certain parameters as independent variables (Table 4). The multiple regression analyses revealed that %MCP-1, %8-OHdG, SBP at Baseline, and SBP at Evaluation-1 were independent risk factors for U-COL. HbA1c at Baseline and at Evaluation-1, %8-OHdG, and SBP at Evaluation-1 were independent risk factors for %MCP-1. HbA1c and SBP at Baseline, and Diabetic duration were independent risk factors for %8-OHdG. However, HbA1c, SBP, and BMI at Evaluation-1 were not independent risk factors for %8-OHdG.
There was no difference between the value of eGFR of Evaluation-1 (88.0 ± 2.3) and that of Evaluation-2 (87.5 ± 2.3). Moreover, the eGFR had not been changed in either of N-COL (from 86.4 ± 2.4 to 85.7 ± 2.5) or H-COL (from 92.6 ± 5.5 to 92.4 ± 5.4). The decline of eGFR of two years did not correlate to the level of U-COL (r = 0.18, p = 0.37).
5. DISCUSSION
Although an appearance of albuminuria in diabetic patients was traditionally considered to cause primarily glomerular injury, it is now widely accepted that the appearance of albuminuria also correlates with the degree of tubulointerstitial injury [14]. The high level of U-COL in a normoalbuminuric patient indicates that if U-COL is derived from glomerulus, a high U-COL level is likely to indicate a glomerular injury in which albumin leakage
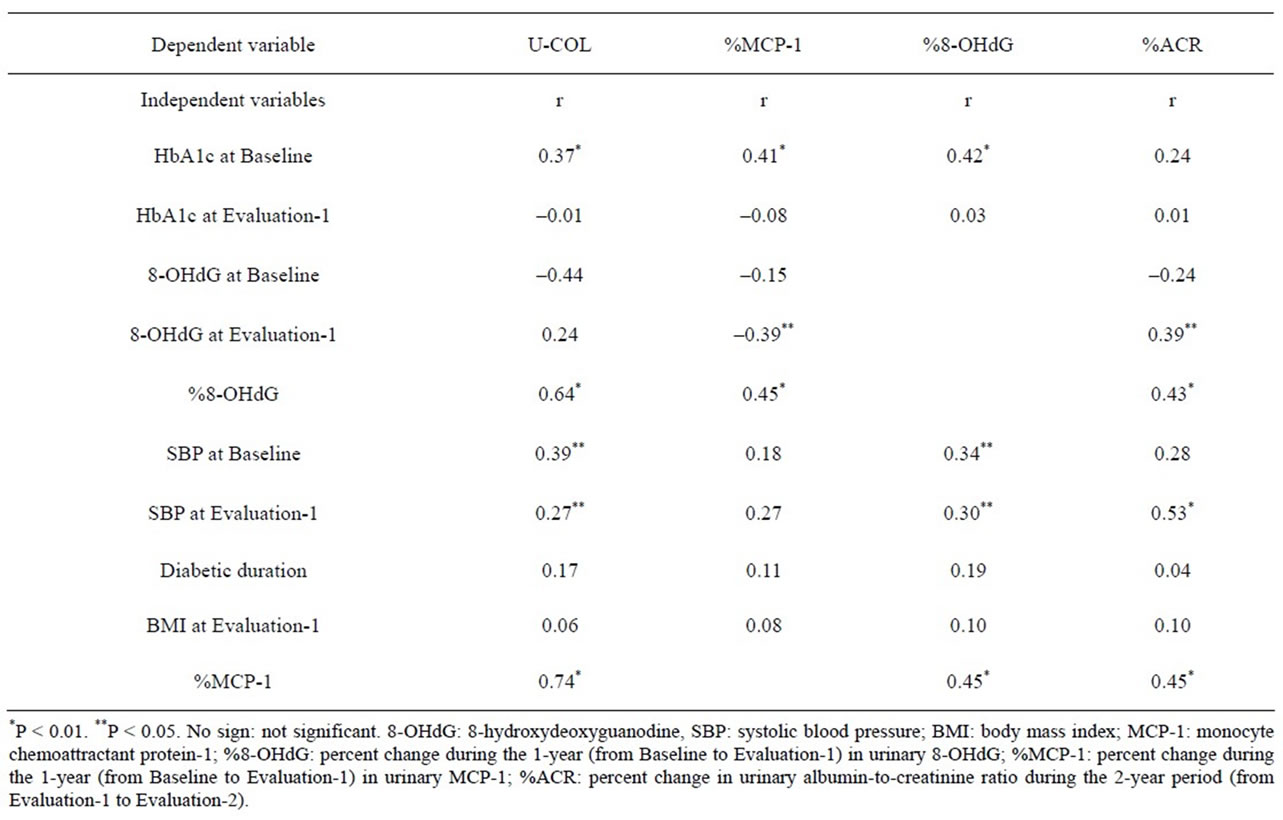
Table 3. Simple correlations of each parameter in this study.
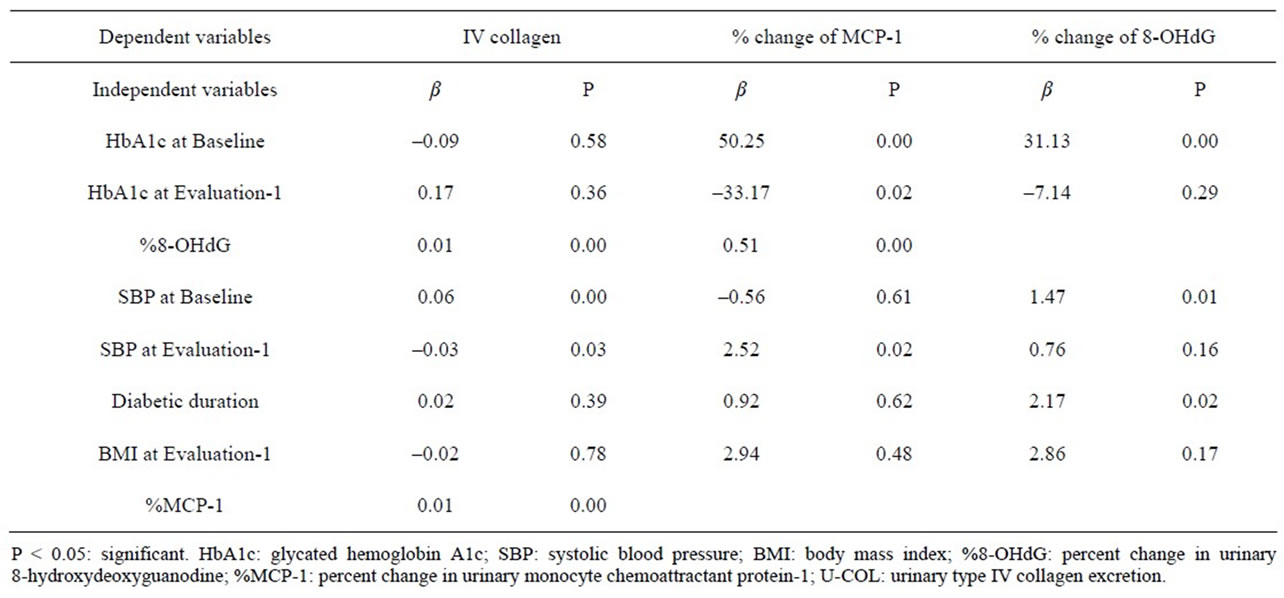
Table 4. Results of multiple regression analyses, using the U-COL at Evaluation-1, %MCP-1, and %8-OHdG as objective variables and some parameters at Baseline or at Evaluation-1 as independent variables.
has already occurred, and albumin is not being excreted because of compensatory renal tubular reabsorption, on the other hand, that if U-COL is derived from the tubulointerstitium, a high level of U-COL indicates a decline in albumin reabsorption due to progression of tubulointerstitial injury. S Araki et al reported that the level of U-COL was correlated with not only BP and ACR but also the level of urinary β2-microglobulin which is a marker of renal tubulointerstitial injury [13-15]. The increase of urinary MCP-1 which is considered to be a marker of renal tubulointerstitial injury is also correlated with the level of U-COL in our study [16]. On the other hand, N Banba et al. reported that hyperglycemia stimulated MCP-1 expression and the facilitated MCP-1 production by glomerular mesangial cells contributes to the initiation and increase of ACR, and urinary MCP-1 actually increased in accordance with the extent of albuminuria [17]. Anyway, it is highly likely that increases in U-COL as well as MCP-1 in normoalbuminuria patients indicate earlier tubuloglomerular disorder, prior to the onset of albuminuria.
Based on our results, it is proposed that U-COL is a useful predictive marker for the development of ACR of normoalbuminuric diabetic nephropathy. However, S Araki et al. reported that the predictive role of U-COL was not shown in the increase of ACR and that the large annual decline in eGFR of patients with increased U-COL was observed regardless of the stage of diabetic nephropathy 13). In our study, the eGFR was not changed during the study period and U-COL did not correlate to the decline rate in the eGFR. The difference in the relation between the U-COL and the decline in eGFR in our study may be explained by differences in the duration of follow-up. Although the period of our study is relatively short (2 years) to estimate the decline rate of the eGFR in normoalbuminuric patients, another studies period was so long (mean 8 years) enough to estimate the decline of eGFR.
It has been reported that SBP influenced the decrease in eGFR in patients with albuminuria, but not in patients with normoalbuminuria [18]. Kotajima et al. reported that U-COL was increased in hypertensive diabetic patients, but did not increase in those without hypertension [19]. Our data showed that SBP was correlated to U-COL by single regression analysis and by multiple regression analyses. An explanation for this relationship remains elusive, but it may suggest the existence of a common pathway leading to kidney injury and to hypertension in patients with high U-COL (e.g., RAS activation) [20].
U-COL levels did not correlate with HbA1c levels in our study. This finding is in agreement with those in previous reports [13,19,21-23]. The results suggest that other factors apart from hyperglycemia contribute to the increase in U-COL. However, U-COL levels correlated with the past 1year increases of 8-OHdG and of MCP-1 which were related with the level of HbA1c at Baseline in our study. Thus, these results suggest that U-COL reflects not only the degree of hypertension-related renal injury but also the degree of hyperglycemia-related renal injury.
A recent study documented that Smad1, which is activated by stimulation of advanced glycation end products (AGEs) as a result of hyperglycemia, regulates the production of COL and also predicted mesangial matrix expansion (MME) [24-27]. There is a close crosstalk in the inductions of MCP-1 and the activation of Smad1-COL pathway [28]. The interaction between MCP-1 and TGFβ- Smad1-COL pathway may contribute to MME and to podocyte injury in DN [29,30]. TGFß signaling induces the podocyte expression of MCP-1 that can then alter albumin permeability characteristics [28]. AGEs induces intrarenal ROS which upregulates the expressions of not only Smad1 but also MCP-1 [31,32]. This may be a mechanism that the increases of MCP-1 and 8-OHdG which were induced by past hyperglycemia closely relate to the high level of U-COL. In high U-COL state, even if albuminuria is not appearing, the increases of ROS and MCP-1 have been already accentuated.
The higher level of U-COL was the larger anti-albuminuric effect of ARB was in our study. In the normoalbuminuric stage, the rise of U-COL levels shows the overactivity of the RAS which progresses from normoalbuminuria to albuminuria [33]. Therefore, RASIs seems to lower the ACR. Indeed, RAS inhibition delays the onset of microalbuminuria in normoalbuminuric diabetic patients with hypertension and normal renal function [34,35]. Recently, it has been reported that a treatment with an ARB could delay or prevent the occurrence of microalbuminuria in normoalbuminuric patients with type 2 diabetes [34]. In our study, U-COL was revealed to be a good predictor for later onset of albuminuria and to be used to monitor the effect of ARB in normoalbuminuric diabetes. Normoalbuminuric patients with diabetes who manifest high levels of U-COL should therefore be actively administered ARBs.
6. LIMITATION
The sample size of our study was relatively small. Unfortunately, we did not evaluate glomerular injury or tubular function in our study, so it is unclear whether U-COL is derived from the glomerulus or from the tubulointerstitium; it also is not correctly known what injury a high U-COL level indicates.
In our study, U-COL was not measured at Evaluation-2 and the changes in U-COL from Evaluation-1 to Evaluation-2 were not evaluated. If we were measuring it, we might have been able to confirm the increase of the U-COL in the subjects with development of albuminuria. Similarly, we did not measure U-COL at the Baseline. If we were measuring it, we might have been able to confirm the increase of the U-COL in the subjects with development of oxidative stress and inflammation.
This is a prospective observational study and therefore, it is not adequate to assess the effects of ARBs. We believe it necessary to carry out a randomized control trial that randomly administers ARBs or CCBs to normoalbuminuric patients with high U-COL values, and which evaluates the changes in ACR and U-COL over an extended period. To identify the clinical significance of U-COL, it is necessary to carry out investigations covering an even longer period up to the development of renal failure.
7. ACKNOWLEDGEMENTS
The Authors acknowledge the editorial assistance and clinical support of Miss Manami Simizu and Miss Mai Sasaki, for their help with preparing the references and for their expert assistance with the management of blood and urinary samples.
8. AUTHOR CONTRIBUTIONS
Susumu Ogawa researched data, wrote manuscript, contributed to discussion and reviewed/edited manuscript.
Masato Matsushima statistically analysed the data.
Kazuhiro Nako, Masashi Okamura, Miho Senda, Takuya Sakamoto and Takefumi Mori researched data and contributed discussion.
Sadayoshi Ito contributed to discussion, reviewed/edited manuscript.
REFERENCES
- Moriya, T., Tanaka, K. and Moriya, R. (2000) Glomerular structural changes and structural-functional relationships at early stage of diabetic nephropathy in Japanese type 2 diabetic patients. Medical Electron Microscopy, 33, 115- 122. doi:10.1007/s007950000010
- Moriya, T., Tanaka, K., Hosaka, T., Hirasawa, Y. and Fujita, Y. (2008) Renal structure as an indicator for development of albuminuria in normoand microalbuminuric type 2 diabetic patients. Diabetes Diabetes Research and Clinical Practice, 82, 298-304. doi:10.1016/j.diabres.2008.08.015
- Ziyadeh, F.N. and Wolf, G. (2008) Pathogenesis of the podocytopathy and proteinuria in diabetic glomerulopathy. Current Diabetes Reviews, 4, 39-45. doi:10.2174/157339908783502370
- Okonogi, H., Nishimura, M., Utsunomiya, Y., Hamaguchi, K., Tsuchida, H., Miura, Y., Suzuki, S., Kawamura, T., Hosoya, T. and Yamada, K. (2001) Urinary type IV collagen excretion reflects renal morphological alterations and type IV collagen expression in patients with type 2 diabetes mellitus. Clinical Nephrology, 55, 357-364.
- Cohen, M.P., Shearman, C.W. and Lautenslager, G.T. (2001) Serum type IV collagen in diabetic patients at risk for nephropathy. Diabetes Care, 24, 1324-1327. doi:10.2337/diacare.24.8.1324
- Cohen, M.P., Lautenslager, G.T. and Shearman, C.W. (2001) Increased urinary type IV collagen marks the development of glomerular pathology in diabetic d/db mice. Metabolism, 50, 1435-1440. doi:10.1053/meta.2001.28074
- Cohen, M.P., Lautenslager, G.T. and Shearman, C.W. (2001) Increased collagen IV excretion in diabetes. A marker of compromised filtration function. Diabetes Care, 24, 914-918. doi:10.2337/diacare.24.5.914
- Elmarakby, A.A. and Sullivan, J.C. (2012) Relationship between oxidative stress and inflammatory cytokines in diabetic nephropathy. Cardiovascular Therapeutics, 30, 49-59. doi:10.1111/j.1755-5922.2010.00218.x
- Wu, J., Mei, C., Vlassara, H., Striker, G.E. and Zheng, F. (2009) Oxidative stress-induced JNK activation contributes to proinflammatory phenotype of aging diabetic mesangial cells. American Journal of Physiology, 297, F1622- F1631. doi:10.1152/ajprenal.00078.2009
- Lee, H.B., Yu, M.R., Yang, Y., Jiang, Z. and Ha, H. (2003) Reactive oxygen species-regulated signaling pathways in diabetic nephropathy. Journal of the American Society of Nephrology, 14, S241-S245. doi:10.1097/01.ASN.0000077410.66390.0F
- Ogawa, S., Kobori, H., Ohashi, N., Urushihara, M., Nishiyama, A., Mori, T., Ishizuka, T., Nako, K. and Ito, S. (2009) Angiotensin II type 1 receptor blockers reduce urinary angiotensinogen excretion and the levels of urinary markers of oxidative stress and inflammation in patients with type 2 diabetic nephropathy. Biomarker Insights, 4, 97-102.
- Ogawa, S., Mori, T., Nako, K., Kato, T., Takeuchi, K. and Ito, S. (2006) Angiotensin II type 1 receptor blockers reduce urinary oxidative stress markers in hypertensive diabetic nephropathy. Hypertension, 47, 699-705. doi:10.1161/01.HYP.0000203826.15076.4b
- Araki, S., Haneda, M., Koya, D., Isshiki, K., Kume, S., Sugimoto, T., Kawai, H., Nishio, Y., Kashiwagi, A., Uzu, T. and Maegawa, H. (2010) Association between urinary type IV collagen level and deterioration of renal function in type 2 diabetic patients without overt proteinuria. Diabetes Care, 33, 1805-1810. doi:10.2337/dc10-0199
- Taft, J.L., Nolan, C.J., Yeung, S.P., Hewitson, T.D. and Martin, F.I. (1994) Clinical and histological correlations of decline in renal function in diabetic patients with proteinuria. Diabetes, 43, 1046-1051. doi:10.2337/diabetes.43.8.1046
- Watanabe, H., Sanada, H., Shigetomi, S., Katoh, T. and Watanabe, T. (2000) Urinary excretion of type IV collagen as a specific indicator of the progression of diabetic nephropathy. Nephron, 86, 27-35. doi:10.1159/000045709
- Morii, T., Fujita, H., Narita, T., Shimotomai, T., Fujishima, H., Yoshioka, N., Imai, H., Kakei, M. and Ito, S. (2003) Association of monocyte chemoattractant protein-1 with renal tubular damage in diabetic nephropathy. Journal of Diabetes and Its Complications, 17, 11-15. doi:10.1016/S1056-8727(02)00176-9
- Banba, N., Nakamura, T., Matsumura, M., Kuroda, H., Hattori, Y. and Kasai, K. (2000) Possible relationship of monocyte chemoattractant protein-1 with diabetic nephropathy. Kidney International, 58, 684-690. doi:10.1046/j.1523-1755.2000.00214.x
- Vlek, A.L., van der, Graaf. Y., Braam, B., Moll, F.L., Nathoe, H.M. and Visseren, F.L., SMART Study Group (2009) Blood pressure and decline in kidney function in patients with atherosclerotic vascular disease: A cohort study. American Journal of Kidney Diseases, 54, 820-829. doi:10.1053/j.ajkd.2009.07.007
- Kotajima, N., Kimura, T., Kanda, T., Obata, K., Kuwabara, A., Fukumura, Y. and Kobayashi, I. (2000) Type IV collagen as an early marker for diabetic nephropathy in non-insulindependent diabetes mellitus. Journal of Diabetes and Its Complications, 14, 13-17. doi:10.1016/S1056-8727(00)00064-7
- Lee, H.S. (2012) Mechanisms and consequences of TGF- ß overexpression by podocytes in progressive podocyte disease. Cell and Tissue Research, 347, 129-140. doi:10.1007/s00441-011-1169-7
- Cohen, M.P., Lautenslager, G.T. and Shearman, C.W. (2001) Increased collagen IV excretion in diabetes. A marker of compromised filtration function. Diabetes Care, 24, 914-918. doi:10.2337/diacare.24.5.914
- Tomino, Y., Suzuki, S., Azushima, C., Shou, I., Iijima, T., Yagame, M., Wang, L.N., Chen, H.C., Lai, K.N., Tan, S.Y. and Kim, M.J. (2001) Asian multicenter trials on urinary type IV collagen in patients with diabetic nephropathy. Journal of Clinical Laboratory Analysis, 15, 188-192. doi:10.1002/jcla.1026
- Kado, S., Aoki, A., Wada, S., Katayama, Y., Kugai, N., Yoshizawa, N. and Nagata, N. (1996) Urinary type IV collagen as a marker for early diabetic nephropathy. Diabetes Research and Clinical Practice, 31, 103-108. doi:10.1016/0168-8227(96)01210-7
- Doi, T., Mima, A., Matsubara, T., Tominaga, T., Arai, H. and Abe, H. (2008) The current clinical problems for early phase of diabetic nephropathy and approach for pathogenesis of diabetic nephropathy. Diabetes Research and Clinical Practice, 82, S21-24. doi:10.1016/j.diabres.2008.09.013
- Mima, A., Arai, H., Matsubara, T., Abe, H., Nagai, K., Tamura, Y., Torikoshi, K., Araki, M., Kanamori, H., Takahashi, T., Tominaga, T., Matsuura, M., Iehara, N., Fukatsu, A., Kita, T. and Doi, T. (2008) Urinary Smad1 is a novel marker to predict later onset of mesangial matrix expansion in diabetic nephropathy. Diabetes, 57, 1712- 1722. doi:10.2337/db07-1726
- Matsubara, T., Abe, H., Arai, H., Nagai, K., Mima, A., Kanamori, H., Sumi, E., Takahashi, T., Matsuura, M., Iehara, N., Fukatsu, A., Kita, T. and Doi, T. (2006) Expression of Smad1 is directly associated with mesangial matrix expansion in rat diabetic nephropathy. Laboratory Investigation, 86, 357-368. doi:10.1038/labinvest.3700400
- Abe, H., Matsubara, T., Iehara, N., Nagai, K., Takahashi, T., Arai, H., Kita, T. and Doi, T. (2004) Type IV collagen is transcriptionally regulated by smad1 under advanced glycation end product (AGE) stimulation. The Journal of Biological Chemistry, 279, 14201-14206. doi:10.1074/jbc.M310427200
- Lee, E.Y., Chung, C.H., Khoury, C.C., Yeo, T.K., Pyagay, P.E., Wang, A. and Chen, S. (2009) The monocyte chemoattractant protein-1/CCR2 loop, inducible by TGF-beta, increases podocyte motility and albumin permeability. American Journal of Physiology—Renal Physiology, 297, F85-F94. doi:10.1152/ajprenal.90642.2008
- Park, J., Ryu, D.R., Li, J.J., Jung, D.S., Kwak, S.J., Lee, S.H., Yoo, T.H., Han, S.H., Lee, J.E., Kim, D.K., Moon, S.J., Kim, K., Han, D.S. and Kang, S.W. (2008) MCP-1/ CCR2 system is involved in high glucose-induced fibronectin and type IV collagen expression in cultured mesangial cells. American Journal of Physiology—Renal Physiology, 295, F749-757. doi:10.1152/ajprenal.00547.2007
- Nam, B.Y., Paeng, J., Kim, S.H., Lee, S.H., Kim, do. H., Kang, H.Y., Li, J.J., Kwak, S.J., Park, J.T., Yoo, T.H., Han, S.H., Kim, D.K. and Kang, S.W. (2012) The MCP-1/ CCR2 axis in podocytes is involved in apoptosis induced by diabetic conditions. Apoptosis, 17, 1-13. doi:10.1007/s10495-011-0661-6
- Lagranha, C.J., Fiorino, P., Casarini, D.E., Schaan, B.D. and Irigoyen, M.C. (2007) Molecular bases of diabetic nephropathy. Arquivos Brasileiros de Endocrinologia & Metabologia, 51, 901-912. doi:10.1590/S0004-27302007000600003
- Sanchez, A.P. and Sharma, K. (2009)Transcription factors in the pathogenesis of diabetic nephropathy. Expert Rev Mol Med, 11, e13. doi:10.1017/S1462399409001057
- Mima, A., Matsubara, T., Arai, H., Abe, H., Nagai, K., Kanamori, H., Sumi, E., Takahashi, T., Iehara, N., Fukatsu, A., Kita, T. and Doi, T. (2006) Angiotensin II-dependent Src and Smad1 signaling pathway is crucial for the development of diabetic nephropathy. Laboratory Investigation, 86, 927-939. doi:10.1038/labinvest.3700445
- Haller, H., Ito, S., Izzo, J.L. Jr., Januszewicz, A., Katayama, S., Menne, J., Mimran, A., Rabelink, T.J., Ritz, E., Ruilope, L.M., Rump, L.C. and Viberti, G., ROADMAP Trial Investigators (2011) Olmesartan for the delay or prevention of microalbuminuria in type 2 diabetes. The New England Journal of Medicine, 364, 907-917. doi:10.1056/NEJMoa1007994
- Ruggenenti, P., Fassi, A., Ilieva, A.P., Bruno, S., Iliev, I.P., Brusegan, V., Rubis, N., Gherardi, G., Arnoldi, F., Ganeva, M., Ene-Iordache, B., Gaspari, F., Perna, A., Bossi, A., Trevisan, R., Dodesini, A.R. and Remuzzi, G., Bergamo Nephrologic Diabetes Complications Trial (BENEDICT) Investigators (2004) Preventing microalbuminuria in type 2 diabetes. The New England Journal of Medicine, 351, 1941-1951. doi:10.1056/NEJMoa042167
(a) (b)
Figure S1. After one year from Baseline (research beginning), we measured urinary albumin excretion (urinary albumin-to-creatinine ratio: ACR) and urinary type IV collagen excretion (U-COL). (Evaluation-1) A significant correlation existed between the U-COL) value and ACR when all 276 patients with diabetes included in the analysis were studied (r = 0.3354, p = 0.001). (Panel (a)) However, this correlation disappeared when only the 145 patients with normoalbuminuria were assessed (r = 0.0981, p = 0.652) (Panel (b)).

(a) (b)
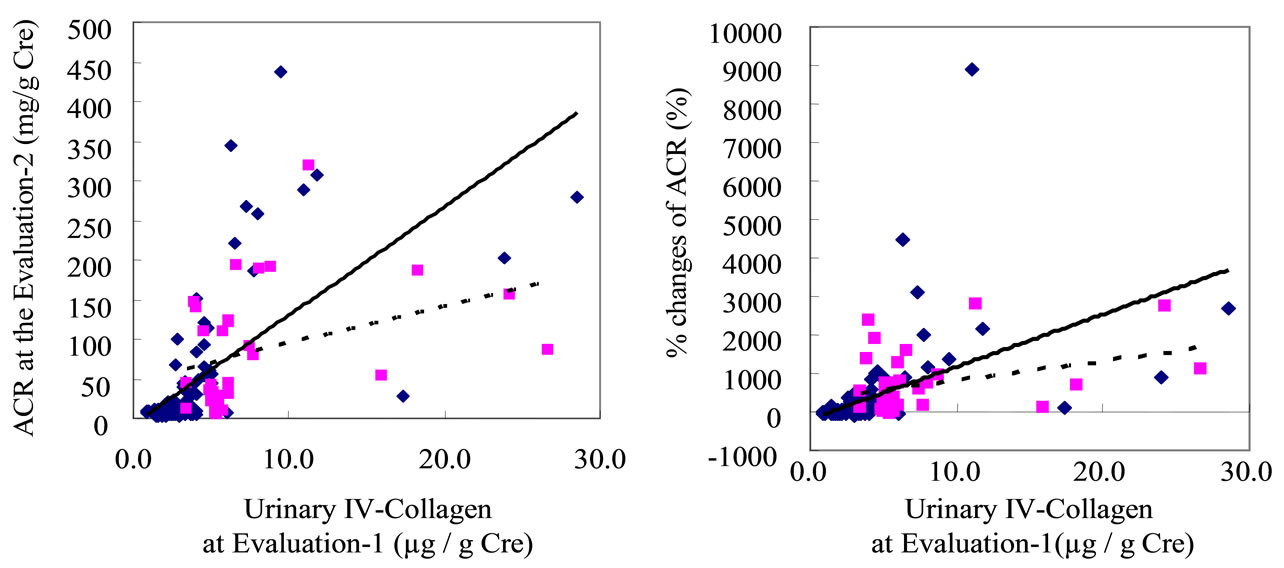
Figure S2. The urinary type IV collagen excretion at Evaluation-1 was significantly correlated with urinary albumin-to-creatinine ratio (ACR) at Evaluation-2 (r = 0.5785, P < 0.005), as well as with %changes of ACR for two years (from Evaluation-1 to Evaluation-2) (r = 0.4585, P = 0.006).


(a) (b) (c)
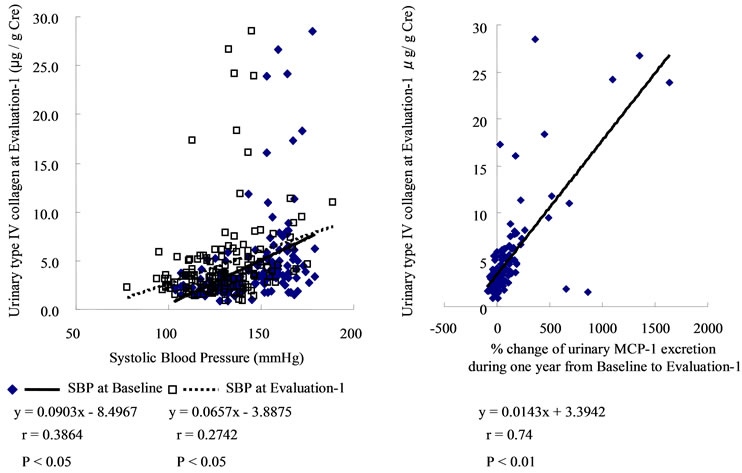
Figure S3. Significant correlations also existed between systolic blood pressure (SBP) at Baseline and at Evaluation-1 in urinary type IV collagen excretion (U-COL) (r = 0.2742, P < 0.05) (shown in the panel (a)), between SBP at Evaluation-1 and urinary albumin-to-creatinine ratio (ACR) at Evaluation-1 (r = 0.3458, P < 0.05) (closed diamonds in the panel (b)), between SBP at Evaluation-1 and ACR at Evaluation-2 (r = 0.6108, P < 0.01) (open squares in the panel (b)), as well as between SBP at Evaluation-1 and % changes of ACR for two years (from Evaluation-1 to Evaluation-2) (r = 0.5259, P < 0.01) (shown in the Panel (c)).

(a) (b) (c) (d)
Figure S4. The effect of angiotensin receptor blocker (ARB) treatment on the correlations between urinary type IV collagen excretion (U-COL) at Evaluation-1) and urinary albumin-to-creatinine ratio (ACR) at Evaluation-2 on one hand, and between U-COL at Evaluation-1 and percent change of ACR for two years (%ACR) (from Evaluation-1 to Evaluation-2) on the other, was also analyzed. The higher the U-COL level at Evaluation-1 is, the greater the effects of the ARBs on ACR suppression at the Evaluation-2 [ARB (–); y = 13.803x – 8.2944, r = 0.6460, P < 0.01, ARB (+); y = 4.7133x + 47.33, r = 0.3539, P < 0.05]. (See Supplementary Figure S4 panel (a).) The higher the U-COL level at Evaluation-1 the more strongly the %ACR was suppressed by ARB treatment [ARB (–); y = 136.03x – 185.39, r = 0.4874, P < 0.01, ARB (+); y = 50.274x + 317.7, r = 0.3520, P < 0.05]. (See Supplementary Figure S4 panel (b)). Such effects of ARB were not evident on the correlations regarding values associated with systolic blood pressure (SBP) (such as SBP at Evaluation-1, SBP at Evaluation-2 and percent change of SBP for two years: %SBP). (See Supplementary Figure S4 panels (c), (d).)

Figure S5. Changes from Baseline to Evaluation-1 value were calculated in some parameters. Urinary monocyte chemoattractant protein (MCP)-1 and 8-hydroxydeoxyguanosine (8-OHdG) excretions increased from the Baseline of the study to Evaluation-1 [MCP-1: from 344 (35.8-3170) to 433 (37.9 - 3810) (pg/mg Cre), 8-OHdG: from 8.1 ± 0.4 to 9.0 ± 0.5 (ng/mg Cre), and systolic blood pressure (SBP) decreased from 145.6 ± 1.6 to mmHg]. Conversely, HbA1c decreased from the Baseline of the study to Evaluation-1 (from 58.0 ± 0.8 to 49.5 ± 0.8 %).

(a) (b) (c) (d)
Figure S6. HbA1c at Baseline ((a), closed diamonds), %8-OHdG, (b) SBP at Baseline ((c), closed diamonds) and at Evaluation-1 ((c), open squares), and the %MCP-1 (d) were correlated to U-COL at Evaluation-1. The %MCP-1 was the factor very strongly correlated with U-COL (d).
(a) (b) (c)
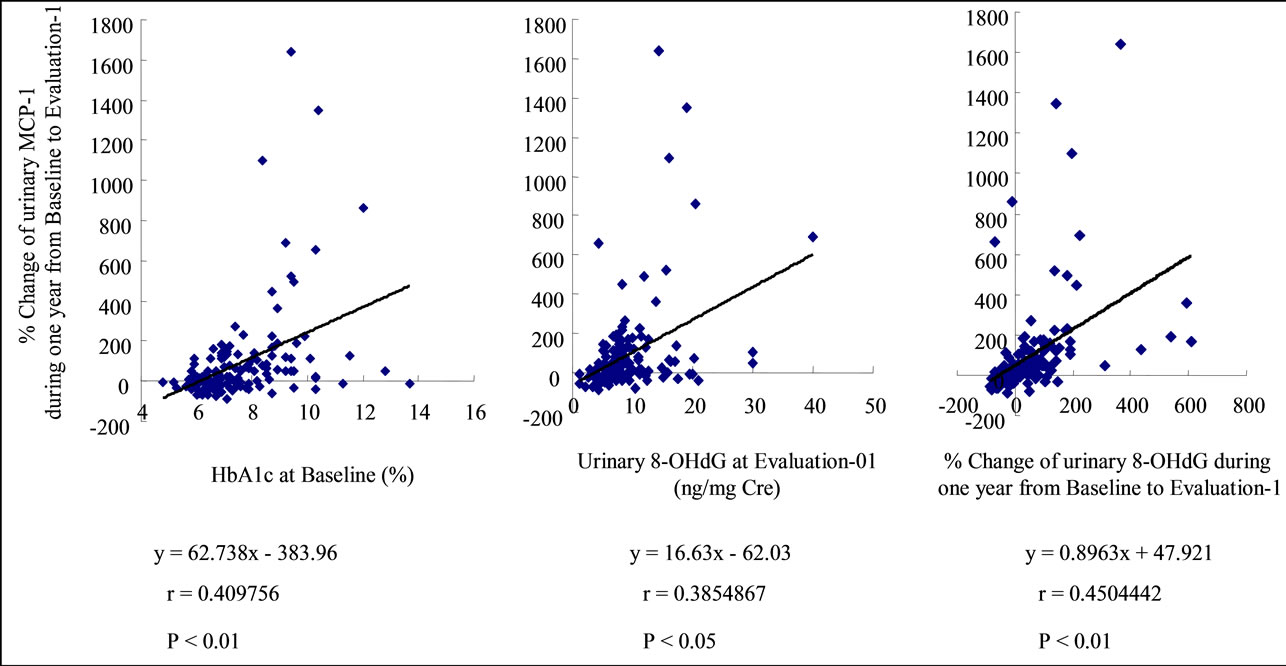
Figure S7. The HbA1c at Baseline (a), 8-OHdG at Evaluation-1 (b) and the %8-OHdG (c) were correlated with %MCP-1, of which the %8-OHdG was the factor very strongly correlated to %MCP-1 (c).

(a) (b)
Figure S8. HbA1c at Baseline ((a), closed diamonds) and SBP at Baseline ((b), closed diamonds), SBP at Evaluation-1 ((b), open squares), and %MCP-1 (S8 (c)) were correlated to % 8-OHdG.

(a) (b) (c)
Figure S9. Urinary 8-OHdG excretion at Evaluation-1 (a), %8-OHdG (b) and %MCP-1 (c) were correlated to %ACR.
NOTES
*Sources of funding: This work was supported by 21st Century Center of Excellence Program Special Research Grant from the Ministry of Education Sports and Culture, a research grant for cardiovascular research (13C-5) from the Japanese Ministry of Health, Labor and Welfare, Longitudinal/Cross-Sectional Studies to Generate Evidence for the Diagnosis/Management of Metabolic Syndrome for Health Guidance, and Longitudinal/Cross-Sectional Studies to Generate Evidence for Diagnosis/Management of Metabolic Syndrome in Governmental Health Check-up and Guidance System.
#Declaration of competing interests: the all authors have no conflicts of interest to disclose.