Journal of Behavioral and Brain Science
Vol. 3 No. 2 (2013) , Article ID: 31849 , 13 pages DOI:10.4236/jbbs.2013.32025
Electrophysiological Evidence against the Magnocellular Deficit Theory in Developmental Dyslexia
Melissa Sue Sayeur1,2*, Renée Béland1,3, Dave Ellemberg1,4, Caroline Perchet5, Michelle McKerral1, Maryse Lassonde1,2, Karyne Lavoie1
1Research Centre in Neuropsychology and Cognition, University of Montreal, Montreal, Canada
2Research Centre, Sainte-Justine Hospital, Montreal, Canada
3School of Speech Pathology and Audiology, University of Montreal, Montreal, Canada
4Department of Kinesiology, University of Montreal, Montreal, Canada
5National Institute of Health and Medical Research, Montreal, France
Email: *melissa.sue.sayeur@umontreal.ca
Copyright © 2013 Melissa Sue Sayeur et al. This is an open access article distributed under the Creative Commons Attribution License, which permits unrestricted use, distribution, and reproduction in any medium, provided the original work is properly cited.
Received January 6, 2013; revised March 19, 2013; accepted May 2, 2013
Keywords: Dyslexia; Magnocellular and Parvocellular Pathways; Visual Evoked Potentials; Contrast Sensitivity; Spatial Frequencies
ABSTRACT
Over the last two decades, the hypothesis of a magnocellular deficit in dyslexia has raised considerable interest and controversy. Using an electrophysiological procedure (visual evoked potentials, VEP), we compared magnocellular and parvocellular contrast and spatial frequency-response functions between phonological dyslexics (n = 16) and a typical reading group (n = 12) matched for age and socioeconomic background. No significant differences were found between the two groups in the amplitude of the VEP components associated with either magnocellular or parvocellular responses. However, topographic analyses revealed a group difference in the distribution of amplitude in the right frontal and left temporal regions, which appeared to be underactivated in dyslexics. These results suggest a deficit in the higher-level cortical regions involved in phonological and/or linguistic processing, and calls into question the notion of a magnocellular involvement in dyslexia.
1. Introduction
A substantial proportion of children (15% - 20%) have a specific reading disability [1,2]. The latest edition of the Diagnostic and Statistical Manual of Mental Disorders (DSM-IV) defines dyslexia as a specific reading disability affecting reading accuracy, reading speed or reading comprehension, despite normal intellectual abilities, sensory functioning (i.e., visual or auditory), socioeconomic, and educational opportunities [3]. Dyslexia is diagnosed if the child is reading significantly below the expected level for the child’s chronological age and general intellect [4].
Much of the recent evidence indicates that dyslexia could result from a deficit in phonological processing. Impaired phonological processing would result from a dysfunction of the neuronal circuits that are responsible for establishing spelling-to-sound correspondences in reading acquisition. Several neuroimaging studies have confirmed this hypothesis by identifying functional disruptions of the neural systems responsible for phonological analysis in dyslexics compared to typical readers (TR) group [2,5]. For example, Breier, Simos, Fletcher et al. [6] found abnormal activation in language areas within the temporal cortex, and Hoeft, Meyler, Hernandez et al. [7] showed reduced activation in the parietal cortex. Furthermore, genetic linkage studies have found a locus on chromosome 2 for the transmission of deficits in phonological awareness and subsequent reading difficulties [8]. Finally, numerous studies have shown that phonological skills in pre-school children are a good predictor of their later reading proficiency [9-15].
In addition to the deficit in phonological processing, a number of studies have suggested that individuals with dyslexia also have anomalies in certain aspects of visual processing: a) poor oculomotor ability during reading, including frequent and longer fixations and shorter saccades; and b) poor ocular convergence and divergence [16]. Since the mid-1970s, it has been persistently argued that an impairment in one of the main neuronal pathways of the visual system, the magnocellular pathway, is at the root of dyslexia [17-20]. A better understanding of the magnocellular deficit hypothesis requires a brief explanation of the role of the magnocellular (M) and parvocellullar (P) systems in vision. The M and P pathways originate from the retina, project to the M and P layers of the lateral geniculate nucleus (LGN), and remain anatomically separate until they reach the primary visual cortex (area V1) [21,22]. At the cortical level, the M and P pathways are also known, respectively, as the dorsal (M) or “where/how” stream, and ventral (P) or “what” stream. The M and P pathways differ in terms of anatomy, physiology, and functionality [23-27]; the dorsal (M) stream is mainly responsible for perceiving rapid motion, localizing objects and targets, and is more sensitive to low contrasts and low spatial frequencies [4,28-31], whereas the ventral (P) stream is mainly responsible for perceiving forms, colours and identifying targets, and is more sensitive to high contrasts and high spatial frequencies [4, 28-31]. Physiological and psychophysical studies have demonstrated that the M and P streams inhibit each other’s activity, and that their contribution is reciprocal [32,33]. To date, the exact implication of the magnocellular pathway in reading has not been fully established; nevertheless, many hypotheses have been proposed. For example, Breitmeyer’s [34,35] visual masking model suggests an increase in visual persistence in dyslexics caused by reduced inhibition of the parvocellular pathway resulting from the putative magnocellular deficit. Alternately, other authors argue that a dysfunctional magnocellular system could reduce visual sensitivity to moving or flickering stimuli [36], and consequently interfere with lexical decision tasks [37] or small letter detection [38]. Although the empirical support for the magnocellular deficit theory of dyslexia is weak, it remains a highly debated issue [38-44].
According to some authors, the magnocellular deficit theory could explain the phonological deficit in dyslexics [45]. The implication of this theory is that individuals with impaired phonological processing would exhibit processing deficits across all sensory modalities, including vision and audition. To illustrate, a child having difficulty processing these critical, rapid auditory changes could be further unable to distinguish /b/ and /d/ or to learn the grapheme-phoneme correspondence involved in early reading. The findings of several studies using different approaches have supported the magnocellular deficit theory of dyslexia. In anatomical studies, for example, brain autopsies of adults who had dyslexia revealed anomalies in the magnocellular layers of the LGN, although the parvocellular layers were intact [39]. In addition, anatomical evidence indicates that the cells in the M layers of the LGN are smaller and more disorganized compared to those in a control group [46,47]. Furthermore, functional brain imaging has demonstrated that, compared to good readers, dyslexics show underactivation in some regions of the dorsal stream (MT or V5) that respond to motion [48-50].
Both psychophysical and visual evoked potential (VEP) studies have provided some evidence for deficits in the magnocellular system in dyslexia. Specifically, psychophysical studies report reduced sensitivity to stimuli that contain lower spatial frequencies and/or higher temporal frequencies [38,41,45,50-52], and VEP studies have shown that, compared to good readers, dyslexics present reduced amplitude and/or increased latency of the P1 and/or the N2 components when presented with stimuli designed to elicit a magnocellular response [39,53-57]. Finally, dyslexic individuals showed increased latency and reduced amplitude over the occipital and parietotemporal cortex, as measured by motion-onset VEPs [54,58]. However, it is important to note that the specific pattern of results varies widely across studies due to differences in subjects’ age or experimental design or to comorbid disorders such as ADHD.
In fact, few VEP studies have used optimal stimuli to dissociate the M and P pathway responses. For example, most studies used checkerboard patterns to activate responses from a wide range of spatial frequency mechanisms that are not restricted to the magnocellular pathway [39,59-61]. Moreover, the majority of studies based their conclusions on inductive reasoning, either because they used stimulus conditions that tested only one pathway (either M or P), or they used paradigms constructed from a theoretical rationale based on animal studies that have not been validated in humans. Finally, the studies that did investigate both the M and P pathway responses used different paradigms to do so, which limits comparison and consequently data interpretation [62].
A study by Ellemberg et al. [63] used VEPs to identify and isolate characteristic responses of the M and P pathways in human adults. Specifically, using vertical sinusoidal gratings, they found that at the lowest spatial frequencies (< 2c/deg), the waveform was composed of the P1 component only. This component had the characteristic M contrast response: it appeared at the lowest contrast level used (2%), and its amplitude rapidly saturated to reach asymptote at about 12% contrast. At higher spatial frequency, a second component appeared, the N1, which had the characteristics of the P contrast response; that is, it appeared at higher contrasts (about 10% - 20%), dominated at the highest spatial frequency, and appeared not to saturate in amplitude. Because of the distinct contrast responses of the P1 and N1 components, the VEPs were also able to dissociate the contribution of the M and P streams at intermediate spatial frequencies. This was the first human study to confirm that the two systems operate over a spatial frequency continuum, and that they can be dissociated using a single stimulus (an intermediate spatial frequency at medium contrasts).
The goal of the present study was to verify the hypothesis of a magnocellular deficit in developmental dyslexia using a paradigm that provides a more direct measurement and comparison of the M and P responses, which has been validated in adults and young children [28,29,63].
2. Materials and Methods
2.1. Subjects
16 dyslexic children and 12 typical readers participated in the study. The mother tongue of all participants was French. Each child was assessed by an optometrist, and all had normal or corrected-to-normal visual acuity with no history of visual disorders. All children scored a full scale IQ above 90 on the Wechsler Intelligence Scale for Children—3rd Edition (WISC-III, Table 1) and they all underwent reading and phonological tasks to assess their reading and phonological abilities (Table 2). The procedures were explained and informed consent was obtained from the parents. The experimental protocol was approved by the Research Ethics Board of the University of Montreal.
The dyslexic group consisted of 13 boys and 3 girls, aged 8.5 to 13.5 years (mean age: 10.88 years ± 1.49 years). Inclusion criteria’s were: a two-year delay in reading acquisition and the absence of neurological, auditory, visual, and psychiatric disorders. In addition, all children had dyslexia of the phonological type, as indicated by their poor results on tasks assessing reading and phonological abilities. The typical reading (TR) development group consisted of 12 children, 9 boys and 3 girls, aged 9 to 12 years (mean age: 10.6 years ± 1.09 years). All children had normal reading abilities. None had a history of language delay, neurological, auditory, visual, psychiatric disorders, or learning disabilities.
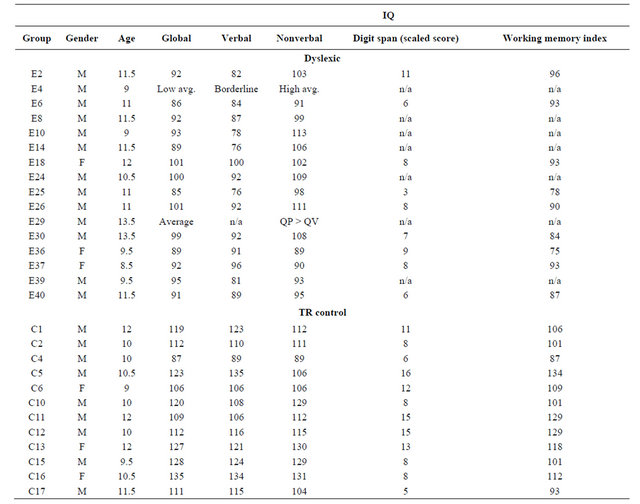
Table 1. Results obtained at the Wechsler Intelligence Scale for Children—3rd Edition (WISC-III) for each subject.
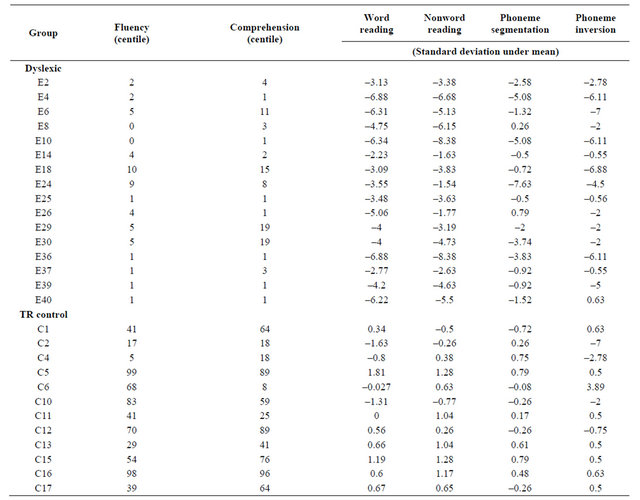
Table 2. Results on tasks to assess reading and phonological abilities for each subject.
2.2. Reading and Phonological Tasks
A French reading test, created by the Research Institute and Psychopedagogy Evaluation (IREP), comprised two timed tasks: one assessing reading fluency and one assessing reading comprehension. In the reading fluency condition, which lasted 8 minutes, the child was asked to read a series of short paragraphs. For each paragraph, the child was required to cross out the word that contradicted the meaning of the paragraph. In the comprehension component, the child answered a series of multiple-choice questions, trying to answer as many questions as possible in 10 minutes. Phonological awareness was assessed using tasks involving both phonological sensitivity (rhyme judgement, auditory discrimination task) and metaphonological awareness (nonword repetition, rhyme production, synthesis, segmentation, and inversion). All tasks were preceded by practice items where the children received feedback on their performance.
2.3. Stimuli and Apparatus
The stimuli consisted of vertical sinusoidal gratings 18˚ wide and 18˚ high when viewed from a distance of 114 cm. Four levels of contrast (4, 16, 32, and 90%) were presented at a spatial frequency of 4.0 c/deg, and four spatial frequencies (2.0, 4.0, 8.0, and 16 c/deg) were presented at 16% contrast. These values were chosen because they were shown to best represent the characteristic M and P contrast and spatial frequency response functions by Ellemberg et al. [63]. The strongest M response was expected in the 4 c/deg/4% condition, whereas the strongest P response was expected at 16 c/deg/16%. Contrast levels were established using the Michelson contrast formula [64].
The stimuli were generated by a Power Macintosh computer using Pixx software and displayed on a 21-inch View Sonic monitor at a frame rate of 75 Hz and a pixel resolution of 1024 × 768. VEPs were recorded with Sa Instruments bioamplifiers and data were filtered and averaged using InStep (version IV). The average luminance of the stimuli was maintained at 35 cd·m−2 and the ambient luminance was 8 cd·m–2.
2.4. Procedure
The children viewed the screen binocularly from a distance of 114 cm. They were instructed to fixate on a small cross (0.25˚) positioned at the centre of the display. Each grating phase was reversed at a temporal frequency of 1 Hz (2 reversals/sec), for a total of 190 reversals. The order of presentation was randomized across children to control for effects of habituation and/or fatigue. An experimental session, including electrode placement and the administration of the seven conditions, lasted about one hour.
2.5. Recording
Cortical responses were recorded from the following leads: Fp1, Fp2, Af3, Af4, F7, F3, Fz, F4, F8, FC3, FC4, C3, C1, Cz, C2, C4, CP3, CP4, Tp7, Tp8, T7, T8, P3, P4, P7, P8, Pz, O1, O2, Oz (as defined by the international 10 - 20 system), with reference to linked earlobes. Tin electrodes were placed on the scalp with an ElectroCap™. Electrode impedance was kept below 5 khoms. Digital recording rate was 256 Hz and a 0.02 - 30 Hz analog bandpass was applied.
2.6. Data Analysis
Following a commonly used and well accepted convention [62,63], the N1 peak was defined as the point where amplitude was the lowest between 50 and 90 ms, and the P1 peak as the point where amplitude was the highest between 80 and 140 ms. N1 and P1 amplitudes were measured relative to baseline, which was calculated from the average amplitude of the first 30 ms after the onset of averaging [62,63,65,66]. For the statistical analysis, analyses of variance (ANOVAs) were run on the amplitude data, separately for each waveform P1 and N1 and separately for contrast and spatial frequency.
2.7. Topographic Analysis
We completed a topographic analysis on the VEP signals by identifying the maximum amplitude of the peak at Oz and calculating the response on all leads for each child. For statistical comparison, data were analyzed using StatMap for topographical analysis (DigiMed Systems Inc.) and a McCarthy-Wood correction was run to normalize the results.
3. Results
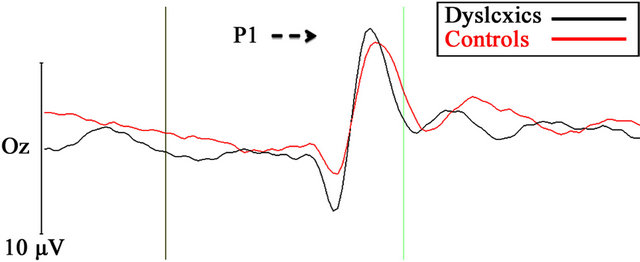
Figure 1 presents the average waveforms for the dyslexic and TR groups for the optimal M condition (1a) and the P condition (1b).
Figure 2(a) presents the contrast response functions of the P1 and N1 waveforms for both the dyslexic and TR groups from Oz, the occipital lead. Amplitude in microvolts is presented on the y-axis and contrast is on the xaxis. Figure 2(b) presents a similar contrast response function for adults, reprinted from Ellemberg et al. [63].
First, contrast responses for P1 and N1 in both groups correspond to those found in adults. Specifically, the P1 shows the expected M contrast response: it is present at low contrasts, increases rapidly in amplitude with increasing contrast, and saturates at medium contrasts. The N1 component shows the expected P contrast response: it appears at medium to high contrasts, increases linearly in amplitude with increasing contrast, and does not appear to saturate. This pattern of results indicates that our method allows us to dissociate M and P activity in children, and that overall, the children’s response functions are very similar to those reported in adults [63].
Analysis of the P1 amplitude data yielded no significant Group by Contrast interaction (F (1,27) = 0.367, p > 0.05), Group effect (F (1,27) = 0.667, p > 0.05), or Contrast effect (F (1,27) = 1.564, p > 0.05). Figure 2 shows that the amplitude of components for the dyslexic and TR groups almost overlap for all but one contrast, at 16%, for which the dyslexic group shows greater amplitude than the TR group.
Similar results were found for the N1 amplitude data: the ANOVA revealed no significant Group by Contrast interaction (F (1,27) = 1.205, p > 0.05) or Group effect (F
 (a)
(a)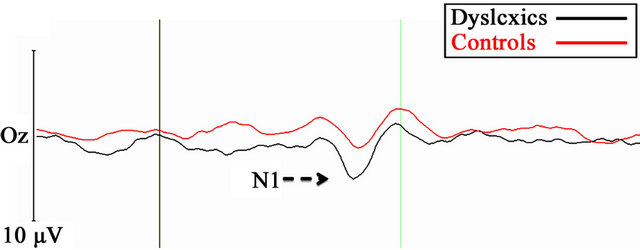 (b)
(b)
Figure 1. Grand average VEPs under the 4 c/deg/4% (A, optimal magnocellular condition), and 16 c/deg/16% (B, optimal parvocellular) stimulus conditions at Oz position for dyslexic (red) and TR control children (black).
 (a)
(a)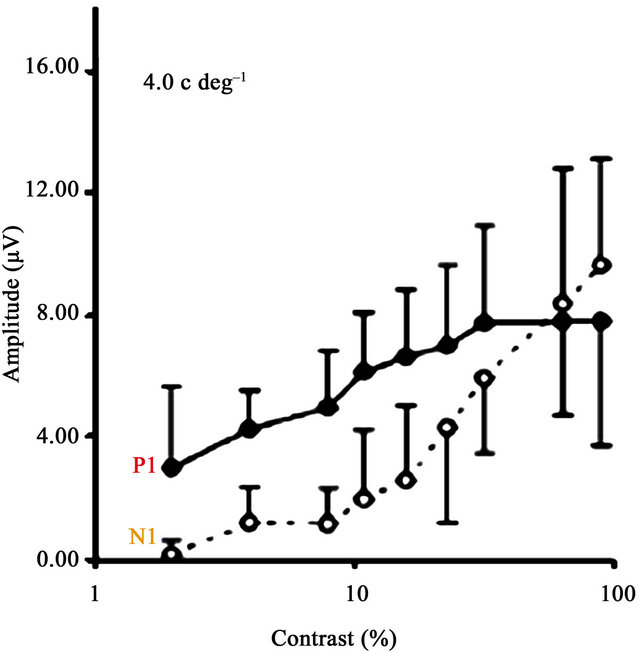 (b)
(b)
Figure 2. Mean amplitude of P1 and N1 for dyslexic (black) and TR control (blue) children as a function of contrast (a). Figure 2(b) presents a similar contrast response function for adults, reprinted from Ellemberg et al. (2001). Amplitude in microvolts is shown on the y-axis and spatial frequency is on the x-axis (logarithmical).
(1,27) = 0.638, p > 0.05). However, as expected, results revealed a significant Contrast effect (F (1,27) = 31.194, p < 0.05, partial n2 = 0.53). Here again, Figure 2 shows that the results for the dyslexic and TR groups almost overlap for two of the contrasts, and that at both the third (i.e. 32%) and fourth (i.e. 90%) contrast, the dyslexic group shows slightly higher amplitude than the TR group.
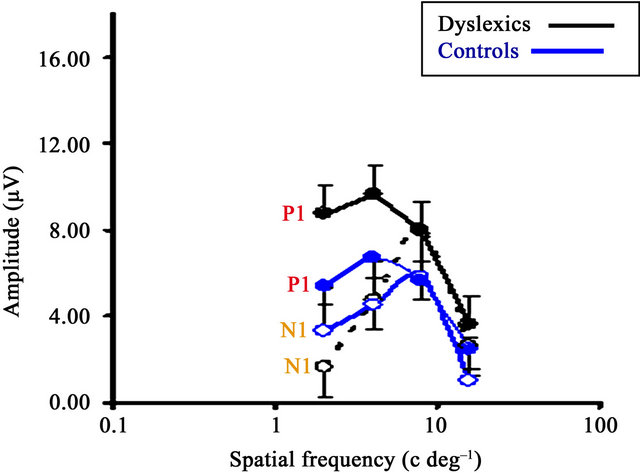
Figure 3(a) presents the spatial frequency response functions of the P1 and N1 waveforms for both the dyslexic and TR groups, taken from the occipital lead Oz.
Figure 3(b) shows the spatial frequency response functions obtained from dyslexic and TR children, and from adults, reprinted from Ellemberg et al. [63]. Spatial frequency response functions for P1 and N1 for both the dyslexic and TR groups are similar to those found in adults. The amplitude of the P1 component is almost equal at all but the highest spatial frequency. The amplitude of the N1 component peaks at intermediate spatial frequencies and declines sharply at both lower and higher spatial frequencies. These results provide further support for the dissociation of M and P activity in both groups of children.
 (a)
(a)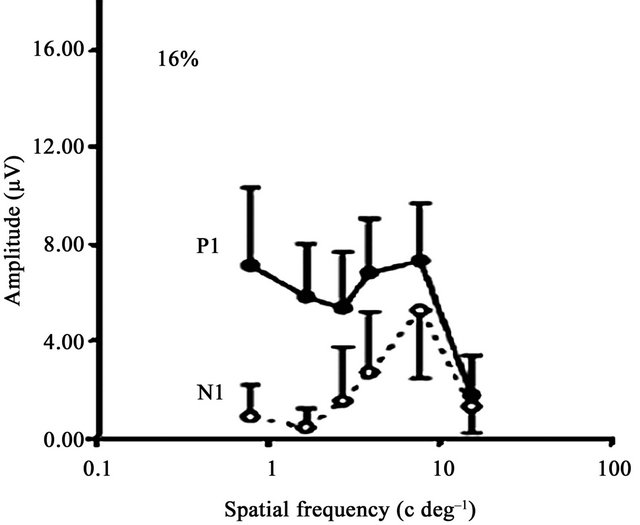 (b)
(b)
Figure 3. Mean amplitude of P1 and N1 for dyslexic (black) and TR control (blue) children as a function of spatial frequency (a). Figure 3(b) presents similar spatial frequency response data for adults, reprinted from Ellemberg et al. (2001). Amplitude in microvolts is presented on the y-axis and spatial frequency is on the x-axis (logarithmical).
For P1, the analysis revealed no significant Group by Spatial frequency interaction (F (1,18) = 0.676, p > 0.05) or main Group effect (F (1,18) = 9.736, p = 0.06), although dyslexics tended to show higher amplitudes than TRs. A main Spatial Frequency effect was found (F (1,18) = 19.463, p = 0.0001, partial n2 = 0.52), which is consistent with the well known fact that the human visual system is differentially sensitive to different spatial frequencies.
The analysis of N1 amplitude data revealed no significant Group by Spatial frequency interaction (F (1,18) = 4.146, p > 0.05), main Group effect (F (1,18) = 2.212, p > 0.05), or Spatial frequency effect (F (1,18) = 0.240, p > 0.05). Figure 3(a) shows that N1 amplitude for dyslexics is slightly lower at the 2.0 c/deg than for TRs, about the same at 4.0 c/deg, and slightly higher at the two highest spatial frequencies. Overall, as revealed by large error bars, substantial variability was found at all four contrasts, a typical electrophysiological finding, especially in children.
Finally, statistical analyses revealed no significant Group differences in latency, either for P1 or N1 waveforms, and regardless of contrast or spatial frequency. Hence, for P1, there was no significant Group by Spatial frequency interaction (F (1,18) = 1.161, p = 0.326) or Group effect (F (1,18) = 0.769, p = 0.392). Similarly, for N1, no significant Group by Spatial frequency interaction (F (1,18) = 1.358, p = 0.270) or group effect (F (1,18) = 3.816, p = 0.066) was found.
Although we found no evidence of lower amplitude of the P1 or N1 component in dyslexics (in fact, it tended to be higher in the optimal M condition), the topographic analysis enabled assessing differences in the distribution of activation between the dyslexic and TR groups. Figure 4 presents the topographic distribution and statistical analysis of the P1 waveform (showing the characteristic M response function) for the 4 c/deg grating at 4% contrast, the condition in which we expected the strongest M response.
A global analysis was performed on all electrodes. Under the 4% contrast condition, we found a significant reduction in P1 distribution for dyslexics compared to TRs, located mainly in the right frontal region (p < 0.05). Figure 5 presents the topographic distribution and statistical analysis of the N1 waveform for the 16 c/deg grating at 16% contrast, the condition in which we expected the strongest P response.
Figure 5 reveals a significant reduction in the amplitude distribution of N1 for dyslexics compared to TRs, located mainly in the left temporal region (p < 0.05). In fact, topographic analyses for all but two conditions (4 c/deg/90% and 4 c/deg/16%; not shown) reveal a significant reduction in the amplitude distribution of P1 and N1 for dyslexics compared to TRs in both the frontal and temporal brain regions.

Figure 4. Scalp distribution of the P1 component. Top images: topographical maps of the mean voltage amplitude (uV) in TR controls (left) and dyslexics (right). The leftmost bar chart represents positive activation, graduated from red (highest) to black (least). Middle image: scalp distribution differences (t-statistic) between groups illustrated by a graduated colour code corresponding to the middle bar chart. Lower image: probability that differences between scalp positions differ between the two groups. Corresponding p-values are presented as a graduated colour code corresponding to the rightmost bar chart.
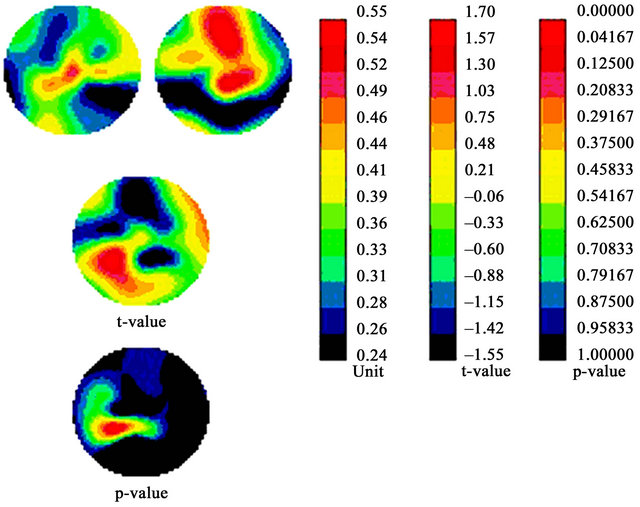
Figure 5. Scalp distribution of the N1 component. Top images: topographical maps of the normalized mean voltage amplitude (uV) in TR controls (left) and dyslexics (right). The leftmost bar chart represents activation, graduated from red (highest) to black (least). Middle image: scalp distribution differences (t-statistic) between groups illustrated by a graduated colour code corresponding to the middle bar chart. Lower image: probability that differences between scalp positions differ between the two groups. Corresponding p-values are presented as a graduated colour code corresponding to the rightmost bar chart.
4. Discussion
The main objective of this study was to verify the hypothesis of a magnocellular deficit in developmental dyslexia. Using VEP (transient visual evoked potential) recording, we dissociated the activity of the M and P pathways. Specifically, and consistent with previous results in adults using the same methodology [63], we identified contrast and spatial frequency-specific M and P optimal responses in both subject groups (dyslexic and typical reader—TR). Although we cannot draw conclusions about the developmental mechanisms involved due to the wide age range of the participants (8 to 13 years), we found that the Mand P-like amplitude response functions of these two groups of children are shaped similarly to those of adults.
Our findings do not support the hypothesis of a magnocellular deficit in the visual system of children with developmental dyslexia. Following analysis of the results from the centro-occipital recording site (Oz), the approximate region where the M and P pathways reach the cortex, we found that the amplitude response functions of the dyslexic group were no weaker than those of the TR group, for both the M and P response functions. In fact, the amplitude of the spatial frequency response function of the P1 peak, which displays the optimal M-like response, tended to be higher for dyslexics than for TRs. Overall, these results are consistent with those of Kronbichler, Hutzler & Wimmer [67], who found similar or even better performance in a dyslexic compared to a TR group on a coherent motion detection task and illusory sound movement perception task. Victor, Conte, Burton et al. [68] also failed to find a difference in amplitude or phase measurements between a dyslexic and a TR group using transient (preferentially activating the M pathway) and steady-state (preferentially activating the parvocellular pathway) contrast-reversal VEPs. Another study by Johannes, Kussmaul et al. [69] found no difference between dyslexics and controls using checkerboard pattern reversal VEPs at a wide range of contrasts and temporal frequencies that preferentially elicited M versus P responses. Moreover, these studies found similar response variability in dyslexics and controls. Several other studies found no evidence for a magnocellular deficit in developmental dyslexia [70-73].
In fact, psychophysical studies that do not support the magnocellular deficit theory are more numerous than those that support it [41]. Moreover, it appears that as many TR groups as dyslexics show a magnocellular deficit [44]. Furthermore, several authors have argued, with supporting evidence, that at least part of the visual deficits measured can be explained by other dyslexiarelated disabilities, such as an attention deficit disorder [74], anxiety disorder [75], or depression [76], including studies that used psychophysical measures [71,77] and evoked potential paradigms [78], even in the auditory modality [67]. In addition, Ramus [79] reinterpreted neurobiological data to argue that a sensorimotor syndrome, of which a magnocellular deficit is an example, may be associated with, but is not essential to, the development of dyslexia. According to this author, this deficit is present in only a subgroup of people and is accessory to the basic underlying cause of the reading problem, namely phonological deficits.
Although we did not find support for a magnocellular deficit, the results of the topographical analysis revealed a different pattern of amplitude distribution between the right frontal and left temporal regions of the cortex for dyslexic readers compared to typical readers. Lovegrove [80] and Johannes et al. [69] proposed the hypothesis of possible early visual deficits in dyslexia that are unrelated to an M or P dysfunction. This would explain some of the visual deficits associated with dyslexia. Although we cannot rule out this possibility, our results do not support this hypothesis, given that we found no anomalies in the cortical regions typically associated with early visual processing. In fact, the frontal and temporal regions found to be underactivated in our group of dyslexic children are not known to be visual areas sensitive to the luminance modulated sine-wave gratings used. During such low sensory stimulation paradigms, areas outside the main visual centres are hypothesized to be activated through a chain reaction of neuronal activation.
Although topographical maps do not necessarily reflect the underlying activity of the cortical regions being recorded, it is interesting to note that the areas that show a reduced amplitude response correspond closely to those identified by Shaywitz et al. [81]. Specifically, using functional magnetic resonance imaging (fMRI) and a phonological analysis task, these authors found that children with dyslexia demonstrated significant underactivation in the left superior temporal and parietotemporal regions and in the right inferior frontal gyrus. Meyler et al. [82] also found parietotemporal underactivation in poor readers compared to TR children, and Cao et al. [83] showed lower activation in the right inferior frontal gyrus in children with dyslexia. In fact, these data are consistent with fMRI reports showing that the left hemisphere posterior brain regions failed to function properly during reading [84-86].
To conclude, the results of the present study do not support the magnocellular deficit hypothesis in developmental dyslexia. On the other hand, although further research using source localization analysis is needed, our findings are consistent with the underactivation of higher-order brain regions typically involved in reading and phonological processing in individuals with phonological dyslexia.
5. Acknowledgements
This work was supported by the Canadian Institutes of Health Research and the Fonds de la Recherche en Santé du Quebec (postgraduate scholarships to Lavoie and Sayeur), the Fonds de la Recherche en Santé du Quebec— INSERM collaboration program (Postdoctoral fellowship to Perchet), and the Québec Fonds pour la Formation de chercheure et l’aide à la Recherche (Béland and Lassonde). We wish to thank Manon Robert and Nathalie Bouloute for their help in collecting and analyzing the data.
REFERENCES
- American Psychiatric Association, “Diagnostic and Statistical Manual of Mental Disorders: DSM-IV-TR,” 4th Editon, American Psychiatic and Association, Washington DC, 2000.
- S. E. Shaywitz, B. A. Shaywitz, K. R. Pugh, R. K. Fulbright, R. T. Constable, W. E. Mencl, D. P. Shankweiler, A. M. Liberman, P. Skudlarski, J. M. Fletcher, L. Katz, K. E. Marchione, C. Lacadie, C. Gatenby, and J. C. Gore, “Functional Disruption in the Organization of the Brain for Reading in Dyslexia,” Proceedings of the National Academy of Sciences, Vol. 95, No. 5, 1998, pp. 2636-2641. doi:10.1073/pnas.95.5.2636
- C. Boden and D. Giaschi, “M-Stream Deficits and Reading-Related Visual Processes in Developmental Dyslexia,” Psychological Bulletin, Vol. 133, No. 2, 2007, pp. 346-366. doi:10.1037/0033-2909.133.2.346
- K. Nandakumar and S. J. Leat, “Dyslexia: A Review of Two Theories,” Clinical and Experimental Optometry, Vol. 91, No. 4, 2008, pp. 333-340. doi:10.1111/j.1444-0938.2008.00277.x
- K. R. Pugh, W. E. Mencl, A. R. Jenner, L. Katz, S. J. Frost, J. R. Lee, S. E. Shaywitz and B. A. Shaywitz, “Functional Neuroimaging Studies of Reading and Reading Disability (Developmental Dyslexia),” Mental Retardation and Developmental Disabilities Research Reviews, Vol. 6, No. 3, 2000, pp. 207-213. doi:10.1002/1098-2779(2000)6:3<207::AID-MRDD8>3.0.CO;2-P
- J. I. Breier, P. G. Simos, J. M. Fletcher, E. M. Castillo, W. Zhang and A. C. Papanicolaou, “Abnormal Activation of Temporoparietal Language Areas during Phonetic Analysis in Children with Dyslexia,” Neuropsychology, Vol. 17, No. 4, 2003, pp. 610-621. doi:10.1037/0894-4105.17.4.610
- F. Hoeft, A. Meyler, A. Hernandez, C. Juel, H. TaylorHill, J. L. Martindale, G. McMillon, G. Kolchugina, J. M. Black, A. Faizi, G. K. Deutsch, W. T. Siok, A. L. Reiss, S. Whitfield-Gabrieli and J. D. E. Gabrieli, “Functional and Morphometric Brain Dissociation between Dyslexia and Reading Ability,” Proceedings of the National Academy of Sciences, Vol. 104, No. 10, 2007, pp. 4234-4239. doi:10.1073/pnas.0609399104
- T. Fagerheim, P. Raeymaekers, F. E. Tønnessen, M. Pedersen, L. Tranebjærg and H. A. Lubs, “A New Gene (DYX3) for Dyslexia Is Located on Chromosome 2,” Journal of Medical Genetics, Vol. 36, No. 9, 1999, pp. 664-669.
- L. Bradley and P. E. Bryant, “Categorizing Sounds and Learning to Read: A Causal Connexion,” Nature, Vol. 301, 1983, pp. 419-421. doi:10.1038/301419a0
- G. Schulte-Körne and J. Bruder, “Clinical Neurophysiology of Visual and Auditory Processing in Dyslexia: A Review,” Clinical Neurophysiology, Vol. 121, No. 11, 2010, pp. 1794-1809. doi:10.1016/j.clinph.2010.04.028
- D. Perin, “Phonemic Segmentation and Spelling,” British Journal of Psychology, Vol. 74, No. 1, 1983, pp. 129-144. doi:10.1111/j.2044-8295.1983.tb01849.x
- I. Y. Liberman, H. Rubin, S. Duques and J. Carlisle, “Lin- guistic Abilities and Spelling Proficiency in Kindergarten and Adult Poor Spellers,” In: D. Gray and J. Kavanagh, Eds., Biobehavioral Measures of Dyslexia, York Press, Parkton, 1985, pp. 163-176.
- G. W. MacDonald and A. Cornwall, “The Relationship between Phonological Awareness and Reading and Spelling Achievement Eleven Years Later,” Journal of Learning Disabilities, Vol. 28, No. 8, 1995, pp. 523-527. doi:10.1177/002221949502800807
- I. Lundberg and T. Hoien, “Initial Enabling Knowledge and Skills in Reading Acquisition: Print Awareness and Phonological Segmentation,” In: D. Sawyer and B. Fox, Eds., Phonological Awareness in Reading—The Evolution of Current Perspectives, Springer-Verlag, New York, 1991, pp. 73-96.
- M.-C. St-Pierre and R. Beland, “Reproduction of Inflectional Markers in French-Speaking Children with Reading Impairment,” Journal of Speech Lang Hear Research, Vol. 53, No. 2, 2010, pp. 469-489. doi:10.1044/1092-4388(2009/07-0251)
- M. Habib, “The Neurological Basis of Developmental Dyslexia: An Overview and Working Hypothesis,” Brain, Vol. 123, No. 12, 2000, pp. 2373-2399. doi:10.1093/brain/123.12.2373
- W. Lovegrove, A. Bowling, D. Badcock and M. Blackwood, “Specific Reading Disability: Differences in Contrast Sensitivity as a Function of Spatial Frequency,” Science, Vol. 210, No. 4468, 1980, pp. 439-440. doi:10.1126/science.7433985
- W. J. Lovegrove, M. Heddle and W. Slaghuis, “Reading Disability: Spatial Frequency Specific Deficits in Visual Information Store,” Neuropsychologia, Vol. 18, No. 1, 1980, pp. 111-115. doi:10.1016/0028-3932(80)90093-7
- A. J. Sperling, Z.-L. Lu, F. R. Manis and M. S. Seidenberg, “Selective Magnocellular Deficits in Dyslexia: A ‘Phantom Contour’ Study,” Neuropsychologia, Vol. 41, No. 10, 2003, pp. 1422-1429. doi:10.1016/S0028-3932(03)00044-7
- J. Stein, “The Magnocellular Theory of Developmental Dyslexia,” Dyslexia: The Journal of the British Dyslexia Association, Vol. 7, No. 7, 2001, pp. 12-36.
- P. Lennie, “Parallel Visual Pathways: A Review,” Vision Research, Vol. 20, No. 7, 1980, pp. 561-594. doi:10.1016/0042-6989(80)90115-7
- W. Merigan, A. Freeman and S. P. Meyers, “Parallel Processing Streams in Human Visual Cortex,” Neuroreport, Vol. 8, No. 18, 1997, pp. 3985-3991. doi:10.1097/00001756-199712220-00027
- P. Rezaie and A. Dean, “Periventricular Leukomalacia, Inflammation and White Matter Lesions within the Developing Nervous System,” Neuropathology, Vol. 22, No. 3, 2002, pp. 106-132. doi:10.1046/j.1440-1789.2002.00438.x
- E. R. Kandel, J. H. Schwartz and T. M. Jessel, “Principles of Neural Science,” Elsevier, New York, 2000.
- L. J. Croner and E. Kaplan, “Receptive Fields of P and M Ganglion Cells across the Primate Retina,” Vision Research, Vol. 35, No. 1, 1995, pp. 7-24. doi:10.1016/0042-6989(94)E0066-T
- M. Livingstone and D. Hubel, “Psychophysical Evidence for Separate Channels for the Perception of Form, Color, Movement, and Depth,” Journal of Neuroscience, Vol. 7, No. 11, 1987, pp. 3416-3468.
- W. H. Merigan and J. H. Maunsell, “How Parallel Are the Primate Visual Pathways?” Annals of Review Neuroscience, Vol. 16, No. 18, 1993, pp. 369-402. doi:10.1146/annurev.ne.16.030193.002101
- B. Hammarrenger, F. Lepore, S. Lippe, M. Labrosse, J.-P. Guillemot and M.-S. Roy, “Magnocellular and Parvocellular Developmental Course in Infants during the First Year of Life,” Documenta Ophthalmologica, Vol. 107, No. 3, 2003, pp. 225-233. doi:10.1023/B:DOOP.0000005331.66114.05
- B. Hammarrenger, M.-S. Roy, D. Ellemberg, M. Labrosse, J. Orquin, S. Lippe and F. Lepore, “Developmental Delay and Magnocellular Visual Pathway Function in VeryLow-Birthweight Preterm Infants,” Developmental Medicine & Child Neurology, Vol. 49, No. 1, 2007, pp. 28-33. doi:10.1017/S0012162207000084.x
- M. Livingstone and D. Hubel, “Segregation of Form, Color, Movement, and Depth: Anatomy, Physiology, and Perception,” Science, Vol. 240, No. 4853, 1988, pp. 740- 749. doi:10.1126/science.3283936
- R. Shapley, “Visual Sensitivity and Parallel Retinocortical Channels,” Annual Review of Psychology, Vol. 41, No. 1, 1990, pp. 635-658. doi:10.1146/annurev.ps.41.020190.003223
- B. G. Breitmeyer, “Unmasking Visual Masking: A Look at the ‘Why’ behind the Veil of the ‘How’,” Psychological Review, Vol. 87, No. 1, 1980, pp. 52-69. doi:10.1037/0033-295X.87.1.52
- W. Singer and N. Bedworth, “Inhibitory Interaction between X and Y Units in the Cat Lateral Geniculate Nucleus,” Brain Research, Vol. 49, No. 2, 1973, pp. 291-307. doi:10.1016/0006-8993(73)90424-1
- B. G. Breitmeyer, “Visual Masking: An Integrative Approach,” Oxford University Press, Oxford, 1984.
- B. G. Breitmeyer, “Reality and Relevance of Sustained and Transient Channels in Reading and Reading Disability,” In: R. Schmid and D. Zambarbieri, Eds., Oculomotor Control and Cognitive Processes, North Holland, Amsterdam, 1991, pp. 473-483.
- P. L. Cornelissen, P. C. Hansen, I. Gilchrist, F. Cormack, J. Essex and C. Frankish, “Coherent Motion Detection and Letter Position Encoding,” Vision Research, Vol. 38, No. 14, 1998, pp. 2181-2191. doi:10.1016/S0042-6989(98)00016-9
- P. L. Cornelissen, P. C. Hansen, J. L. Hutton, V. Evangelinou and J. F. Stein, “Magnocellular Visual Function and Children’s Single Word Reading,” Vision Research, Vol. 38, No. 3, 1998, pp. 471-482. doi:10.1016/S0042-6989(97)00199-5
- J. Stein and V. Walsh, “To See but Not to Read: The Magnocellular Theory of Dyslexia,” Trends in Neurosciences, Vol. 20, No. 20, 1997, pp. 147-152. doi:10.1016/S0166-2236(96)01005-3
- M. S. Livingstone, G. D. Rosen, F. W. Drislane and A. M. Galaburda, “Physiological and Anatomical Evidence for a Magnocellular Defect in Developmental Dyslexia,” Proceedings of the National Academy of Sciences of the United States of America, Vol. 88, No. 18, 1991, pp. 7943-7947. doi:10.1073/pnas.88.18.7943
- W. J. Lovegrove, “Is the Question of the Role of Visual Deficits as a Cause of Reading Disabilities a Closed One? Comments on Hulme,” Cognitive Neuropsychology, Vol. 8, No. 6, 1991, pp. 435-441. doi:10.1080/02643299108253381
- B. C. Skottun, “The Magnocellular Deficit Theory of Dyslexia: The Evidence from Contrast Sensitivity,” Vision Research, Vol. 40, No. 1, 2000, pp. 111-127. doi:10.1016/S0042-6989(99)00170-4
- B. C. Skottun and J. Skoyles, “Dyslexia, Direction Selectivity and Magnocellular Sensitivity,” Vision Research, Vol. 47, No. 14, 2007, pp. 1974-1975. doi:10.1016/j.visres.2006.10.027
- B. C. Skottun and J. R. Skoyles, “Coherent Motion, Magnocellular Sensitivity and the Causation of Dyslexia,” International Journal of Neuroscience, Vol. 118, No. 1, 2008, pp. 185-190.
- J. Skoyles and B. C. Skottun, “On the Prevalence of Magnocellular Deficits in the Visual System of Non-Dyslexic Individuals,” Brain and Language, Vol. 88, No. 1, 2004, pp. 79-82. doi:10.1016/S0093-934X(03)00162-7
- E. Borsting, W. H. Ridder Iii, K. Dudeck, C. Kelley, L. Matsui and J. Motoyama, “The Presence of a Magnocellular Defect Depends on the Type of Dyslexia,” Vision Research, Vol. 36, No. 7, 1996, pp. 1047-1053. doi:10.1016/0042-6989(95)00199-9
- A. M. Galaburda, “Neuroanatomic Basis of Developmental Dyslexia,” Neurologic Clinics, Vol. 11, No. 1, 1993, pp. 161-173.
- A. M. Galaburda, “Neurology of Developmental Dyslexia,” Current Opinion in Neurobiology, Vol. 3, No. 2, 1993, pp. 237-242. doi:10.1016/0959-4388(93)90216-L
- J. B. Demb, G. M. Boynton and D. J. Heeger, “Brain Activity in Visual Cortex Predicts Individual Differences in Reading Performance,” Proceedings of the National Academy of Sciences of the United States of America, Vol. 94, No. 24, 1997, pp. 13363-13366. doi:10.1073/pnas.94.24.13363
- J. B. Demb, G. M. Boynton and D. J. Heeger, “Functional Magnetic Resonance Imaging of Early Visual Pathways in Dyslexia,” The Journal of Neuroscience, Vol. 18, No. 17, 1998, pp. 6939-6951.
- G. F. Eden, J. W. VanMeter, J. M. Rumsey, J. M. Maisog, R. P. Woods and T. A. Zeffiro, “Abnormal Processing of visual Motion in Dyslexia Revealed by Functional Brain imaging,” Nature, Vol. 382, No. 6586, 1996, pp. 66-69. doi:10.1038/382066a0
- F. Martin and W. Lovegrove, “The Effects of Field Size and Luminance on Contrast Sensitivity Differences between Specifically Reading Disabled and Normal Children,” Neuropsychologia, Vol. 22, No. 1, 1984, pp. 73-77. doi:10.1016/0028-3932(84)90009-5
- F. Martin and W. J. Lovegrove, “Uniform-Field Flicker Masking in Control and Specifically-Disabled Readers,” Perception, Vol. 17, No. 2, 1988, pp. 203-214. doi:10.1068/p170203
- A. Galaburda and M. Livingstone, “Evidence for a Magnocellular Defect in Developmental Dyslexia,” Annals of the New York Academy of Sciences, Vol. 682, 1993, pp. 70-82. doi:10.1111/j.1749-6632.1993.tb22960.x
- Z. Kubová, M. Kuba, H. Spekreijse and C. Blakemore, “Contrast Dependence of Motion-Onset and Pattern-Reversal Evoked Potentials,” Vision Research, Vol. 35, No. 2, 1995, pp. 197-205. doi:10.1016/0042-6989(94)00138-C
- S. Lehmkuhle, R. P. Garzia, L. Turner, T. Hash and J. A. Baro, “A Defective Visual Pathway in Children with Reading Disability,” New England Journal of Medicine, Vol. 328, No. 14, 1993, pp. 989-996. doi:10.1056/NEJM199304083281402
- J. G. May, W. P. Dunlap and W. J. Lovegrove, “Factor Scores Derived from Visual Evoked Potentials Latencies Differentiate Good and Poor Readers,” Clinical Vision Sciences, Vol. 7, 1992, pp. 67-70.
- J. G. May, W. J. Lovegrove, F. Martain, and P. Nelson, “Pattern-Elicited Visual Evoked Potentials in Good and Poor Readers,” Clinical Vision Sciences, Vol. 6, 1991, pp. 131-136.
- G. Schulte-Korne, J. Bartling, W. Deimel and H. Remschmidt, “Motion-Onset VEPs in Dyslexia. Evidence for Visual Perceptual Deficit,” Neuroreport, Vol. 15, No. 6, 2004, pp. 1075-1078. doi:10.1097/00001756-200404290-00029
- J. Brecelj, M. Štrucl and V. Raič, “Do Visual Neurophysiological Tests Reflect Magnocellular Deficit in Dyslexic Children?” Pflügers Archiv-European Journal of Physiology, Vol. 431, No. 6, 1996, pp. R299-R300. doi:10.1007/BF02346387
- L. Mecacci, E. Sechi and G. Levi, “Abnormalities of Visual Evoked Potentials by Checkerboards in Children with Specific Reading Disability,” Brain and Cognition, Vol. 2, No. 2, 1983, pp. 135-143. doi:10.1016/0278-2626(83)90004-0
- H. A. Solan, V. G. Sujita, A. P. Ficarra and S. A. Wurst, “Binocular Advantage and Visual Processing in Dyslexic and Control Children as Measured by Visual Evoked Potentials,” Optometry & Vision Science, Vol. 67, No. 2, 1990, pp. 105-110. doi:10.1097/00006324-199002000-00008
- Z. Kubovà, M. Kuba, J. Peregrin and V. Nonakova, “Visual Evoked Potential Evidence for Magnocellular System Deficit in Dyslexia,” Physiological Research, Vol. 45, No. 1, 1996, pp. 87-89.
- D. Ellemberg, B. Hammarrenger, F. Lepore, M. S. Roy and J. P. Guillemot, “Contrast Dependency of VEPs as a Function of Spatial Frequency: The Parvocellular and Magnocellular Contributions to Human VEPs,” Spatial Vision, Vol. 15, No. 1, 2001, pp. 99-111. doi:10.1163/15685680152692042
- G. F. Harding, J. V. Odom, W. Spileers and H. Spekreijse, “Standard for Visual Evoked Potentials 1995. The International Society for Clinical Electrophysiology of Vision,” Vision Research, Vol. 36, No. 21, 1996, pp. 3567-3572. doi:10.1016/0042-6989(96)00125-3
- M. Bach and D. Ullrich, “Contrast Dependency of Motion-Onset and Pattern-Reversal VEPs: Interaction of Stimulus Type, Recording Site and Response Component,” Vision Research, Vol. 37, No. 13, 1997, pp. 1845-1849. doi:10.1016/S0042-6989(96)00317-3
- A. Vassilev, V. Stomonyakov and V. Manahilov, “Spatial-Frequency Specific Contrast Gain and Flicker Masking of Human Transient VEP*,” Vision Research, Vol. 34, No. 7, 1994, pp. 863-872. doi:10.1016/0042-6989(94)90036-1
- M. Kronbichler, F. Hutzler and H. Wimmer, “Dyslexia: Verbal Impairments in the Absence of Magnocellular Impairments,” Neuroreport, Vol. 13, No. 5, 2002, pp. 617- 620. doi:10.1097/00001756-200204160-00016
- J. D. Victor, M. M. Conte, L. Burton and R. D. Nass, “Visual Evoked Potentials in Dyslexics and Normals: Failure to Find a Difference in Transient or Steady-State Responses,” Visual Neuroscience, Vol. 10, No. 5, 1993, pp. 939-946. doi:10.1017/S0952523800006155
- S. Johannes, C. L. Kussmaul, T. F. Münte and G. R. Mangun, “Developmental Dyslexia: Passive Visual Stimulation Provides No Evidence for a Magnocellular Processing Defect,” Neuropsychologia, Vol. 34, No. 11, 1996, pp. 1123-1127. doi:10.1016/0028-3932(96)00026-7
- S. Amitay, G. Ben-Yehudah, K. Banai and M. Ahissar, “Disabled Readers Suffer from Visual and Auditory Impairments but Not from a Specific Magnocellular Deficit,” Brain, Vol. 125, No. 10, 2002, pp. 2272-2285. doi:10.1093/brain/awf231
- G. Ben-Yehudah, E. Sackett, L. Malchi-Ginzberg and M. Ahissar, “Impaired Temporal Contrast Sensitivity in Dyslexics Is Specific to Retain-and-Compare Paradigms,” Brain, Vol. 124, No. 7, 2001, pp. 1381-1395. doi:10.1093/brain/124.7.1381
- F. Ramus, “Developmental Dyslexia: Specific Phonological Deficit or General Sensorimotor Dysfunction?” Current Opinion in Neurobiology, Vol. 13, No. 2, 2003, pp. 212-218. doi:10.1016/S0959-4388(03)00035-7
- M. J. Williams, G. W. Stuart, A. Castles and K. I. McAnally, “Contrast Sensitivity in Subgroups of Developmental Dyslexia,” Vision Research, Vol. 43, No. 4, 2003, pp. 467-477. doi:10.1016/S0042-6989(02)00573-4
- J. Stevenson, K. Langley, H. Pay, A. Payton, J. Worthington, W. Ollier and A. Thapar, “Attention Deficit Hyperactivity Disorder with Reading Disabilities: Preliminary Genetic Findings on the Involvement of the ADRA2A Gene,” Journal of Child Psychology and Psychiatry and Allied Disciplines, Vol. 46, No. 10, 2005, pp. 1081-1088. doi:10.1111/j.1469-7610.2005.01533.x
- J. M. Carroll and J. E. Iles, “An Assessment of Anxiety levels in Dyslexic Students in Higher Education,” British Journal of Educational Psychology, Vol. 76, No. 3, 2006, pp. 651-662. doi:10.1348/000709905X66233
- E. G. Willcutt and B. F. Pennington, “Psychiatric Comorbidity in Children and Adolescents with Reading Disability,” The Journal of Child Psychology and Psychiatry and Allied Disciplines, Vol. 41, No. 8, 2000, pp. 1039-1048. doi:10.1111/1469-7610.00691
- E. Peli and M. A. García-Pérez, “Contrast Sensitivity in Dyslexia: Deficit or Artifact?” Optometry & Vision Science, Vol. 74, No. 12, 1997, pp. 986-987. doi:10.1097/00006324-199712000-00017
- C. C. Duncan, J. M. Rumsey, S. M. Wilkniss, M. B. Denckla, S. D. Hamburger and M. Odou-Potkin, “Developmental Dyslexia and Attention Dysfunction in Adults: Brain Potential Indices of Information Processing,” Psychophysiology, Vol. 31, No. 4, 1994, pp. 386- 401. doi:10.1111/j.1469-8986.1994.tb02447.x
- F. Ramus, “Neurobiology of Dyslexia: A Reinterpretation of the Data,” Trends in Neurosciences, Vol. 27, No. 12, 2004, pp. 720-726. doi:10.1016/j.tins.2004.10.004
- W. Lovegrove, “Weakness in the Transient Visual System: A Causal Factor in Dyslexia?” Annals of the New York Academy of Sciences, Vol. 682, No. , 1993, pp. 57-69. doi:10.1111/j.1749-6632.1993.tb22959.x
- B. A. Shaywitz, S. E. Shaywitz, K. R. Pugh, W. E. Mencl, R. K. Fulbright, P. Skudlarski, R. T. Constable, K. E. Marchione, J. M. Fletcher, G. R. Lyon and J. C. Gore, “Disruption of Posterior Brain Systems for Reading in Children with Developmental Dyslexia,” Biological Psychiatry, Vol. 52, No. 2, 2002, pp. 101-110. doi:10.1016/S0006-3223(02)01365-3
- A. Meyler, T. A. Keller, V. L. Cherkassky, D. Lee, F. Hoeft, S. Whitfield-Gabrieli, J. D. E. Gabrieli and M. A. Just, “Brain Activation during Sentence Comprehension among Good and Poor Readers,” Cerebral Cortex, 2007, Vol. 17, No. 12, pp. 2780-2787. doi:10.1093/cercor/bhm006
- F. Cao, T. Bitan, T.-L. Chou, D. D. Burman and J. R. Booth, “Deficient Orthographic and Phonological Representations in Children with Dyslexia Revealed by Brain Activation Patterns,” Journal of Child Psychology and Psychiatry, Vol. 47, No. 10, 2006, pp. 1041-1050. doi:10.1111/j.1469-7610.2006.01684.x
- N. Brunswick, E. McCrory, C. J. Price, C. D. Frith and U. Frith, “Explicit and Implicit Processing of Words and Pseudowords by Adult Developmental Dyslexics,” Brain, Vol. 122, No. 10, 1999, pp. 1901-1917. doi:10.1093/brain/122.10.1901
- P. Helenius, R. Salmelin, E. Service and J. F. Connolly, “Semantic Cortical Activation in Dyslexic Readers,” Journal of Cognitive Neuroscience, Vol. 11, No. 5, 1999, pp. 535-550. doi:10.1162/089892999563599
- E. Temple, R. A. Poldrack, A. Protopapas, S. Nagarajan, T. Salz, P. Tallal, M. M. Merzenich and J. D. E. Gabrieli, “Disruption of the Neural Response to Rapid Acoustic stimuli in Dyslexia: Evidence from Functional MRI,” Proceedings of the National Academy of Sciences of the United States of America, Vol. 97, No. 25, 2000, pp. 13907-13912. doi:10.1073/pnas.240461697
List of Abbreviations
ADHD: Attention deficit-hyperactivity disorder DSM-IV: Diagnostic and Statistical Manual of Mental Disorders fMRI: Functional magnetic resonance imaging IQ: Intellectual quotient IREP: Research Institute and Psychopedagogy Evaluation LGN: Lateral geniculate nucleus M: Magnocellular system ms: Mili-seconds MT/V5: Extra-striate visual motion area P: Parvocellular system TR: Typical Reader VEP: Visual evoked potentials V1: Primary visual cortex WISC-III: Wechsler Intelligence Scale for Children— 3rd Edition
NOTES
*Corresponding author.