Advances in Chemical Engineering and Science
Vol.4 No.1(2014), Article ID:42437,8 pages DOI:10.4236/aces.2014.41010
Investigation of Lipid Peroxidation Products and Antioxidant Enzyme Activities in End-Stage Renal Disease Patients
1Faculty of Medicine Pristina, Institute of Biochemistry, Settlement Kosovska Mitrovica, Serbia
2Internal Clinic Faculty of Medicine Pristina, Settlement Kosovska Mitrovica, Serbia
3Faculty of Medicine Pristina, Institute of Preventive Medicine (Medical Statistics and Informatics), Settlement Kosovska Mitrovica, Serbia
4Faculty of Medicine Pristina, Institute of Pharmacology, Settlement Kosovska Mitrovica, Serbia
5Faculty of Medicine Pristina, Institute of Pathophysiology, Settlement Kosovska Mitrovica, Serbia
Email: bojanabk2002@yahoo.com
Copyright © 2014 Bojana Kisic et al. This is an open access article distributed under the Creative Commons Attribution License, which permits unrestricted use, distribution, and reproduction in any medium, provided the original work is properly cited. In accordance of the Creative Commons Attribution License all Copyrights © 2014 are reserved for SCIRP and the owner of the intellectual property Bojana Kisic et al. All Copyright © 2014 are guarded by law and by SCIRP as a guardian.
Received November 24, 2013; revised December 24, 2013; accepted December 30, 2013
KEYWORDS
Oxidative Stress; Hemodialysis; Ferritin; Antioxidant Enzymes; Lipid Peroxidation
ABSTRACT
Background: Intravenous application of iron preparations which is a routine treatment of anemia in hemodialysis patients with end-stage renal disease can lead to iron overload in the body. Redox-active iron can catalyze the formation of hydroxyl radicals and initiation of lipid peroxidation, increase oxidative stress and speed up the development of complications in these patients. Objective: In this study, we determined the markers of lipid peroxidation, protein oxidation and antioxidant enzyme activities (superoxide dismutase, glutathione peroxidase, glutathione S-transferase) in serum of patients with end-stage renal disease on hemodialysis, who had received repeated treatment of iron supplementation. Patients and Methods: The study included 29 patients undergoing regular hemodialysis treatment. These patients were divided into three groups according to the serum ferritin levels: group I (serum ferritin between 100 and 300 (g/L); group II (serum ferritin between 301 and 600 (g/L), and group III (serum ferritin above 601 (g/L). Results: The serum of patients with the highest concentration of serum ferritin and iron contained significantly higher level of lipid peroxidation products, total hydroperoxides and malondialdehyde and advanced oxidation protein products and the lowest concentration of sulfhydryl groups, reduced glutathione and total antioxidant capacity. Conclusion: Based on the obtained results, it can be concluded that iron supplementation in hemodialysis patients and consequently body iron overload of exacerbated oxidative stress have already been present in these patients.
1. Introduction
Numerous researches have shown that in patients with end-stage renal disease (ESRD), production of reactive oxygen species (ROS) and subsequent oxidative stress increase [1]. The treatment of patients with ESRD—hemodialysis, contributes to the reduction of antioxidant levels and development of oxidative stress in several ways: 1) activation of phagocytic oxidative metabolism by the dialysis membrane causes chronic inflammation [2], 2) hemoincopatibility of the dialysis system contributes to production of oxygen radicals during dialysis [1], 3) direct peroxidation of lipids on dialysis membranes [3], 4) hydrosoluble antioxidants and substances with small molecular weight are lost through highly permeable dialysis membrane [4].
In long-term dialysis patients, renal anemia caused by erythropoietin deficiency is a common complication and erythropoiesis is maintained by the application of erythropoietin and parenteral iron supplementation [5]. Iron supplementation, though efficient in the treatment of anemia, can have adverse effects when the binding capacity of transferrin is overcome and when the concentration of potentially reactive, non-transferrin bound iron in plasma is increased [6]. Toxicity of free, redox-active iron is largely based on Fenton and Haber-Weiss chemistry, where catalytic amounts of iron are sufficient to yield hydroxyl radicals (OH) from superoxide ( ) and hydrogen peroxide (H2O2) [7].
Data in the literature show that iron overload in experimental animals leads to oxidative damage of lipids [8], and the application of intravenous iron causes an increase in oxidative stress markers in patients with end-stage renal disease on hemodialysis [9]. In addition, renal anemia in patients with ESRD can contribute to oxidative stress due to increased formation of ROS during anaerobic metabolism and decreased antioxidative protection caused by reduced erythrocyte pool. Red blood cells represent an important antioxidative system in circulation and mobile free radical scavengers because they contain reduced glutathione and antioxidative glutathione-dependent enzymes.
2. Aim
In this study, we determined the markers of lipid peroxidation, protein oxidation and antioxidant enzyme activities (superoxide dismutase (SOD EC 1.15.1.1), glutathione peroxidase (GPx, EC 1.11.1.9), glutathione Stransferase (GST, EC 2.5.1.18) in serum of patients with end-stage renal disease on hemodialysis, who had received repeated treatment of iron supplementation.
3. Material and Methods
The study included 29 patients undergoing regular hemodialysis treatment (15 males and 14 females), with a median age of 57 (range 23 - 76) years and HD duration of 45 (range 5 - 144) months. The demographic and biochemical characteristics of HD patients are presented in Table 1. Hemodialyzed patients were given a total iron dose of 62.5 mg (ferric gluconate—Ferrlecit 62.5 mg) i.v. during 10 consecutive dialysis treatments.
Etiologies for ESRD were chronic glomerulonephritis
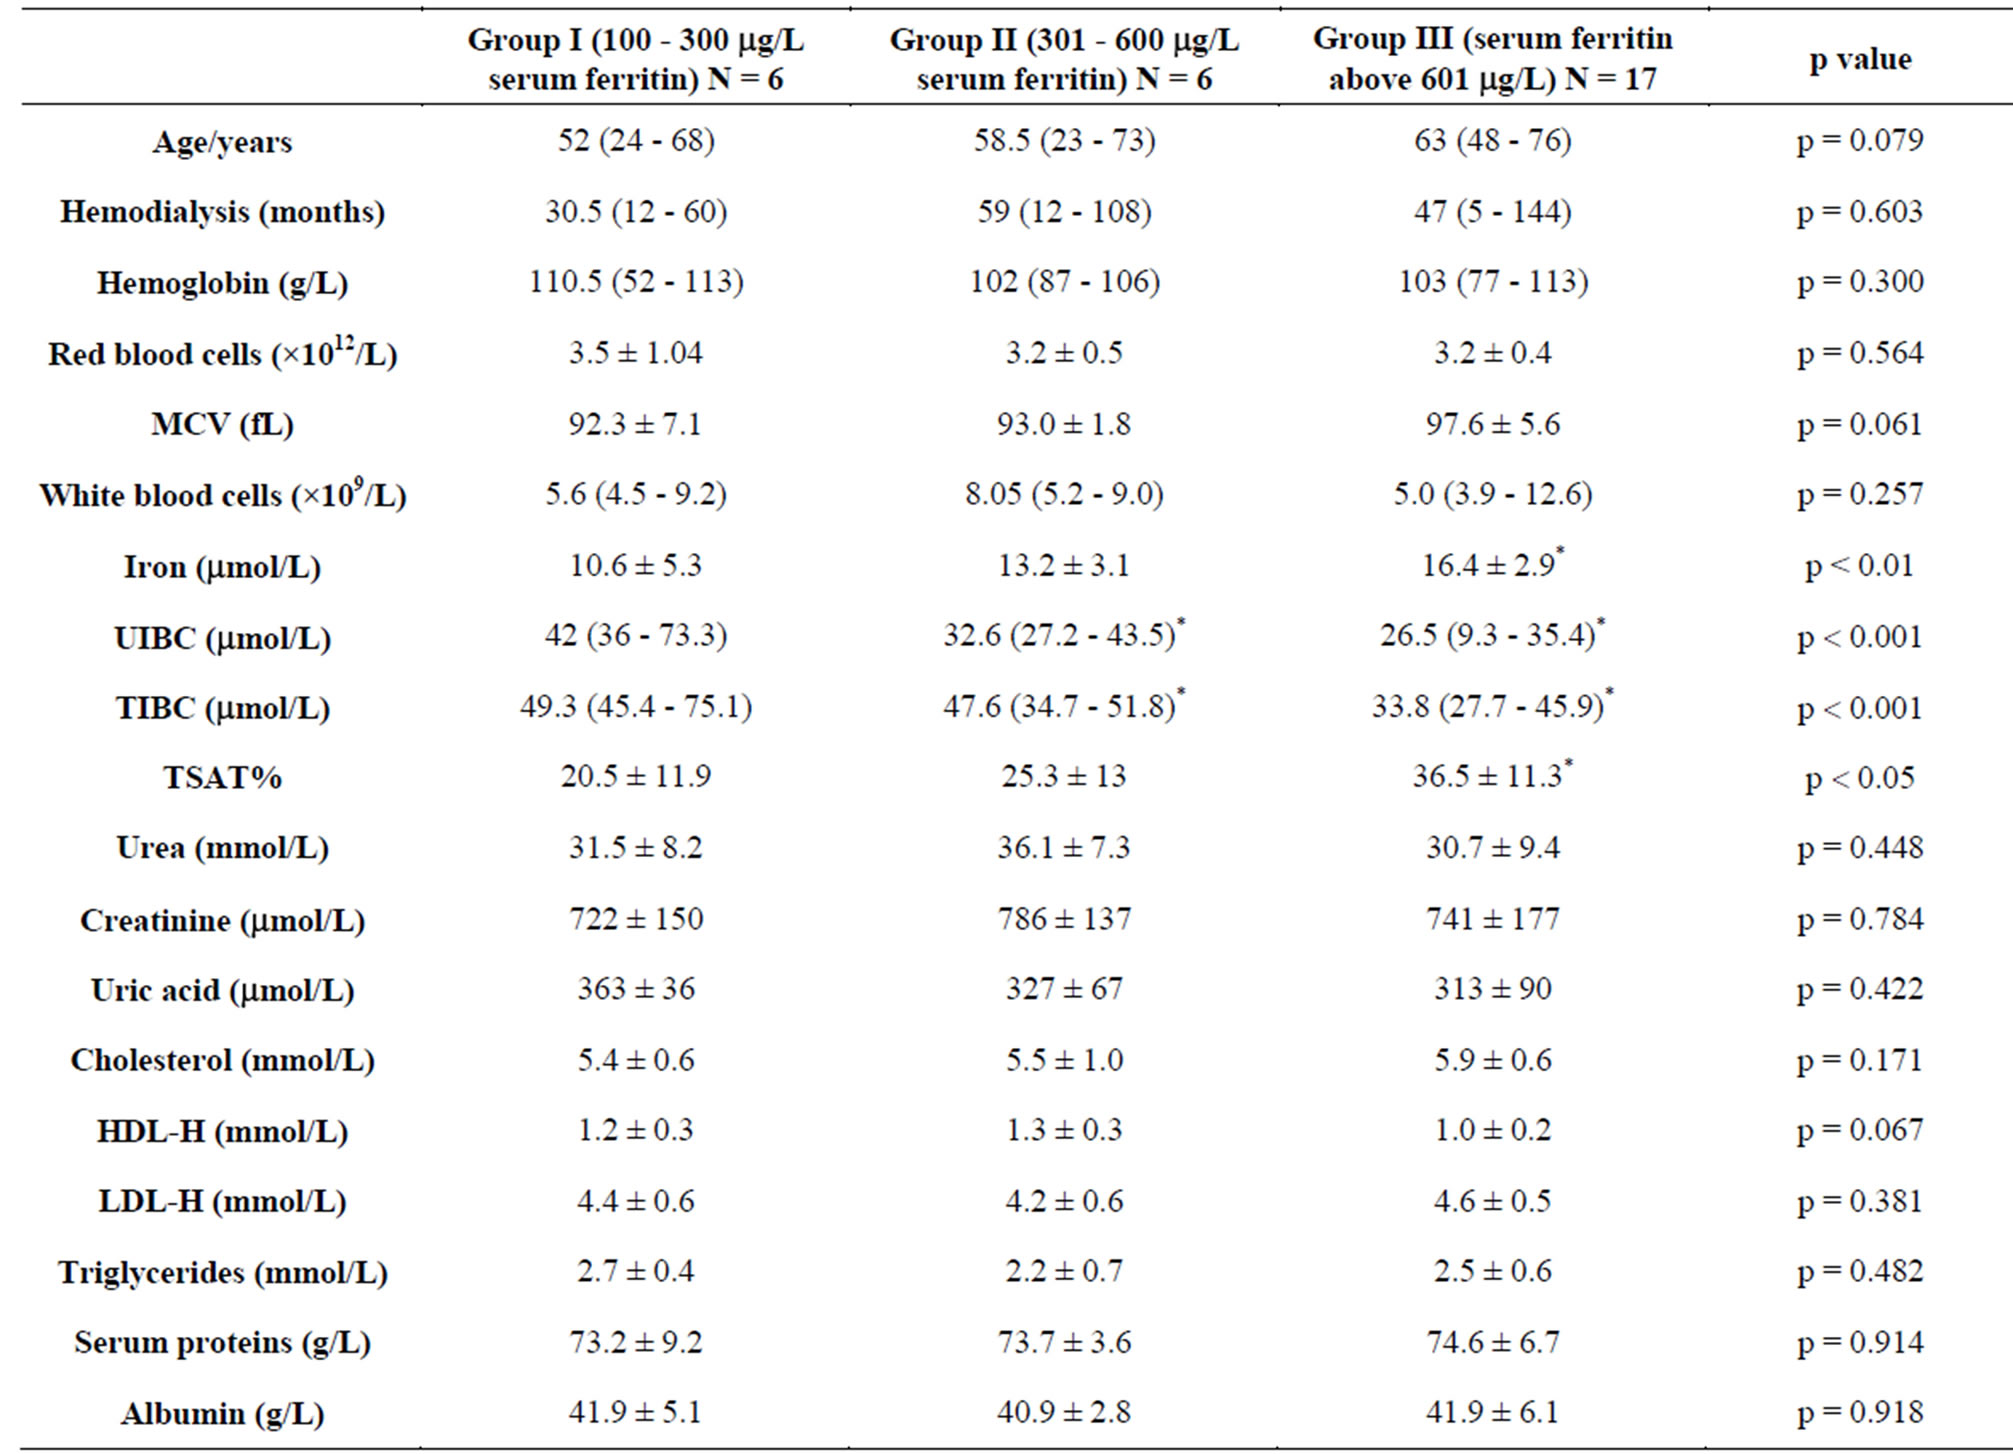
Table 1. Biochemical and haematological characteristics of hemodialysis patients.
in 7 patients, hypertensive nephropathy in 12 patients, polycystic kidney disease in 6 patients, diabetes mellitus in 4 patients. These patients were divided into three groups according to the serum ferritin levels: group I (serum ferritin between 100 and 300 mg/L); group II (serum ferritin between 301 and 600 mg/L), and group III (serum ferritin above 601 mg/L).
This research was conducted following the tenets of the Declaration of Helsinki and approved by the Ethics Committee of the Medical Faculty Pristina (Kosovska Mitrovica), number 05-1462/07.12.2011. Informed consent was obtained after explanation of the research objectives.
Serum level of creatinine, urea, serum iron, ferritin, and total proteins were determined by routine laboratory techniques on the Hitachi 902 chemistry analyzer (Roche Diagnostics GmbH, Mannheim, Germany). Hematological parameters including hemoglobin and erythrocyte indexes were measured on the hematology analyzer (Beckman Coulter, Krefeld, Germany). The transferrin saturation index (TSAT index) was calculated according to the following formula: saturation (%) = serum iron/total iron binding capacity.
3.1. The Concentration of Total Hydroperoxides
The concentration of total hydroperoxides, was measured by the ferrous oxidation xylenol orange method (FOX2), with triphenylphosphine (TPP) [10]. The absorbance readings were taken at 560 nm and the hydroperoxide concentration was calculated as the difference in absorbance of TPP non-treated and treated sample, and it was expressed in mmol/L of H2O2.
3.2. The Concentration of Malondialdehyde
Concentration of the malondialdehyde was determined by the production of thiobarbituric acid reacting substances [11]. Concentration of MDA was calculated using the molar extinction coefficient e = 1.56 × 10⁵ L × mol−1 × cm−1.
3.3. The Concentration of Serum Advanced Oxidation Protein Products
Serum advanced oxidation protein products (AOPP) was measured by the method of Anderstam et al. [12]. The absorbance readings were taken at l = 340 nm against reagent blank. Concentration of AOPP was calculated respective to chloramine-T standard. Total sulfhydryl groups were determined using Ellman’s reagent without prior deproteinization [13]. The concentration of serum GSH was measured with Ellmans’s reagent after sample deproteinization [13].
3.4. The Activity of Antioxidant Enzymes
Superoxide dismutase (SOD) activity was measured by the method of Misra and Fridovich [14], based on the ability of SOD to inhibit auto-oxidation of epinephrine at alkaline pH (pH 10.2). One unit of SOD activity was defined as the amount of enzyme, which inhibits the oxidation of epinephrine by 50%. The glutathione peroxidase (GPx) activity was assayed by the method of Rotruck et al. [15] with cumene hydroperoxide as a substrate (in 50 mmol TRIS-HCl buffer, pH 7.6). It was monitored at 412 nm. One unit of enzyme activity was defined as the amount of GPx that catalyses the oxidation of 1 mmol of GSH per minute at 37˚C. The conjugation of GSH with 1-chloro-2,4-dinitro-benzene (CDNB), a hydrophilic substrate, was examined spectrophotometrically at 340 nm to measure glutathione S-transferase (GST) activity [16]. One unit of GST was defined as the amount of enzyme required to conjugate 1 mmol of CDNB with GSH per minute, at 30˚C. The glutathione reductase (GR, EC 1.8.1.7) activity was measured without adding flavin adenine dinucleotide (FAD) by the rate of NADPH consumption at 340 nm, as described by Racker [17]. One unit of GR activity was defined as 1 mmol of NADPH oxidized per minute at 37˚C. Total antioxidant status was measured by colorimetric method developed by Erel [18]. TAC of serum samples was expressed in mmol Trolox Equiv /L.
3.5. Statistical Data Analysis
The obtained data were analyzed using descriptive statistical methods and methods for testing statistical hypotheses. The descriptive statistical methods included measures of central tendency (mean and median) and measures of variability (standard deviation).
The hypothesis concerning the difference between arithmetic means was tested by ANOVA test, and when the distribution of values did not fulfill the demands of normal distribution, Kruskal Wallis H test and MannWhitney test (rank-sum test) were used. The correlations were calculated by Pearson’s linear correlation coefficient.
Statistical hypotheses were tested at the level of statistical significance from 0.05, 0.01 and 0.001. The statistical analysis of data was performed using PASW Statistics 18.
4. Results
Biochemical and haematological characteristics of hemodialysis patients with ESRD included in the study are presented in Table 1. Haematological parameters of patients from different groups showed similar concentrations of hemoglobin (p = 0.300), similar number of erythrocytes (p = 0.564) and values of mean corpuscular volume (MCV) (p = 0.061), as well as similar number of leukocytes (p = 0.257) (Table 1). No significant differences were determined among patients from different groups concerning the indicators of uremia in serum, concentration of urea (p = 0.448), creatinine (p = 0.784) and uric acid (p = 0.422) (Table 1). The patients in group III, whose ferritin concentration was above 601 µg/L, had the highest concentration of serum iron (p < 0.01) (Table 1). Correlation analysis determined a significant positive relationship between the amount of serum ferritin and iron concentration (r = 0.444, p < 0.05).
During the study, the highest values of unbound iron binding capacity (UIBC) 42 µmol/L (range 36 - 73.3) were measured in serum of patients from first group and they decreased reciprocally to the values of ferritin (r = −0.687, p < 0.001) up to 26.5 µmol/L (range 9.3 - 35.4) in serum of patients from group III (p < 0.001) (Figure 1). This confirms that serum ferritin is a direct measure of iron overload in the body. In addition, the highest concentration of total iron binding capacity (TIBC) was obtained in the serum of patients from first group,
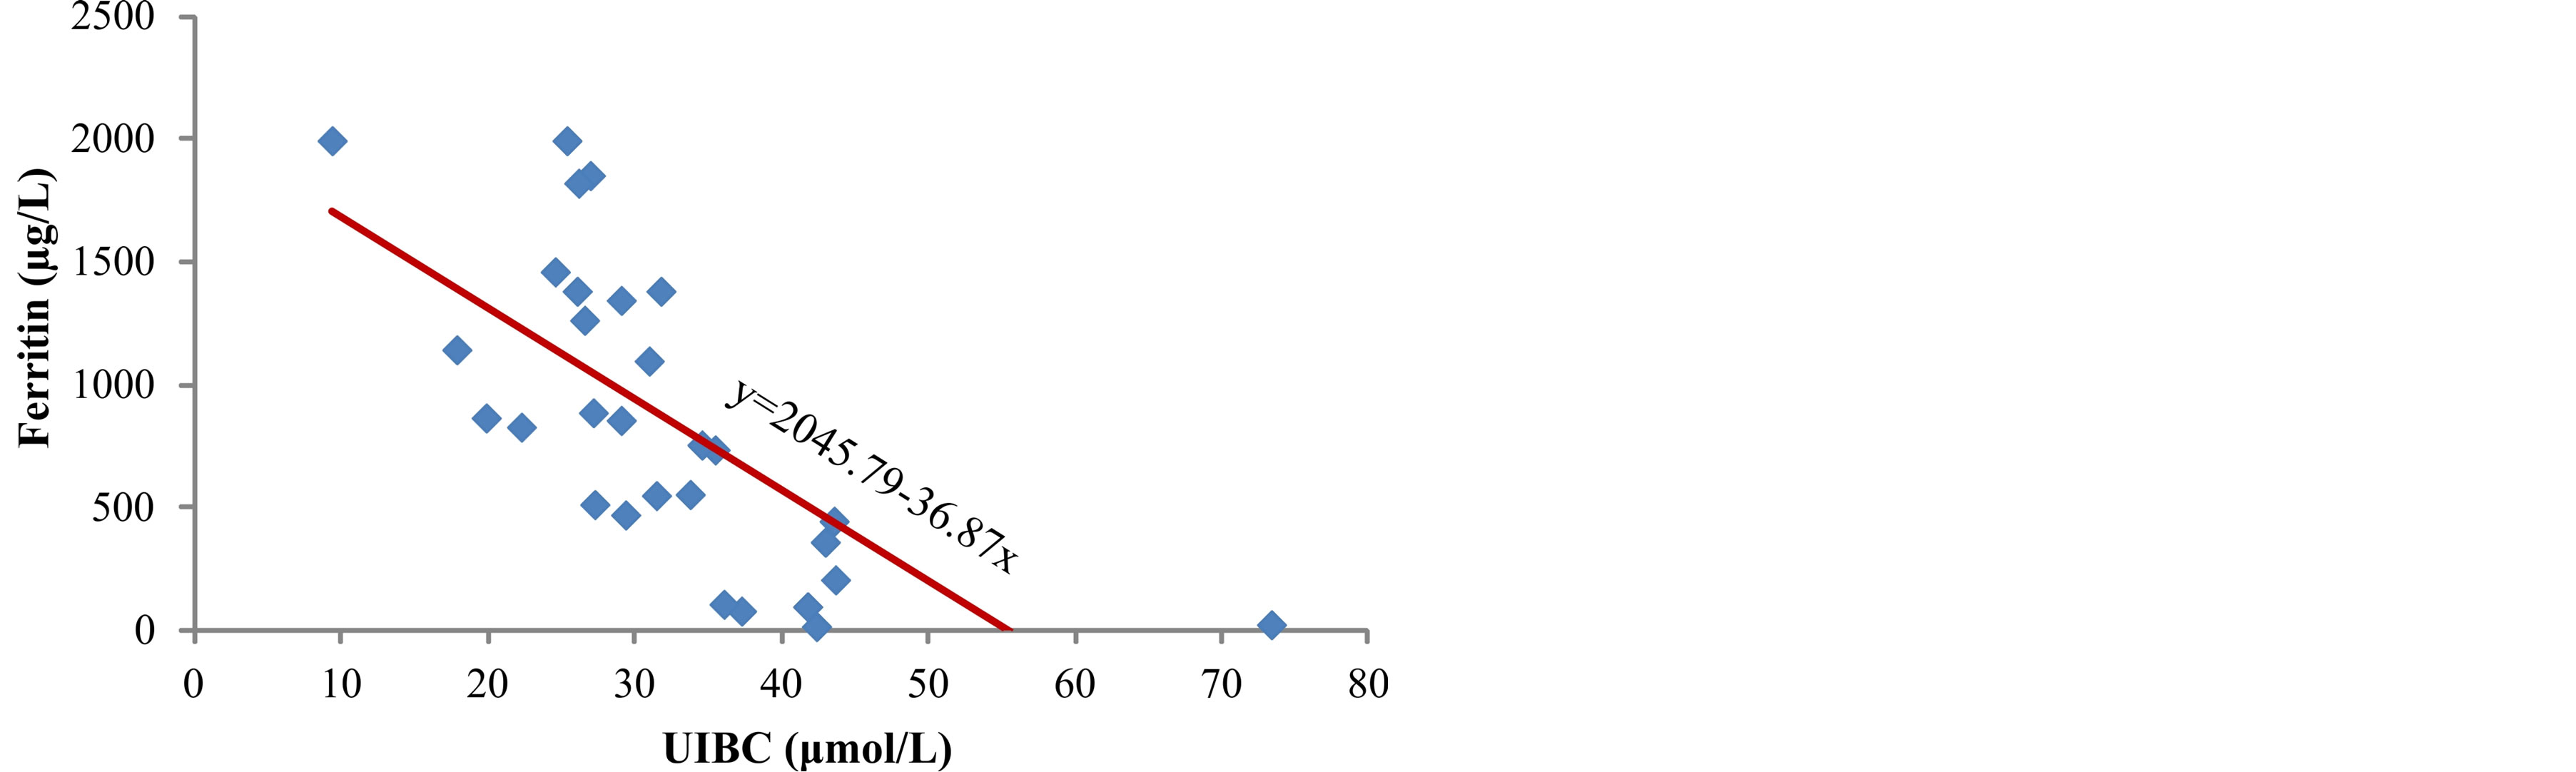
Figure 1. Correlation between serum ferritin levels and UIBC in hemodialysis patients.
49.3 µmol/L (range 45.4 - 75.1), while it was significantly lower, 33.8 µmol/L (range 27.7 - 45.9) in serum of patients whose ferritin concentrations were above 601 µg/L (p = 0.001) (Table 1). The highest percentage of transferrin saturation index (TSAT), calculated from serum iron and total binding capacity, which shows the capacity of transferrin to bind and transport available iron, was determined in serum of patients with the highest concentration of ferritin (group III) (p < 0.05) (Table 1).
The lowest level of total hydroperoxides (ROOH), as early markers of lipid peroxidation, was measured in serum of patients from group I, 6.2 (range 2.9 - 7.9) µmol/L (Table 2). The concentration of ROOH increased parallel to the increase in serum ferritin concentration (r = 0.503, p < 0.01) (Figure 2) and it reached the highest level in patients from group III, 8.4 (range 7.3 - 8.9) µmol/L (p < 0.001) (Table 2). The concentration of malondialdehyde, final product of lipid peroxidation, in serum of patients was significantly increased from group I to group III (p < 0.001) (Table 2), parallel to the increase in ferritin concentration (r = 0.672, p < 0.001) (Figure 3). The data obtained in our study show positive correlation
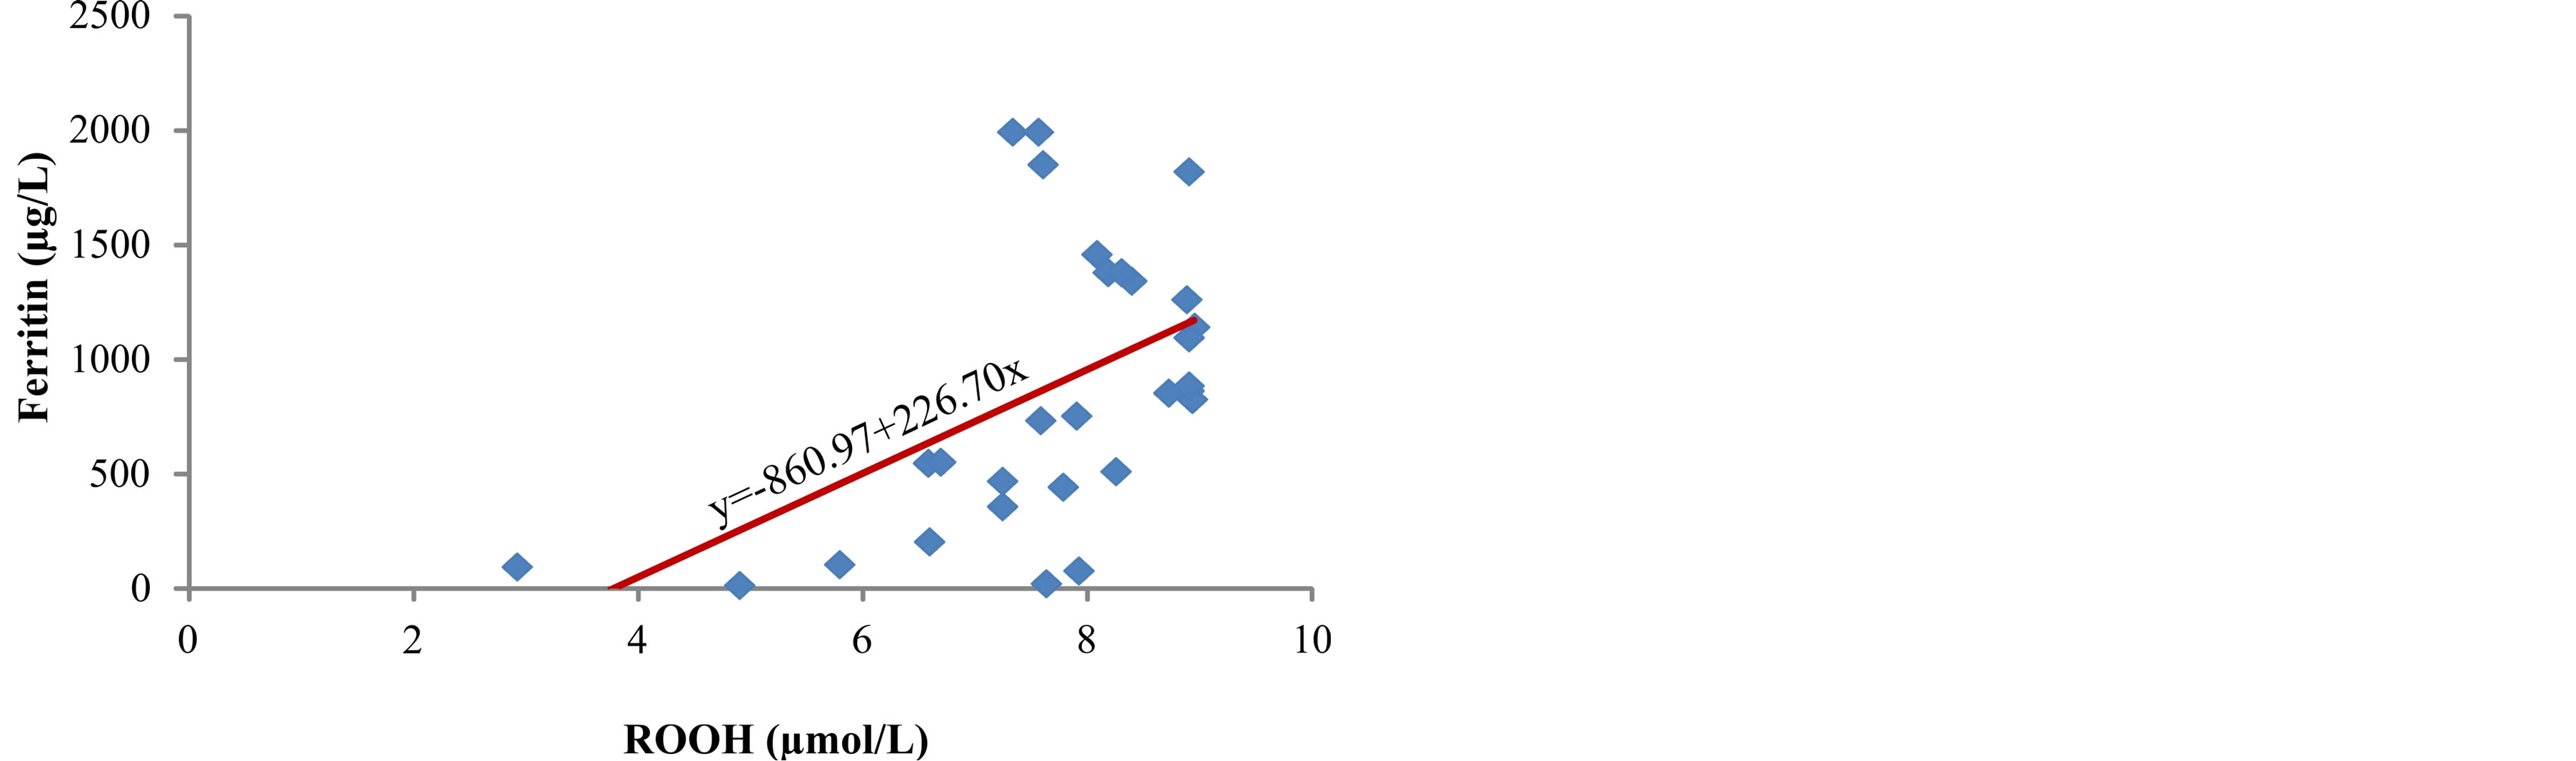
Figure 2. Correlation between serum ferritin and ROOH.
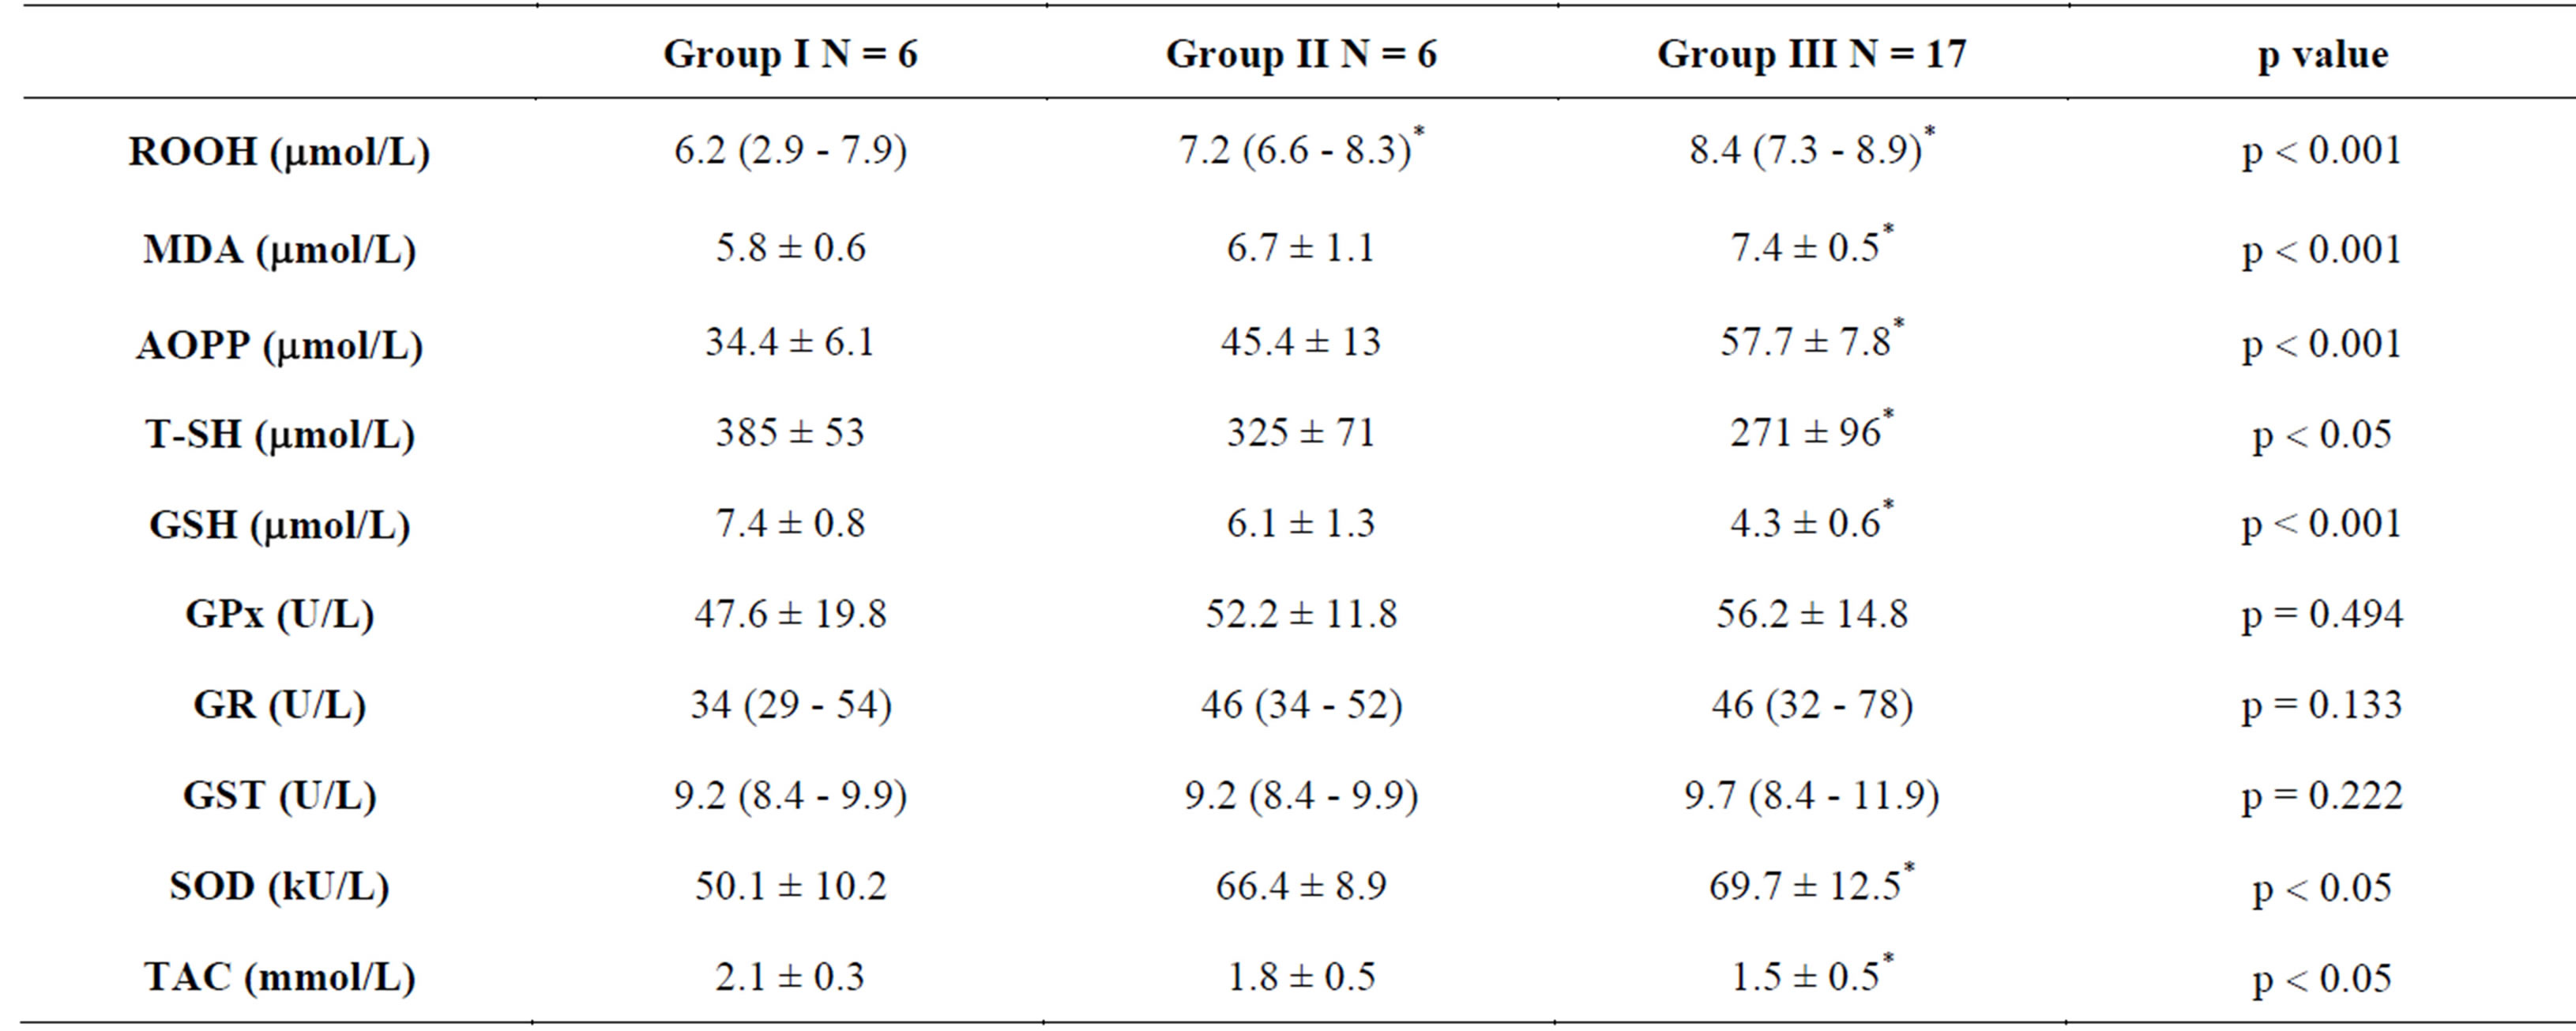
Table 2. Serum oxidative stress markers in hemodialysis patients.
between concentration of iron in serum and products of lipid peroxidation, ROOH (r = 0.513, p < 0.01) (Figure 4) and MDA (r = 0.402, p < 0.05) (Figure 5). The markers of oxidative protein damage were determined by advanced oxidation protein products (AOPP) in the serum of patients. The obtained results show a significantly higher concentration of AOPP in serum of patients whose ferritin concentration was above 601 mg/L (group III) (57.7 ± 7.8 µmol/L), compared to group I (p < 0.001) and group II (p < 0.05) (Table 2). Correlation analysis showed positive relationship between serum ferritin and AOPP concentration (r = 0.592, p = 0.001) (Figure 6), as well as between serum iron concentration and AOPP (r = 0.460, p < 0.05) (Figure 7). Patients with the highest amount of serum ferritin had significantly lower amount of total sulfhydryl groups (T-SH) (p < 0.05) (Table 2).
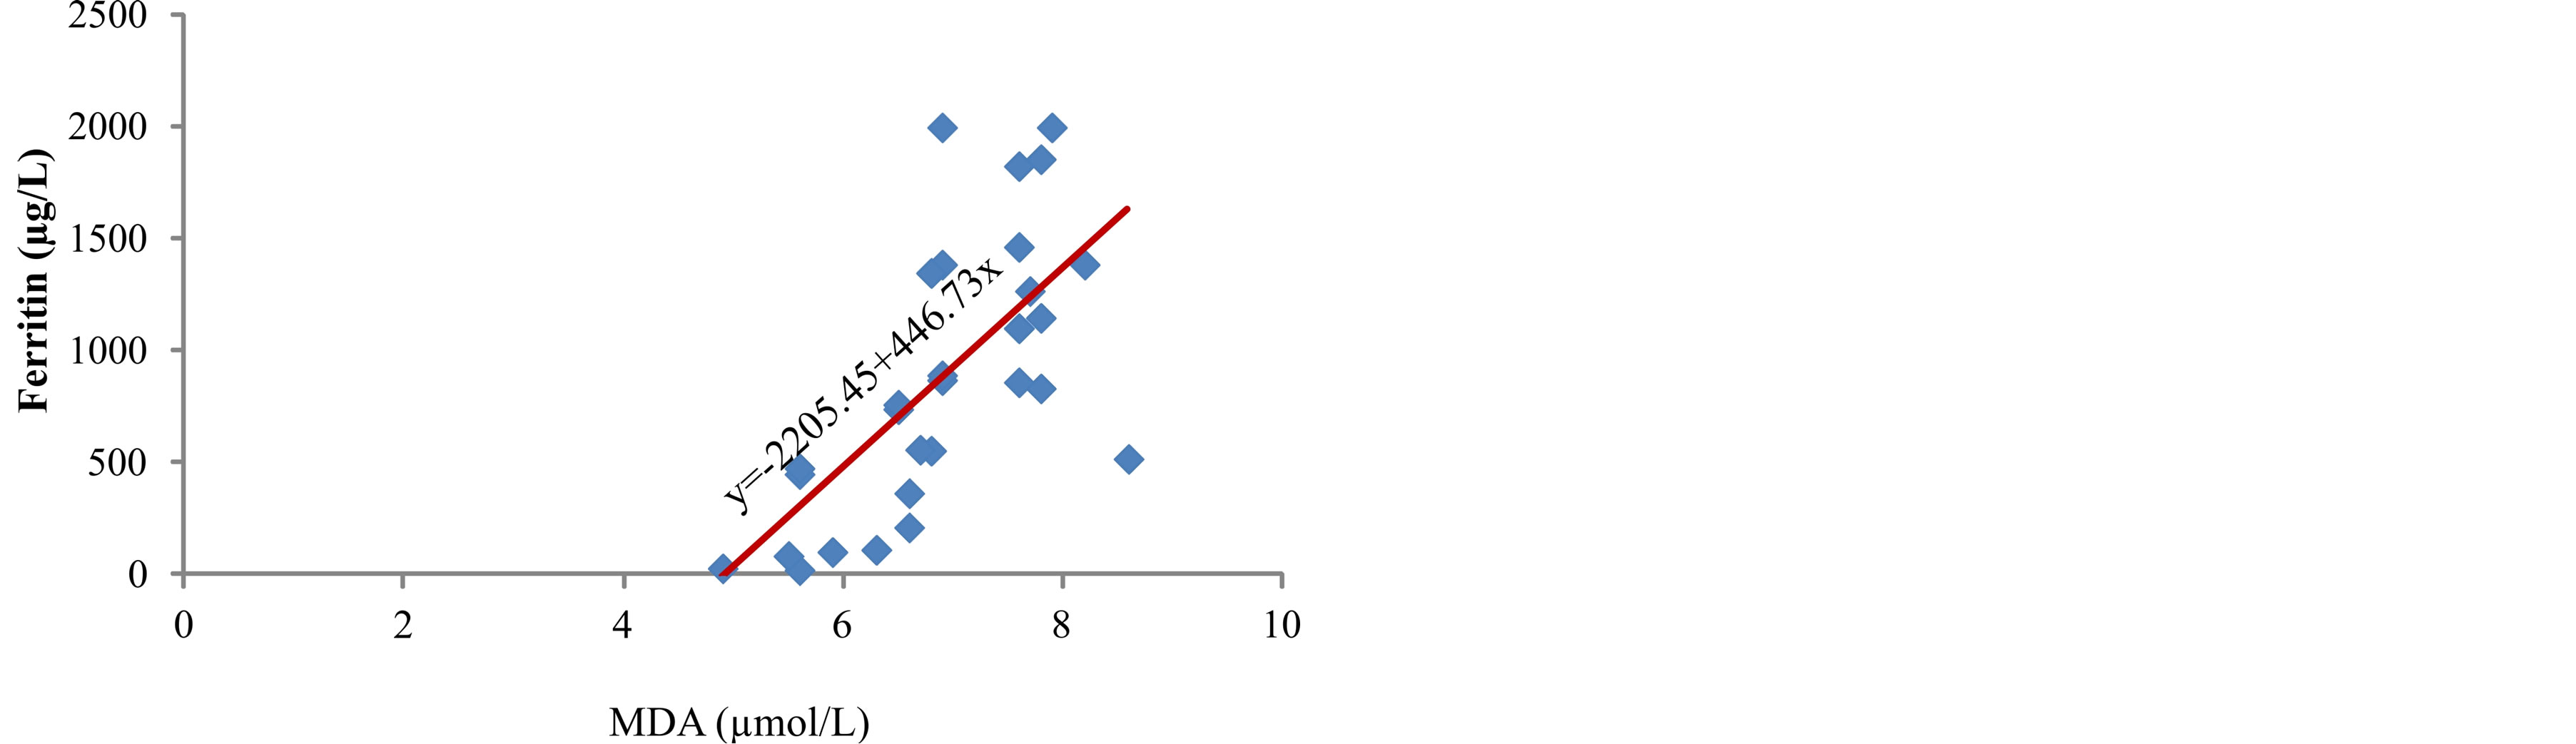
Figure 3. Correlation between ferritin levels and MDA.
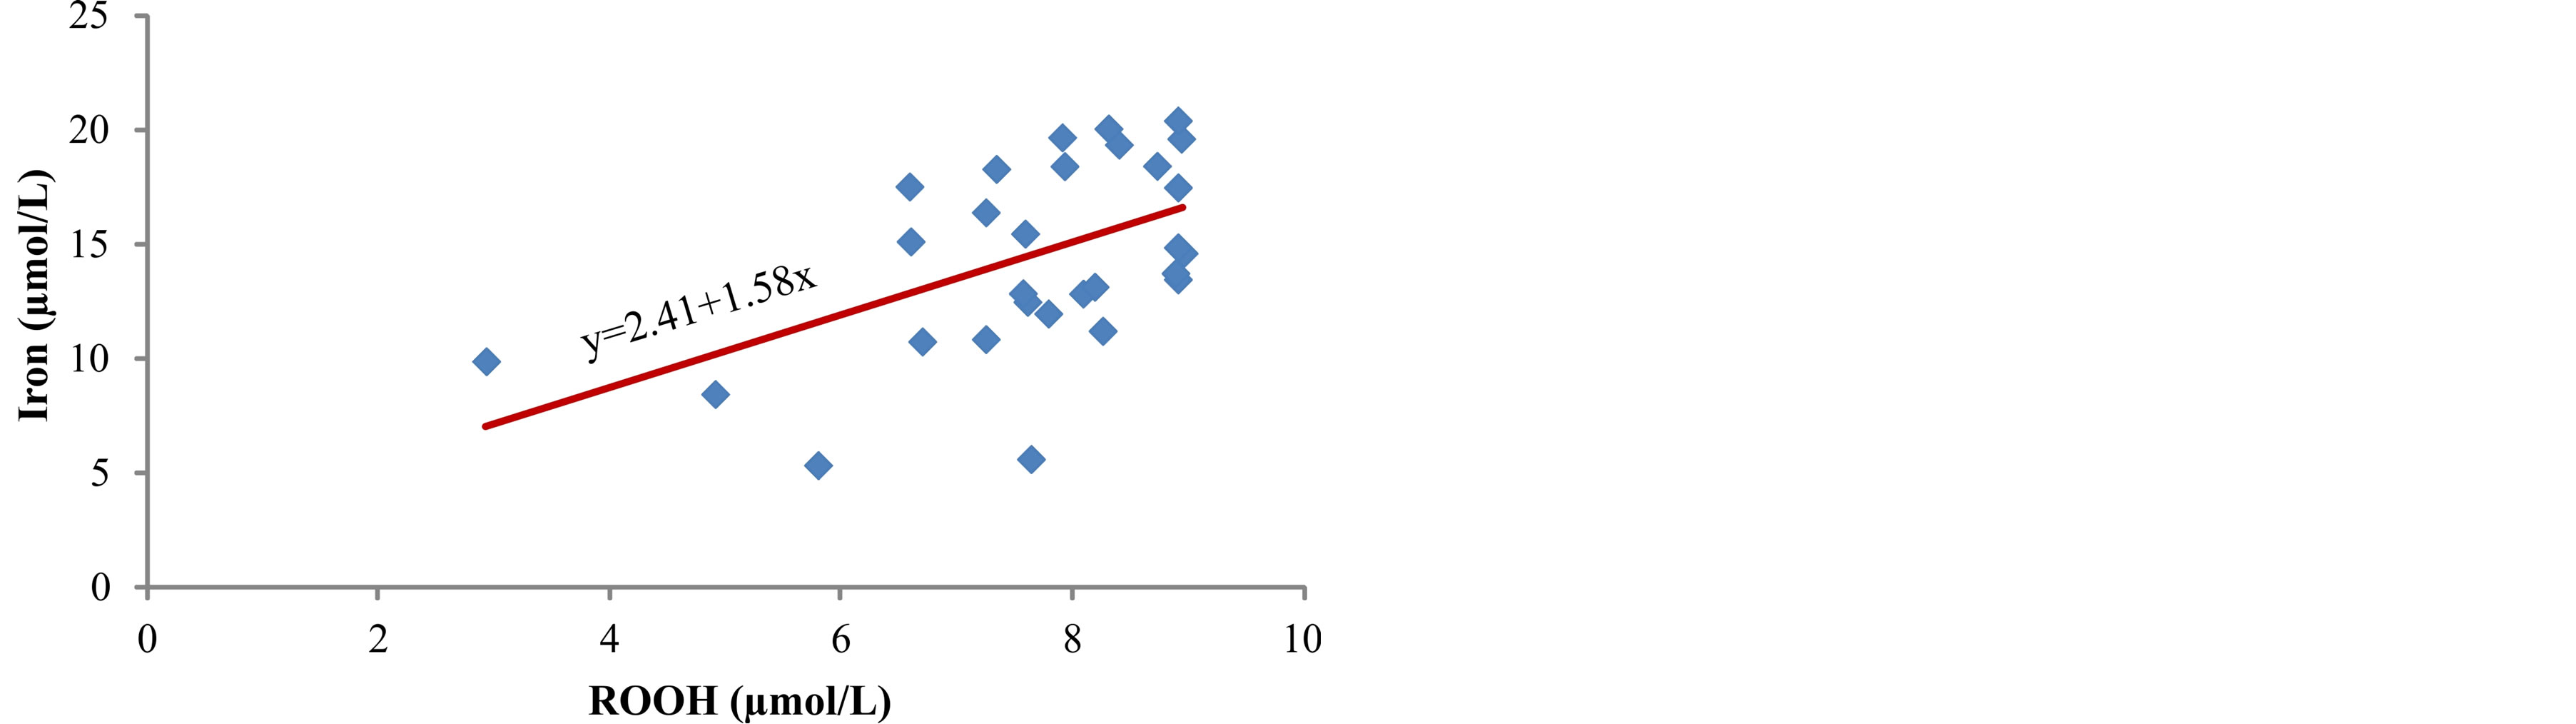
Figure 4. Correlation between iron and ROOH.
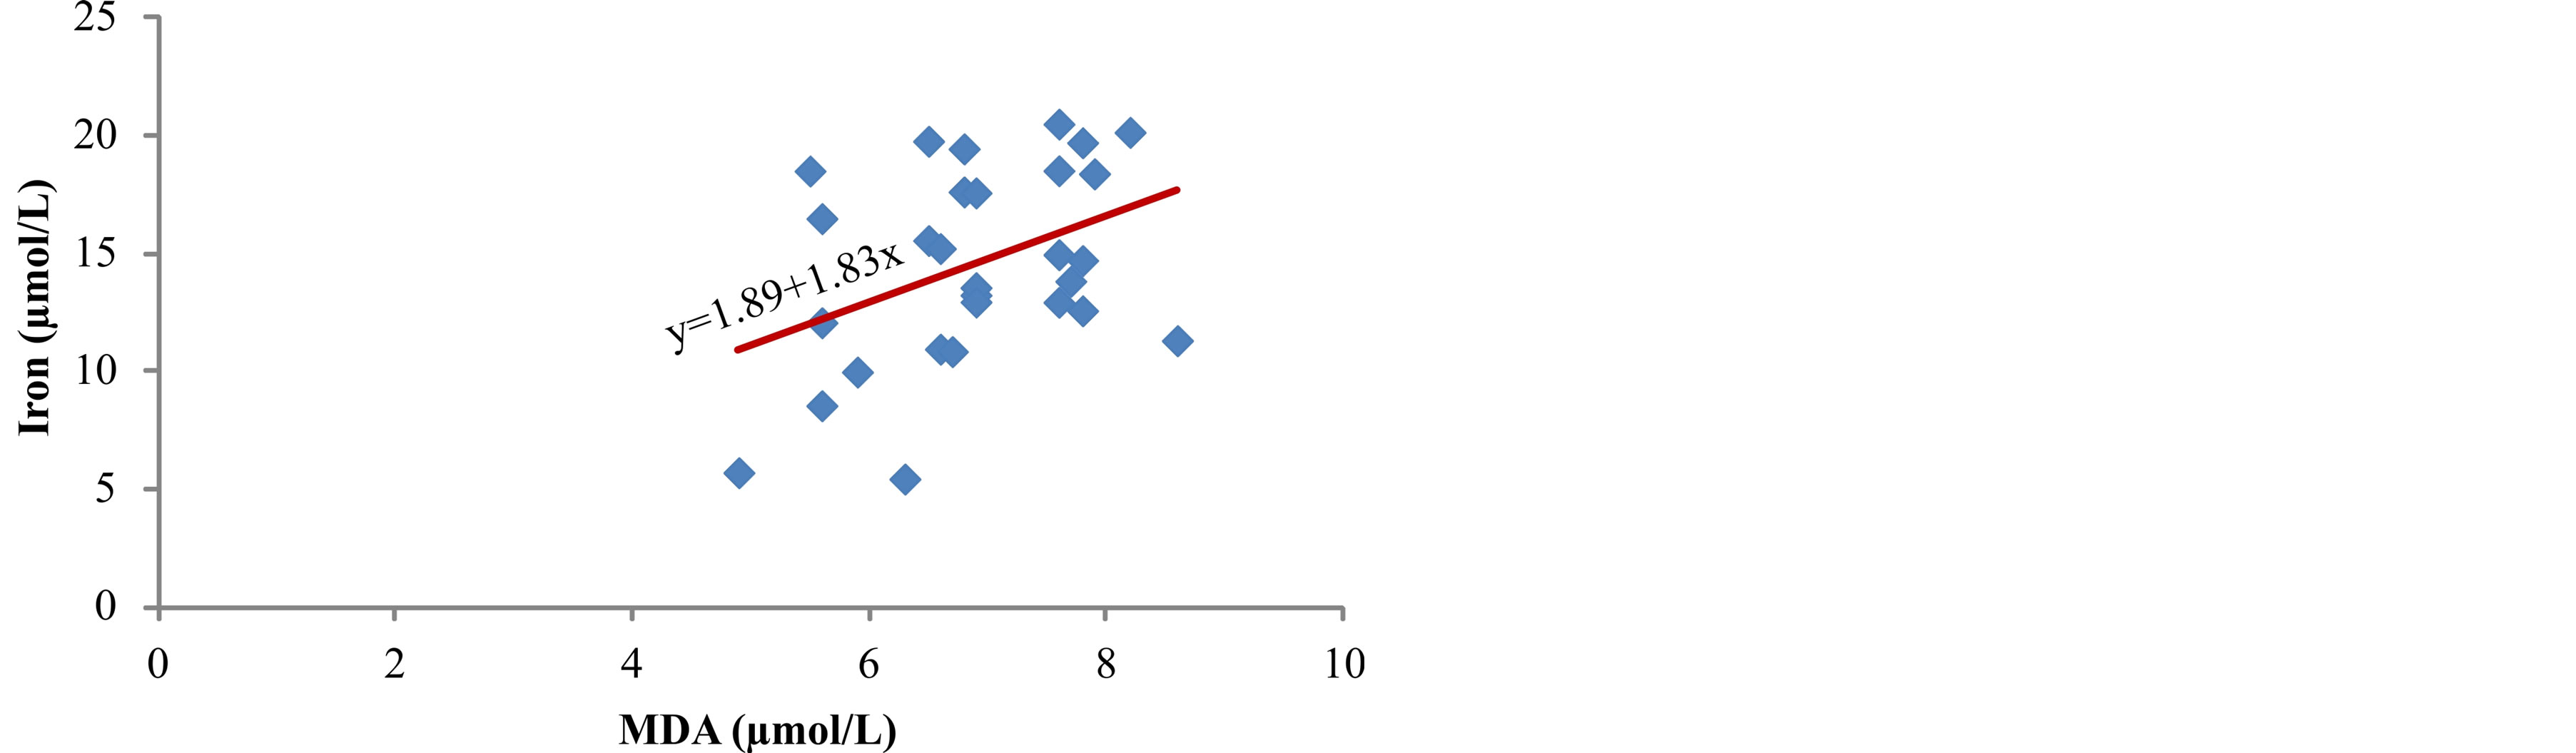
Figure 5. Correlation between iron levels and MDA.
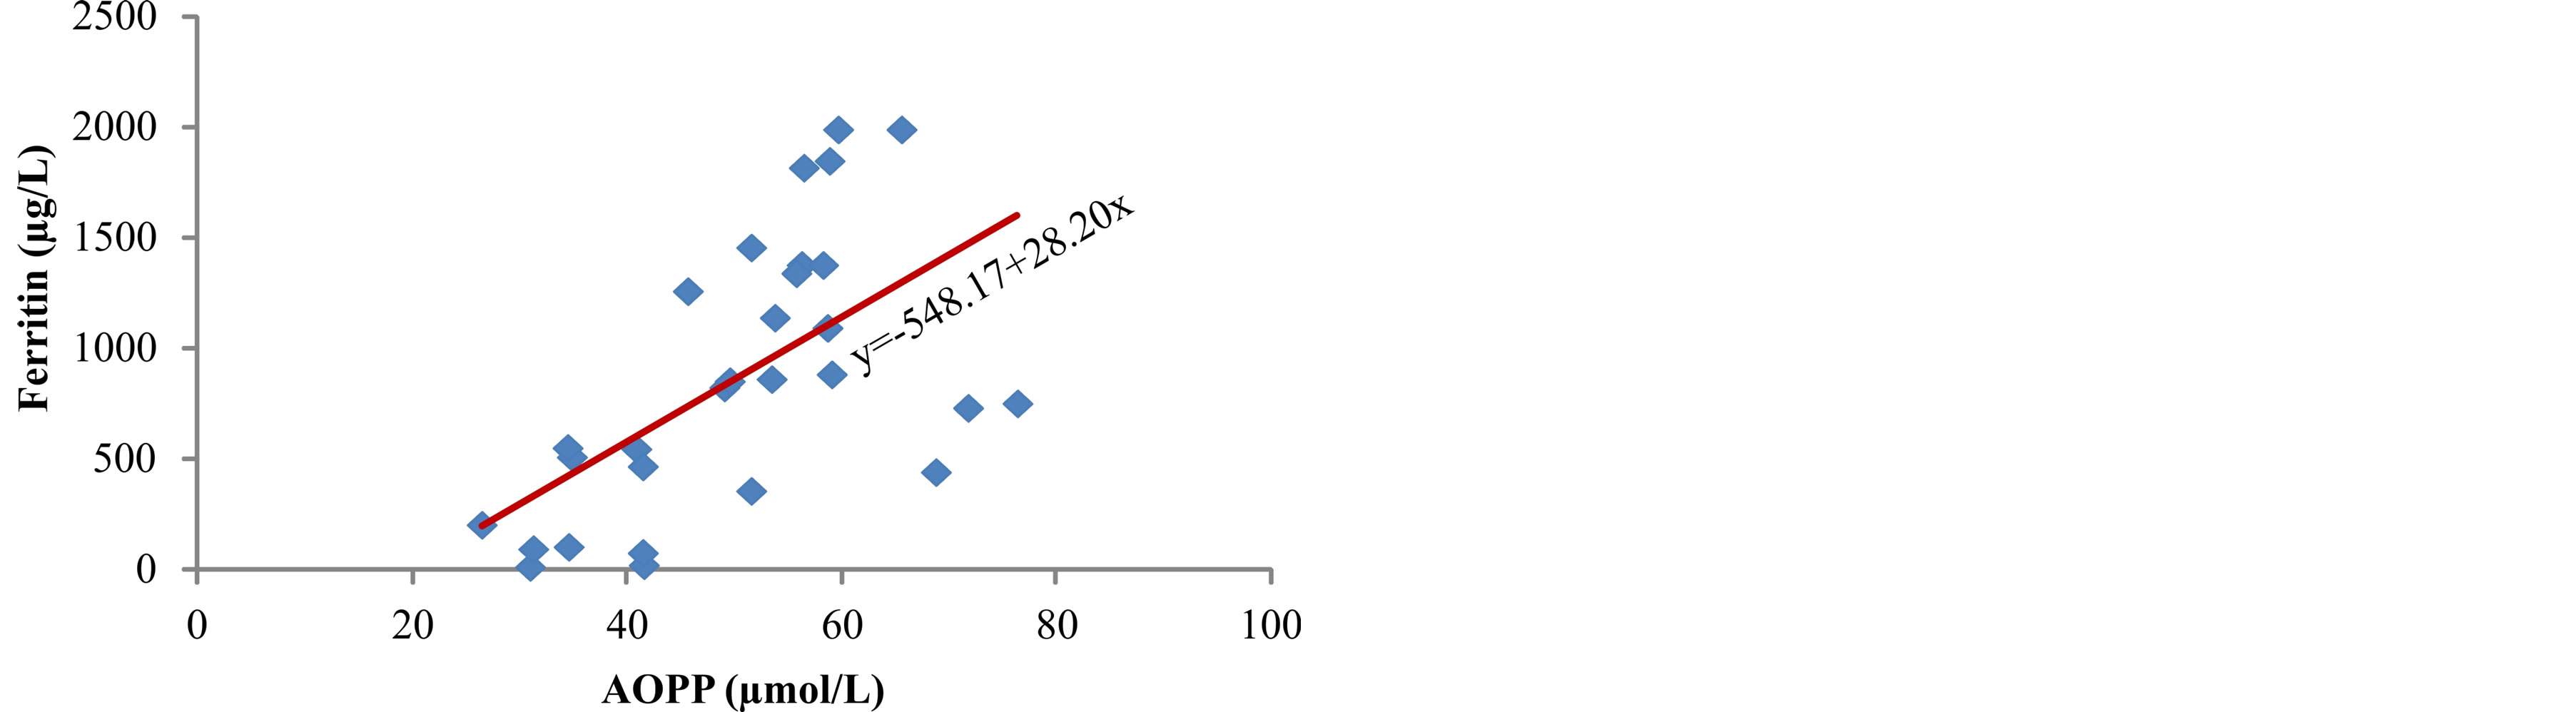
Figure 6. Correlation between ferritin and AOPP.
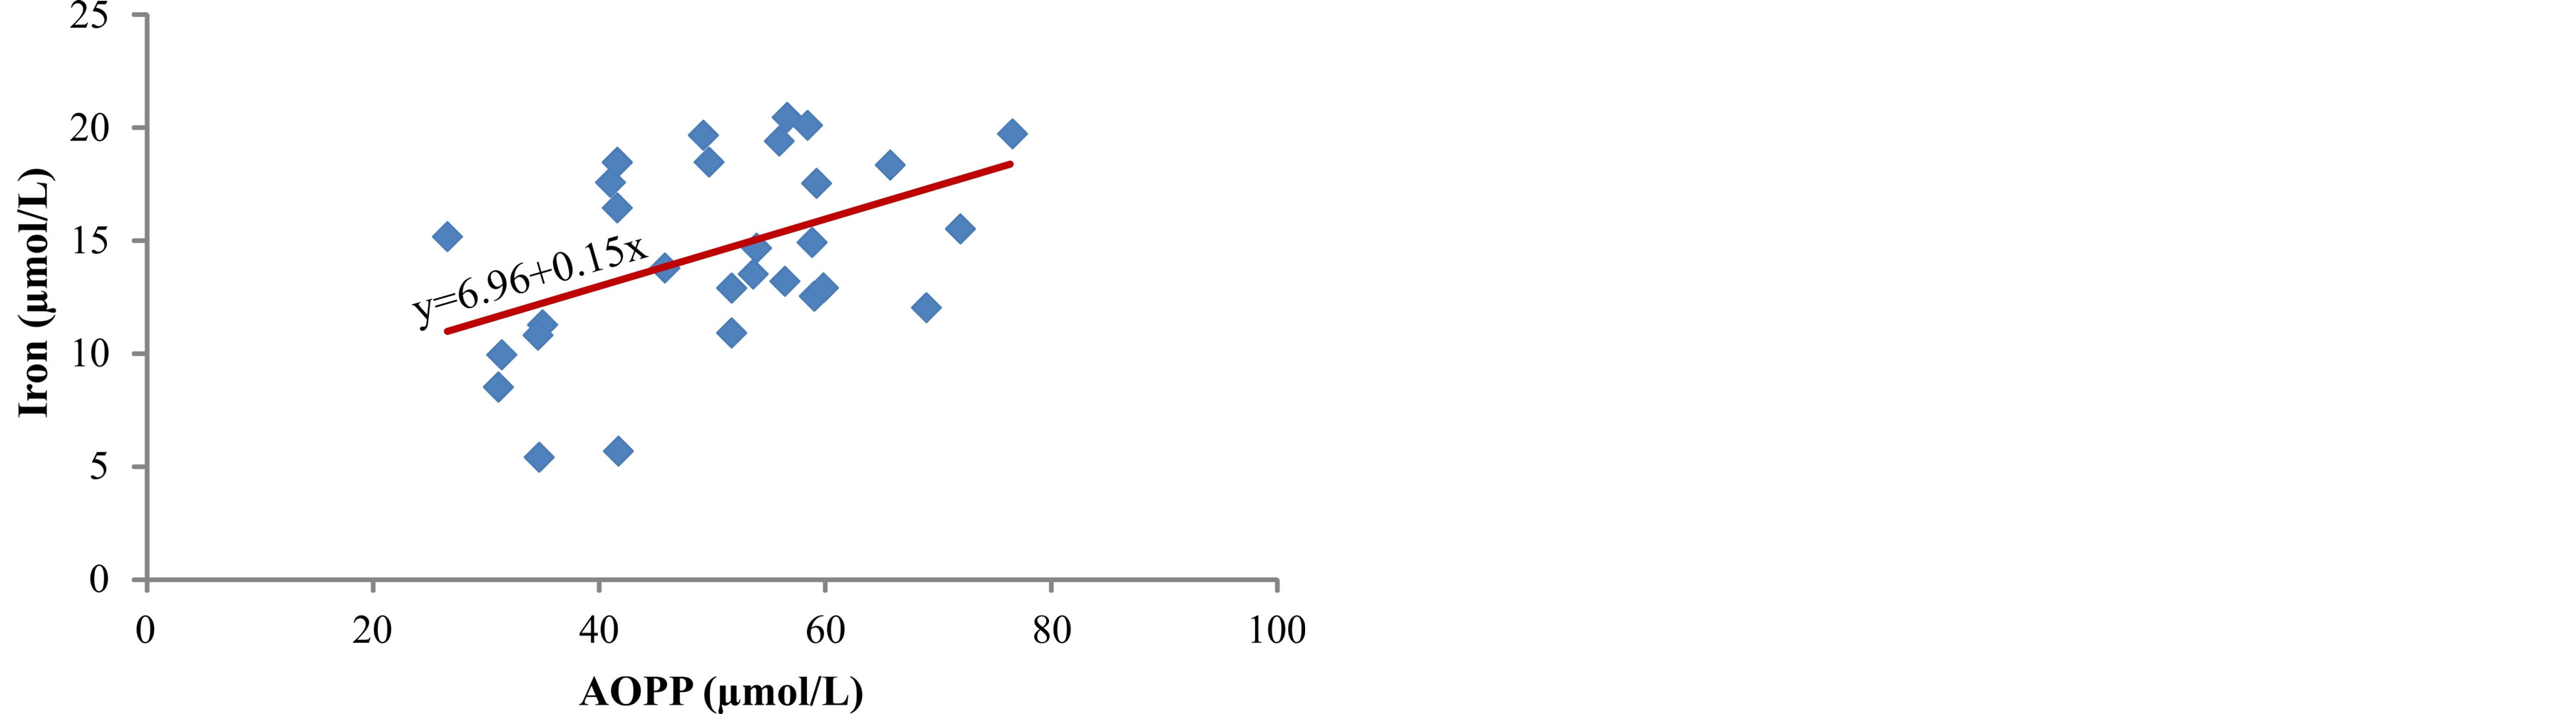
Figure 7. Correlation between iron and AOPP.
The measured activity of superoxide dismutase (SOD) in serum increased from group I to group III (p < 0.05), parallel to the increase in ferritin concentration (Table 2). Lim et al. [19] also obtained higher SOD activity in plasma in patients with higher ferritin concentration, both before and after intravenous administration of iron. It is possible that SOD activity increases in response to oxidative stress caused by harmful effect of higher levels of iron in serum of patients.
The lowest concentration of reduced glutathione (GSH) was measured in serum of patients with the highest ferritin concentration (Table 2), whereas activity of antioxidant enzymes, glutathione peroxidase (GPx) and glutathione S-transferase (GST) did not show significant difference among the tested groups (Table 2). The smallest total antioxidant capacity (TAC) was obtained in serum of patients from group III (p < 0.05) (Table 2).
5. Discussion
Iron plays a vital role in various physiological functions including DNA synthesis, mitochondrial respiration, and oxygen transport. While iron is important physiologically in these actions, in excess the metal can be toxic through oxidative stress [20]. Metal-induced generation of oxygen radicals results in the attack of cellular components involving polyunsaturated fatty acid residues of phospholipids, which are very sensitive to oxidation [21]. Lipid peroxidation (LP) can be initiated by the OH radicals or by perferryl or ferryl derivatives generated in the reactions involving iron,  and H2O2 [22]. Numerous studies have pointed to the possibility that iron plays a role in initiation of lipid peroxidation and to the capability of redox-active iron to catalyze reactions between oxygen and biological molecules [23]. The process of lipid peroxidation can lead to oxidation of plasma lipoproteins and possibly contribute to the development of atherosclerosis, a very common complication in hemodialysis patients [24].
In our study, we measured a significantly higher concentration of early products of lipid peroxidation—ROOH, as well as the final product—MDA, in serum of hemodialysis patients whose serum ferritin was above 601 µg/L (Table 2). Correlation analysis determined a positive relationship between the levels of ferritin and ROOH (r = 0.503, p < 0.01) (Figure 2) and between ferritin and MDA (r = 0.672, p < 0.001) (Figure 3) in the serum of patients. These results are in accordance with the results obtained by other researchers [3,9] who have also determined that intravenous administration of iron in hemodialysis patients is followed by increased concentration of lipid peroxidation products in plasma. These results probably show that repeated intravenous iron supplementation contributes to the formation of redox-active iron which can have pro-oxidative effect on the one hand, and they also point to high sensitivity of lipids to oxidation on the other hand. Correlation analysis showed a significant positive reciprocity between iron concentration in serum and products of lipid peroxidation, ROOH (r = 0.513, p < 0.01) (Figure 4) and MDA (r = 0.402, p < 0.05) (Figure 5), which probably points to the possibility that higher concentrations of serum iron can increase the process of lipid peroxidation. Similar results were obtained by Slahudeen et al. [25] who showed that high level of serum iron, usually associated with high TSAT, can be a catalyzer of lipid peroxidation. Higher serum ferritin levels in patients from group III, followed by higher concentration of ROOH and MDA, compared to other two groups, probably indicates that these patients have insufficient compensatory mechanisms for iron binding, which results in iron overload and deterioration in already present oxidative stress in patients undergoing hemodialysis.
The examination of lipid status in serum of our patients showed a status characterized by total cholesterol (TC) concentration within normal limits [26], lower concentration of cholesterol in high-density lipoproteins (HDL-H), higher concentration of cholesterol in lowdensity lipoproteins (LDL-H), somewhat higher concentration of triacylglycerol (TG), but no significant difference was determined in the concentration of total cholesterol, HDL-H, LDL-H and triglycerides in serum of different groups (Table 1). Numerous researches indicate that the change in lipid status in dialysis patients with ESRD influences the development and progression of atherosclerosis [27].
Iron ions can participate in oxidative modification of low-density lipoproteins (LDL) through reactive oxygen species, which contributes to the development of atherosclerosis in hemodialysis patients [28]. Factors which point to lipoprotein oxidation in circulation in hemodialysis patients are: increased concentration of lipid peroxidation markers, ROOH, conjugated dienes, and MDA [3,9], presence of oxidized LDL in circulation [29], as well as increased serum titer of antioxidized LDL antibodies [28]. Taki and associates [30] determined a significant positive correlation between lipid peroxides and malondialdehyde and coronary artery calcification score in hemodialysis patients.
In hemodialysis patients with ESRD plasma proteins are very sensitive and susceptible to the effects of free radicals and advanced oxidation protein products (AOPP) are markers of oxidative protein damage [31]. Different types of reactive radicals can oxidize amino acids and proteins which lead to functional changes, reduction or loss of metabolic, catalytic or immunological protein activity. The testing of measured concentrations of AOPP in the serum of our patients showed a higher concentration of AOPP in patients with higher level of serum ferritin (p < 0.001) (Table 2), as well as positive correlation between serum ferritin and AOPP (r = 0.592, p = 0.001) (Figure 6) and between concentration of serum iron and AOPP (r = 0.460, p < 0.05) (Figure 7). These results are in accordance with the results obtained by Drüeke et al. [24] who determined an increase in the level of AOPP in plasma of patients with ESRD and showed positive correlation between the levels of advanced oxidation protein products and dosage of intravenous iron, AOPP and serum ferritin, and AOPP and carotid artery intima-media thickness. In addition, Anraku and associates [32] determined that more frequent i.v. application of iron significantly increases the level of AOPP in serum of dialysis patients, as well as positive correlation between AOPP and the level of oxidized albumin. Reduction of T-SH concentration in serum of hemodialysis patients who received i.v. iron (p < 0.05) (Table 2) can be explained by increased consumption of antioxidants, probably due to over saturation of transferrin and release of redoxactive iron which can act as a catalytic factor in the formation of reactive oxygen radicals.
Reduced glutathione and GHS-dependent enzymes, glutathione peroxidase (GPx) and glutathione S-transferase (GST) are important factors in antioxidant defense of the body. Glutathione proxidase activity influences the concentration of H2O2 and other hydroperoxides because of the key role in degradation of the mentioned peroxides. Therefore, in conditions of reduced GPx activity, the concentration of lipid peroxidation products in plasma increases.
The serum of patients with highest level of ferritin contained significantly lower concentration of GSH (p < 0.001) (Table 2), whereas the measured activity of antioxidant enzymes GPx and GST was not significantly different in the tested groups (Table 2). The results of our study show that patients with the highest amount of ferritin also have the lowest level of GSH in serum (Table 2) which points to increased oxidative stress in patients with higher concentration of iron in serum. It is possible that intravenous administration of iron requires higher amount of GSH for antioxidant enzyme activity and defense against free radicals which aggravate oxidative stress and oxidative damage in hemodialysis patients.
Higher level of ROOH, MDA and AOPP on the one hand, and lower concentration of T-SH, GSH and total antioxidant capacity (TAC) on the other hand, in serum of patients with higher concentration of ferritin, can probably be explained by over saturation of transferrin and other iron-sequestrating plasma proteins, and by iron overload in the body, with concurrent reduction of antioxidant defense. Iron overload in hemodialysis patients can raise pro-oxidant activity in plasma and increase the demand for antioxidants.
6. Conclusion
The results of our study indicate that patients with ESRD on hemodialysis, whose treatment included repeated intravenous administration of iron, and who had the highest concentration of serum iron and ferritin, also had the highest level of lipid and protein oxidation products in serum, as well as the smallest amount of T-SH, GSH and activity of GPx and GST. Based on our analyses, it is possible that iron supplementation in hemodialysis patients can lead to iron overload of the body consequently contributing to the formation of free oxygen radicals and initiation of the process of lipid peroxidation. The imbalance between the formation and removal of reactive oxygen species is a probable factor that contributes to the occurrence of complications in patients undergoing hemodialysis.
REFERENCES
- C. Libetta, V. Sepe, P. Esposito, F. Galli and A. Dal Canton, “Oxidative Stress and Inflammation: Implications in Uremia and Hemodialysis,” Clinical Biochemistry, Vol. 44, No. 14-15, 2011, pp. 1189-1198. http://dx.doi.org/10.1016/j.clinbiochem.2011.06.988
- M. Morena, S. Delbosc, A. M. Dupuy, B. Canaud and J. P. Cristol, “Overproduction of Reactive Oxygen Species in End-Stage Renal Disease Patients: A Potential Component of Hemodialysis-Associated Inflammation,” Hemodialysis International, Vol. 9, No. 1, 2005, pp. 37-46. http://dx.doi.org/10.1111/j.1492-7535.2005.01116.x
- Z. M. Dimitrijevic, T. P. Cvetkovic, V. M. Djordjevic, D. D. Pavlovic, N. Z. Stefanovic, I. R. Stojanovic, G. J. Paunovic and R. M. Velickovic-Radovanovic, “How the Duration Period of Erythropoietin Treatment Influences the Oxidative Status of Hemodialysis Patients,” International Journal of Medical Sciences, Vol. 9, No. 9, 2010, pp. 808-815. http://dx.doi.org/10.7150/ijms.4910
- L. Del Vecchio, F. Locatelli and M. Carini, “WHAT WE Know about Oxidative Stress in Patients with Chronic Kidney Disease on Dialysis-Clinical Effects, Potential Treatment, and Prevention,” Seminars in Dialysis, Vol. 24, No. 1, 2011, pp. 56-64. http://dx.doi.org/10.1111/j.1525-139X.2010.00819.x
- D. W. Grabe, “Update on Clinical Practice Recommendations and New Therapeutic Modalities for Treating Anemia in Patients with Chronic Kidney Disease,” American Journal of Health-System Pharmacy, Vol. 64, Suppl. 8, 2007, pp. 8-14. http://dx.doi.org/10.2146/ajhp070182
- M. P. Kooistra, S. Kersting, I. Gosriwatana, S. Lu, J. Nijhoff-Schutte, R. C. Hider and J. J. Marx, “Nontransferrin-Bound Iron in the Plasma of Haemodialysis Patients after Intravenous Iron Saccharate Infusion,” European Journal of Clinical Investigation, Vol. 32, Suppl. 1, 2002, pp. 36-41. http://dx.doi.org/10.1046/j.1365-2362.2002.0320s1036.x
- K. Jomova and M. Valko, “Advances in Metal-Induced Oxidative Stress and Human Disease,” Toxicology, Vol. 283, No. 2-3, 2011, pp. 65-87. http://dx.doi.org/10.1016/j.tox.2011.03.001
- M. A. Sochaski, W. J. Bartfay, S. R. Thorpe, J. W. Baynes, E. Bartfay, D. C. Lehotay and P. P. Liu, “Lipid Peroxidation and Protein Modification in a Mouse Model of Chronic Iron Overload,” Metabolism, Vol. 51, No. 5, pp. 645-651. http://dx.doi.org/10.1053/meta.2002.30530
- J. Mimić-Oka, A. Savić-Radojević, M. Pljesa-Ercegovac, M. Opacić, T. Simić, N. Dimković and D. V. Simić, “Evaluation of Oxidative Stress after Repeated Intravenous Iron Supplementation,” Renal Failure, Vol. 27, No. 3, 2005, pp. 345-351.
- J. Nourooz-Zadeh, J. Tajaddini-Sarmadi and S. P. Wolff, “Measurement of Plasma Hydroperoxide Concentrations by the Ferrous Oxidation-Xylenol Orange Assay in Conjunction with Triphenylphosphine,” Analytical Biochemistry, Vol. 220, No. 2, 1994, pp. 403-409. http://dx.doi.org/10.1053/meta.2002.30530
- A. M. Jentzsch, H. Bachmann, P. Furst and H. K. Biesalski, “Improved Analysis of Malondialdehyde in Human Body Fluids,” Free Radical Biology and Medicine, Vol. 20, No. 2, 1996, pp. 251-256. http://dx.doi.org/10.1016/0891-5849(95)02043-8
- B. Anderstam, B. Ann-Christin, A. Valli, P. Stenvinkel, B. Lindholm and M. E. Suliman, “Modification of the Oxidative Stress Biomarker AOPP Assay: Application in Uremic Samples,” Clinica Chimica Acta, Vol. 393, No. 2, 2008, pp. 114-118. http://dx.doi.org/10.1016/j.cca.2008.03.029
- E. Beutler, O. Duron and B. M. Kelly, “Improved Method for the Determination of Blood Glutathione,” Journal of Laboratory and Clinical Medicine, Vol. 61, No. 3, 1963, pp. 882-888.
- H. P. Misra and I. Fridovich, “The Role of Superoxide Anion in the Autoxidation of Epinephrine and a Simple Assay for Superoxide Dismutase,” The Journal of Biological Chemistry, Vol. 247, No. 10, 1972, pp. 3170- 3175.
- J. T. Rotruck, A. L. Pope, H. E. Ganther, A. B. Swanson, D. G. Hafeman and W. G. Hoekstra, “Selenium: Biochemical Roles as a Component of Glutathione Peroxidase,” Science, Vol. 179, No. 4073, 1973, pp. 588-590. http://www.jstor.org/stable/1735448 http://dx.doi.org/10.1126/science.179.4073.588
- M. Habdous, M. Vincent-Viry, S. Visvikis and G. Siest, “Rapid Spectrophotometric Method for Serum Glutathione S-Transferase Activity,” Clinica Chimica Acta, Vol. 326, No. 1-2, 2002, pp. 131-142. http://dx.doi.org/10.1016/S0009-8981(02)00329-7
- E. Racker, “Glutathione Reductase from Baker’s Yeast and Beef Liver,” The Journal of Biological Chemistry, Vol. 217, No. 2, 1955, pp. 855-865. http://www.jbc.org/content/217/2/855
- O. Erel, “A Novel Automated Method to Measure Total Antioxidant Response against Potent Free Radical Reactions,” Clinical Biochemistry, Vol. 37, No. 2, 2004, pp. 112-119. http://dx.doi.org/10.1016/j.clinbiochem.2003.10.014
- P. S. Lim, Y. H. Wei, Y. L. Yu and B. Kho, “Enhanced Oxidative Stress in Haemodialysis Patients Receiving Intravenous Iron Therapy,” Nephrology Dialysis Transplantation, Vol. 14, No. 11, 1999, pp. 2680-2687. http://dx.doi.org/10.1093/ndt/14.11.2680
- M. Valko, H. Morris and M. T. Cronin, “Metals, Toxicity and Oxidative Stress,” Current Medicinal Chemistry, Vol. 12, No. 10, 2005, pp. 1161-1208. http://dx.doi.org/10.2174/0929867053764635
- K. D. Welch, T. Z. Davis, M. E. Van Eden and S. D. Aust, “Deleterious Iron-Mediated Oxidation of Biomolecules,” Free Radical Biology and Medicine, Vol. 32, No. 7, 2002, pp. 577-583. http://dx.doi.org/10.1016/S0891-5849(02)00760-8
- M. Kruszewski, “Labile Iron Pool: The Main Determinant of Cellular Response to Oxidative Stress,” Mutation Research, Vol. 531, No. 1-2, 2003, pp. 81-92. http://dx.doi.org/10.1016/j.mrfmmm.2003.08.004
- L. Tang, Y. Zhang, Z. Qian and X. Shen, “The Mechanism of Fe(2+)-Initiated Lipid Peroxidation in Liposomes: the Dual Function of Ferrous Ions, the Roles of the Pre-Existing Lipid Peroxides and the Lipid Peroxyl Radical,” Biochemical Journal, Vol. 352, Pt 1, 2000, pp. 27- 36. http://dx.doi.org/10.1042/0264-6021:3520027
- T. Drüeke, V. Witko-Sarsat, Z. Massy, B. DescampsLatscha, A. P. Guerin, S. J. Marchais, V. Gausson and G. M. London, “Iron Therapy, Advanced Oxidation Protein Products, and Carotid Artery Intima-Media Thickness in End-Stage Renal Disease,” Circulation, Vol. 106, No. 17, 2002, pp. 2212-2217. http://dx.doi.org/10.1161/01.CIR.0000035250.66458.67
- A. K. Salahudeen, B. Oliver, J. D. Bower and L. J. Roberts 2nd, “Increase in Plasma Esterified F2-Isoprostanes Following Intravenous Iron Infusion in Patients on Hemodialysis,” Kidney International, Vol. 60, No. 4, 2001, pp. 1525-1531. http://dx.doi.org/10.1046/j.1523-1755.2001.00976.x
- M. Roehrs, J. Valentini, C. Paniz, A. Moro, M. Charao, R. Bulcao, F. Freitas, et al., “The Relationships between Exogenous and Endogenous Antioxidants with the Lipid Profile and Oxidative Damage in Hemodialysis Patients,” BMC Nephrology, Vol. 12, 2011, pp. 59-68. http://dx.doi.org/10.1186/1471-2369-12-59
- F. Cofan, E. Vela, M. Clèries and Collaborative Study Group for Dyslipidemia, “Analysis of Dyslipidemia in Patients on Chronic Hemodialysis in Catalonia,” Atherosclerosis, Vol. 184, No. 1, 2006, pp. 94-102. http://dx.doi.org/10.1016/j.atherosclerosis.2005.03.021
- K. Pawlak, M. Mysliwiec and D. Pawlak, “Oxidized LDL to Autoantibodies against oxLDL Ratio—The New Biomarker Associated with Carotid Atherosclerosis and Cardiovascular Complications in Dialyzed Patients,” Atherosclerosis, Vol. 224, No. 1, 2012, pp. 252-257. http://dx.doi.org/10.1016/j.atherosclerosis.2012.07.011
- M. Tsumura, T. Kinouchi, S. Ono, T. Nakajima and T. Komoda, “Serum Lipid Metabolism Abnormalities and Change in Lipoprotein Contents in Patients with Advanced-Stage Renal Disease,” Clinica Chimica Acta, Vol. 314, No. 1-2, 2001, pp. 27-37. http://dx.doi.org/10.1016/S0009-8981(01)00681-7
- K. Taki, F. Takayama, Y. Tsuruta and T. Niwa, “Oxidative Stress, Advanced Glycation End Product, and Coronary Artery Calcification in Hemodialysis Patients,” Kidney International, Vol. 70, No. 1, 2006, pp. 218-224. http://dx.doi.org/10.1038/sj.ki.5000330
- V. Witko-Sarsat, M. Friedlander, T. Nguyen Khoa, C. Capeillère-Blandin, A. T. Nguyen, S. Canteloup, J. M. Dayer, P. Jungers, T. Drüeke and B. Descamps-Latscha, “Advanced Oxidation Protein Products as Novel Mediators of Inflammation and Monocyte Activation in Chronic Renal Failure,” Journal of Immunology, Vol. 161, No. 5, 1998, pp. 2524-2532. http://www.jimmunol.org/content/161/5/2524
- M. Anraku, K. Kitamura, R. Shintomo, K. Takeuchi, H. Ikeda, J. Nagano, T. Ko, K. Mera, K. Tomita and M. Otagiri, “Effect of Intravenous Iron Administration Frequency on AOPP and Inflammatory Biomarkers in Chronic Hemodialysis Patients: A Pilot Study,” Clinical Biochemistry, Vol. 41, No. 14-15, 2008, pp. 1168-1174. http://dx.doi.org/10.1016/j.clinbiochem.2008.07.007