Journal of Transportation Technologies
Vol.4 No.1(2014), Article ID:42485,6 pages DOI:10.4236/jtts.2014.41010
Study on the Evaluation of the Subsidized Fertilizer Distribution System
Department of Civil Engineering, Faculty of Engineering, University of Indonesia, Depok, Indonesia
Email: nahry@eng.ui.ac.id, ssoehodho@yahoo.com, triana.santi7@gmail.com
Received September 5, 2013; revised October 7; 2013; accepted November 3, 2013
ABSTRACT
In order to ensure the delivery of the subsidized fertilizer to the farmer in “6 precision-goals”, i.e., quantity precision, type precision, time precision, place precision, quality precision and price precision in accordance to regulated Highest Retail Sale Price, the government has regulated the distribution system of subsidized fertilizer from the plant to the farmers by form of regulation issued by Indonesian Ministry of Trading. The purpose of this research is to evaluate the existing distribution system of subsidized fertilizer which is managed by one of the Public Service Obligation State-Owned Companies (PSO-SOC). The evaluation is carried out by comparing the cost of the existing distribution system with the proposed distribution system. Cost optimization of the proposed system makes use of Mixed Integer Linier Programing (MILP). Optimization is performed by restructuring the cluster and distribution warehouse, allowing through trips from plant directly to distributor’s warehouse, and skipping the producer’s warehouse storing. The proposed cluster restructuring can reduce the existing cost to 94% - 98%, while through trips can reduce the total cost to 61% - 72%. In case where through trips is allowed and producer’s warehouse is in operation and functioned as a buffer, the total cost is reduced to 64% - 78% from the existing cost. Based on the optimization result, it is concluded that the existing subsidized fertilizer distribution system could be improved by allowing through trips, while existing producer’s warehouse is still in operation as the buffer warehouse to ensure that the minimum stock is fulfilled. It is noted, however, that this system requires adequate information technology concurrently.
Keywords:Cost Efficiency; Distribution; Subsidized Fertilizer
1. Introduction
The government is attaining to improve the productivity and quality of agricultural product in order to sustain the national food security. Fertilizer is one of the main supporting elements in the improvement of agricultural productivity. The distribution of the subsidized fertilizer is carried out by one of the Public Service Obligation State-Owned Companies (PSO-SOC) that is state-owned company which is obliged to serve and provide service and goods commodities required by public. In reality, however, there are problems occurring due to failure of the distribution system resulting failure in providing subsidized fertilizers to farmers at given time, place and quantity.
The distribution system is closely related to logistic management that is process of transfer and store inventories at given time, place and ownership at the lowest possible cost [1]. Distribution cost in the subsidized fertilizer distribution system is affecting total subsidy which government has to bear and provide to PSO-SOC. The total subsidy is calculated based on delta amount of total actual cost of subsidized goods spent by PSO-SOC from production until it is received by end-user less than its Highest Retail Sale Price.
In order to ensure the delivery of the fertilizer to the farmer in “6 precision-goals”, i.e., quantity precision, type precision, time precision, place precision, quality precision and price precision in accordance to the regulated Highest Retail Sale Price, the government has regulated the distribution system of subsidized fertilizer from its plant to the farmers by form of regulation issued by Indonesian Ministry of Trading as shown in the following flow chart (Figure 1).
Based on Figure 1, it is noted that there are several distribution steps whereby in each step there will be loading-unloading, storing and transporting processes. Those activities are time-consuming and costly, therefore, causing inefficiency of distribution system and leading to increase of distribution cost.
Previous researches on freight distribution system concern mostly on private companies. Their concerns are mostly for reducing distribution cost. Hindi, K. S., Basta, T., and Pienkosz, K. [2] proposed a model for locating distribution centers of a two-stage distribution system which minimizes total cost. They are concerned with the fixed cost for opening the distribution centers and also the operating cost.
Tsao, Y. C. and Lu, J. C. [3] studied an integrated facility location and inventory allocation problem considering transportation cost discounts. Two types of transportation discounts are quantity discounts for inbound transportation cost and distance discounts for outbound transportation cost. Their proposed method integrated facility costs, inventory costs, transportation costs and ordering costs. The key decisions of their model are where to locate the regional distribution centers, how to assign retail stores to regional distribution centers, and how to set the inventory policy at different locations to minimize the total network cost.
Wisetjindawata, W., Yamamotoa, K. and Marchalb, F. [4] proposed an extension of a multi-agent transport modeling system which dealt with the behavior of each individual actor in the freight distribution system, particularly the interactions amongst freight agents. It modeled the links between suppliers and receivers of commodities.
Other important issues which were raised to improve the efficiency of commodity distribution system are the use of logistics information systems [5] and the electronic trading [6].
Even fertilizer PSO-SOC is merely not a private company, it indeed has responsibility to improve the efficiency of its distribution system in order to reduce government subsidy.
The purpose of this research is to evaluate efficiency of existing subsidized fertilizer distribution system which is implemented by PSO-SOC, particularly PT.X who is obliged to produce and distribute subsidized fertilizer.
2. Existing Distribution System
The subsidized fertilizer distribution system of PT. X which covering West Jawa Province and several Regions
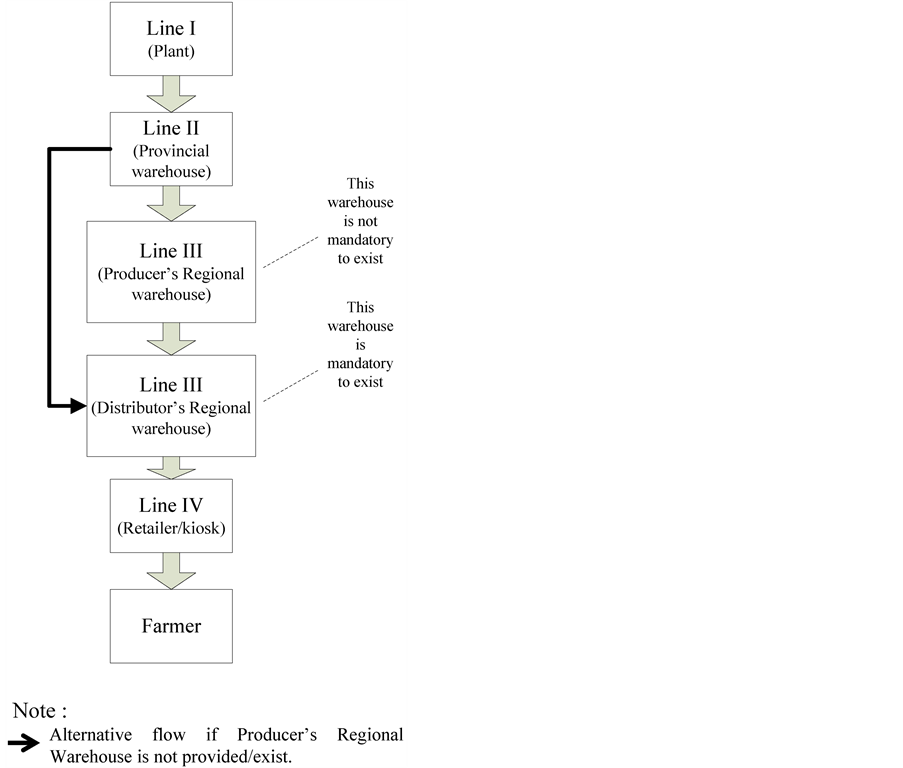
Figure 1. Network flowchart of subsidized fertilizer distribution based on Indonesian Ministry of Trade regulation.
in Central Jawa Province, includes 31 producer’s warehouse and ±250 distributor’s warehouse. But this study just evaluate of 22 producer’s warehouse and 170 distributor’s warehouse. The distribution system of PT. X is described in the following Figure 2.
PT. X use plant’s warehouse as Line 1 (plant warehouse) and Line II (Provincial warehouse) concurrently in its distribution system because it has relatively close distance to its coverage area. The fertilizer can even be loaded onto distribution truck immediately after packing process is finished, and not necessarily to store at plant’s warehouse prior to distribution. Therefore the plant warehouse function is merely as storage during overproduction period, i.e. when the quantity output of fertilizer produced at plant exceeds what farmers required.
The transportation fleet that running for distribution of products either from Line I/II (plant) and Line III are managed by expedition companies (third parties) who are appointed by transportation service agreement. Type of vehicle used is truck.
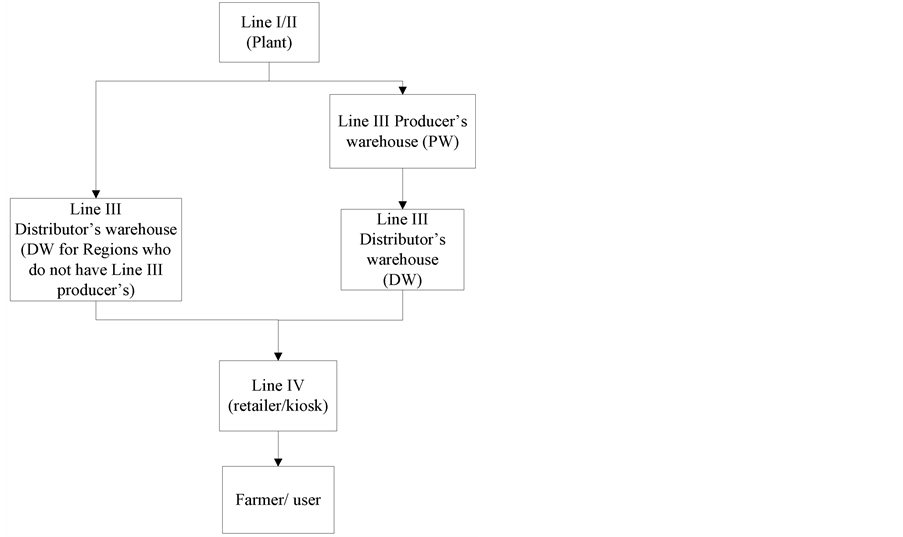
Figure 2. Subsidized fertilizer distribution flow of PT. X.
3. Development of Optimization Model
The development of optimization model is based on trade-off principal that is possibility of an increase of distribution cost on one function may reduce other function cost and save overall total system cost. This condition is due to interrelation among distribution system elements, whereas the distribution system is to be seen as a set of system and not as a single entity of its element.
Trade-off principals applied to this optimization model development are as follows:
1) Trade-off among different functions within company.
Example is trade-off due to reduction of number of warehouse. Financially it can reduce warehouse rental cost, and operationally it simplifies the complexity of distribution system. However from marketing functional point of view, this can bring down level of service as the distance between warehouse and consumer is longer and having risk of delay on product delivery.
2) Trade-off between company and external related organizations.
Example is fertilizer delivery from plant directly to line III distributor or distributor’s warehouse (DW) without stopping at line III producer or produser’s warehouse (PW) in order to maximize the usage of existing DWs [7].
Based on the above principles, strategies to perform optimization are as follows:
1) DW Cluster Restructuring Current clustering system of DW is based on administrative area consideration, whereby DW must be in the same region as the supplying PW. In some cases however, consideration on area proximity (geographical consideration) is more suitable in order to save transportationcost. In this cluster restructuring, it is possible to eliminate PW which is less contributing in making efficiency on distribution system and maximize other PW function that considered can improve efficiency of the overall distribution system. Closure of several PW will reduce warehouse rental cost. However there is still a condition in this cluster restructuring system where at least one PWmust be available in one region in order to maintain minimum fertilizer stock availability in that region. As a consequence of the closure, the remaining opened PW shall be able to anticipate the required capacity which left by the closed PW. This arrangement mitigates risk of delay on fertilizer delivery.
2) Through trips This strategy allows delivery of fertilizer from plant directly to DW without stopping at PW. Elimination of all PW is possible in this through trips system, which will lead to reduction of warehouse rental and handling costs in PW. However to ensure minimum stock availability in one region is fulfilled, it is therefore required to provide one PW on every region as to avoid delay on fertilizer delivery. The operated PW functioned as buffer stock, i.e. to keep minimum stock availability without necessarily all truck to stop by there. Nevertheless with the advance of information technology currently, it is possible to eliminate PW and further to save the warehouse rental cost.
The developed optimization strategies are broken down into the following scenarios:
● Scenario 1 Cluster restructuring, having purpose to rearrange the clustering of the number of DW against their PW.
● Scenario 2A Allowing through tripsor direct delivery from plant to DW without stopping at PW.
● Scenario 2B Allowing through trip or direct delivery to DW with cluster restructuring.
● Scenario 3 Allowingthrough trips, but still operating bufferwarehouse to keep minimum stock availability.
By following those scenarios, optimization is carried out by simulating distribution cost for various allocated volume and predicted transportation unit cost. Simulation is performed to examine the robustness of the scenarios. Simulation that related to fertilizer allocated volume is to find out the sensitivity of the scenario whenever significant change of allocated volume occurs. Whilst simulation related to transportation unit cost is carried out because the unit cost for new lines (that are not covered in existing lines) are obtained from calibration of regression model from the data of the existing transportation unit cost. As the predicted transportation unit cost that being used is not the actual (merely as predicted value obtained from regression), therefore it is possible to bias from the actual cost. The coefficient value of the determined regression model result is R2 = 0.872 and R2 = 0.889, hence the maximum bias value of ±20% is considered representative to the uncertainty of the predicted transportation unit cost. The volume of fertilizer demand and transportation unit cost used in the simulation are as follows:
● Average Demand Average demand volume is used as the base demand volume, whereby the average volume is represented by volume in the month of April.
● Peak Demand This value is used to see the consistency resulting from the optimization when the demanded volume is move up becoming the peak or maximum volume. Volume in December is used as the peak demand volume.
● Predicted unit cost with bias −20%, −10%, +10% and +20% The valuesare used to see the consistency of optimization result when the predicted transportation unit cost (transportation unit cost obtained from regression model) bias −20%, −10%, +10% and +20% against cost resulting from calibrated regression model.
The above developed scenarios are tested to network as shown in Figure 3, whereby network form of each scenario is suited with the character of the scenario itself.
Considering the significant number of warehouse, therefore it is required to cluster or zoning in order to ease the process of network optimization. The basis of the zoning is geographical closeness and similarity. In this zoning, there are five zones each formed by several PW that every PW serve several DW.
The best distribution network is sought on each network of every scenario based on the most minimum total cost of the distribution system. Mathematical programming formulation of the most minimum total cost is using Mixed Integer Linier Programming (MILP) model. This modeling provides solution to choose which warehouse is to be opened including which distribution network is to be used. The modeling adopts from equation model of Minimum Cost Flow (MCF) in the formula of Linier Programming [8], combined with integer biner variable to decide to open or close of warehouse. Mathematical model of MILP is as follows:
 (1)
(1)
subject to:
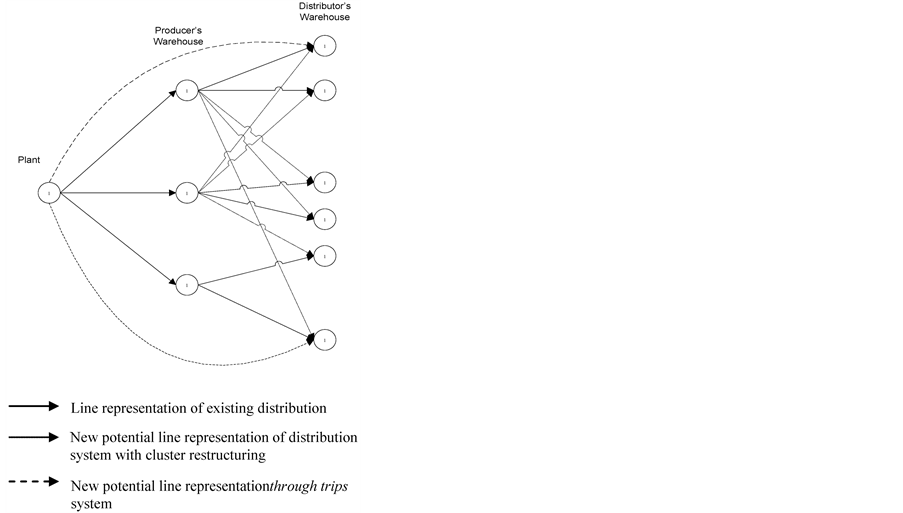
Figure 3. General description of the proposed distribution system.
 (2)
(2)
 (3)
(3)
 (4)
(4)
where
 (5)
(5)
Input:
 = demandat node – i
![]() = unit transportation cost at link (i, j)
= unit transportation cost at link (i, j)
![]() = lowerbound flow at link
= lowerbound flow at link
![]() = upperboundflow at link
= upperboundflow at link
(i, j) = link capacity (i, j)
 = warehouse rental cost-g A = Set of linkin distribution network
 = Set of node in distribution network
 = Set of node that represents producer’s warehouse (PW)
Decision variables:
 = binary number [0,1] = {equal to 1, if theproducer’s warehouse is opened and it is 0 when otherwise}
![]() = flow at link (i, j)
= flow at link (i, j)
Equation (1) denotes the objective function of our model, i.e. minimizing total distribution cost. The distribution cost consists of transportation cost which is including handling cost and warehouse rental cost. The first fraction represents transportation cost that is obtained from unit transportation cost at link multiplied by flow volume at that link. The second fraction related to warehouse rental cost. Equation (2) denotes conservation flow constraint or mass balance at every node in the network. From this equation it can be seen the flow demand at the given node.
Equation (3) is the demand limit constraint, i.e. the flow volume at each link shall be within upper bound and lower bound. At this developed model the capacity of the link is not being limited. Equation (4) denotes that the flow volume shall be more than zero. Equation (5) is the mass balance (flow conservation) in a network, i.e. the inflow volume less outflow volume shall be zero.
The programming solution is using heuristic approach, that is by modifying MCF algorithm solution (to obtain the minimum cost) [8] with ADD algorithm [9]. ADD algorithm is used to trial heuristically of various warehouse combinations to obtain the minimum cost.
ADD algorithm starts from locating warehouse at site that minimizes total cost. The minimization of total cost itself is solved by MCF algorithm. ADD algorithm greedily adds warehouses to the current solution until the algorithm fails to find a warehouse whose addition will result in a decrease in the total cost. Greedily means that each node that is added to the solution reduces the cost as much as possible, holding the previously selected sites fixed in the solution [9].
The optimization result of the proposed distribution system from all zone based on average demand is shown in the following Table1
The optimization result of the proposed distribution system from all zones is summarized in the following Table2
4. Result Analysis
Based on the optimization result from robustness test as shown in Table 1, the conclusions are as follows:
1) Cluster restructuring (Scenario 1) is not resulting a significant efficiency value, whereby the range percentage of total distribution cost from optimization against the existing is 94% to 98%. The efficiency comes from the reduction of warehouse cost to 42% - 72% of existing warehouse cost, while the transport cost could only be minimized up to 99% of existing cost. Even in one of simulations we found that the transport cost becomes bigger than the existing one (102% of the existing cost). It is due to the reduction of number of warehouses which may cause the increasing of travel distance and consequently it increases the transport cost.
2) Scenario through trips (Scenario 2A) resulting a significant efficiency value, whereby the range percentage of total distribution cost from optimization against the existing is 61% to 72%. While the combined cluster restructuring with through trips (Scenario 2B) resulting similar cost and distribution network as Scenario 2A. This means that through trips is more prefered in reducing

Table 1 . The optimization result of the proposed distribution system based on average demand.
Tabel 2. Percentage of cost efficiency from optimization result.
distribution cost compared to cluster restructuring.
3) Trough trips scenario with buffer warehouse (Scenario 3) resulting range percentage of distribution total cost from optimization against existing cost at 64% to 78%. Buffer warehouse in this scenario is functioned as storing place of fertilizer stock to anticipate whenever delay of fertilizer delivery is occurring, while fertilizer distribution to distributor’s warehouse (DW) remains by through trips.
5. Conclusions
Based on the optimization result through four scenarios, it is concluded that the existing distribution system can be improved by adopting through trips system from plant to distributor’s warehouses (DW). Efficiency is also obtained from reduction of handling cost at producer’s warehouse (PW) and its possible closure.
Successful through trips system requires utilization of information technology system in order to maintain good and thorough observation on the actual supply and demand condition. Therefore, the availability of fertilizer stock at producer’s warehouse (PW) is maintained in order to be anticipated if stock shortage at distributor’s warehouse (DW) occurs.
REFERENCES
- D. J. Bowersox, D. J. Closs and M. B. Cooper, “Supply Chain Logistics Management,” McGraw-Hill, New York, 2007.
- K. S. Hindi, T. Basta and K. Pienkosz, “Efficient Solution of a Multi-Commodity, Two-Stage Distribution Problem with Constraints on Assignment of Customers to Distribution Centres,” International Transactions in Operational Research, Vol. 5, No. 6, 1998, pp. 519-527. http://dx.doi.org/10.1111/j.1475-3995.1998.tb00134.x
- Y. C. Tsao and J. C. Lu, “A Supply Chain Network Design Considering Transportation Cost Discounts,” Transportation Research Part E, Vol. 48, No. 2, 2012, pp. 401- 414. http://dx.doi.org/10.1016/j.tre.2011.10.004
- W. Wisetjindawata, K. Yamamotoa and F. Marchalb, “A Commodity Distribution Model for a Multi-Agent Freight System,” Procedia-Social and Behavioral Sciences, Vol. 39, 2012, pp. 534-542.
- Y. R. Perdana, “Logistics Information System for Supply Chain of Agricultural Commodity,” Procedia-Social and Behavioral Sciences, Vol. 65, 2012, pp. 608-613.
- V. Martinez, P. Gupta, Y. Tse and J. Kittiakarasakun, “Electronic versus Open Outcry Trading in Agricultural Commodities Futures Markets,” Review on Financial Economics, Vol. 20, No. 1, 2011, pp. 28-36. http://dx.doi.org/10.1016/j.rfe.2010.09.001
- Nahry, “Pengembangan Model Optimasi Sistem Distribusi Komoditasuntuk Meningkatkan Efisiensi Sistem Distribusi,” BUMN-PSO, Fakultas Teknik Universitas Indonesia, Disertasi, 2010.
- R. K. Ahuja, T. L. Magnanti and J. B. dan Olin, “Network Flows,” Prentice Hall Upper Saddle River, 1993.
- M. S. Daskin, “Network and Discrete Location. Models, Algorithms, and Application,” John Wiley & Sons, Inc., Toronto, 1995. http://dx.doi.org/10.1002/9781118032343