Agricultural Sciences
Vol.06 No.12(2015), Article ID:62373,6 pages
10.4236/as.2015.612146
Simulaccion Processes of a Mathematical Model to Determine the Growth of Tomato under Plastic Cover
Luz Elva Marín Vaca1, Martha Lilia Domínguez Patiño2, Nadia Lara Ruiz1, Miguel Aguilar Cortes1
1Centro de Investigación en Ingeniería y Ciencias Aplicadas, Universidad Autónoma del Estado de Morelos, Cuernavaca, México
2Facultad de Ciencias Químicas e Ingeniería, Universidad Autónoma del Estado de Morelos, Cuernavaca, México

Copyright © 2015 by authors and Scientific Research Publishing Inc.
This work is licensed under the Creative Commons Attribution International License (CC BY).
http://creativecommons.org/licenses/by/4.0/


Received 27 November 2015; accepted 25 December 2015; published 29 December 2015
ABSTRACT
The tomato is one of the horticultural crops of the greatest economic value; for this reason, flexibility of management is usable. The population density in a crop of vegetables is determined by the distance between the plants and so it is necessary to choose the number of plants per square meter since the saturation of plants will lead to competition between sunlight, nutrients and weed. The objective of this work is to make the appropriate investigation for the use of the model proposed in order to describe the growth of tomato in greenhouse to high density of two plants per container to two bunches per plant, resulting in eight plants per square meter to grow, by means of a simulator of growth by computer. Of this work, it is concluded that it is possible to use the model to describe the growth of plants, and in the near future it will be possible to develop a simulator by computer of the growth of these crops in order to improve their quality and increase their production.
Keywords:
Simulation, Plastic Cover, Tomato

1. Introduction
Agribusiness in Mexico presents a lag in the area of research in agronomy and horticulture.
Mexican companies supply technology abroad, which emphasizes the dependence of the country on foreign technology, impacting adversely on the support resources economic technological research nationally and the development of the capital goods industry, which leads to strengthen technological dependence. Agriculture in the periods 1995-2000, 2001-2006 and 2007-2010, shows average annual growth rates of 0.55%, 2.82%, and 0.78%, respectively; however, for the economic situation in 2009, the industry collapses to an average annual growth rate that does not even reach one percentage point, leading, in other effects, the decrease of job opportunities in rural areas [1] . The field of applied mathematics offers a tool that allows you to describe and model the nature based on a model that describes the growth of the tomatoes through a program that simulates the growth of the crop.
The tomato at the global level is the second most important vegetable. In Mexico, agriculture has acquired social and economic importance due to foreign exchange and employment generation, this vegetable production systems have been diversified in order to increase performance, incorporating innovative technologies such as plastic covers, hydroponics and drip irrigation. The production system of tomato under conditions protected in Mexico is relatively new, due to the increase of the acreage productivity, profitability and high quality of the products [2] . In the country, there are about 20 thousand hectares under protected agriculture, occupying 70% the cultivation of tomatoes [3] .
In this regard, Koenig [4] developed a model to predict distribution of dry matter in tomatoes with indeterminate growth grown in Dutch greenhouses. On the other hand, TOMSIM develops an explanatory model with modular structure, this simulates the growth and development of tomato [5] . A general growth model for greenhouse crops predicts dry matter production; on the other hand, Wahundeniya [6] presents the analysis of the growth of three cultivars of tomato under greenhouse conditions.
In this sense, for the model, presented data were collected weekly variables from the time of flowering until harvest and a regression analysis was performed to obtain the growth models [7] - [9] .
The main objective of this paper is to describe the process of growth of tomato using the simulink to obtain the optimal development depending on the variation of temperature.
2. Assumptions
Lifecycle: one ends its life cycle in one growing season (from planting to harvest), when it grows, flowers, produces seed, and dies plant are considered.
Beginning of flowering: When at least 10% of the plants have one or more flowers.
Full Bloom: The time when all flowers and plants are more than 50% of these shows abundant flowering.
End of flowering: It is considered as the end of flowering when only 10% of the plants show well developed flowers.
Flowering: the period during which the plant remains flowering is obtained by calculating the difference in days between the end and beginning of flowering.
Physiological Maturity: It occurs when the life cycle of the plant had been completed and can be torn or cut without adversely affecting the physiology of the seed.
3. Methodology
Was evaluated the performance of certain tomato type Claudette, in high density with two plants per container, two clusters under plastic cover, in a greenhouse in the Experimental field of the Faculty of Sciences agricultural of the Autonomous University of the State of Morelos, at an altitude of 1529 mask, intense summer rains with precipitation lower in winter and temperatures ranging between 9˚C and 32˚C.
Transplantation was carried out at 30 days after planting when the plant presented the first 3 true leaves. Transplantation was carried out in containers of plastic polyethylene bags, with red tezontle substrate and a system of fertirrigation with nutrient solution set, programming 8 watering per day. On the basis of its growth, the plants were held vertically with ixtle thread. Heading home after two defined clusters, also were pruned side shoots constantly and the process of hand pollination to the mooring of fruit.
Data were obtained from weekly growth from flowering through simple random sampling. The variables considered were: temperature and leaf area development. Dry matter of leaf area, temperature and weight of fresh fruit per cluster matter is quantified in the fruiting period. Statistical analysis established the equations of the model.
The mathematical model of tomato was aimed to simulate the weekly production of the cultivation of tomato under plastic cover from information obtained by sampling random within the conditions of production.
The model consists of three variables: development (N),  foliage biomass, and biomass of the root
 . Differential with respect to time, equations are:


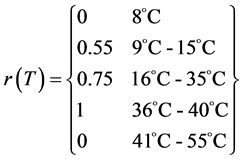
 : It is a function of temperature, in the simulation the following function was used.
4. Results
Experimentally it has with data obtained in the greenhouse of the Experimental Field of the Faculty of Sciences Agricultural of the Autonomous University of the State of Morelos.
For the simulation, two programs were developed in the Simulink software, which allows us to obtain results of the equations and functions mentioned above, the entry conditions of the two programs were obtained in the experimental field with randomly different temperatures [10] ; ideal conditions in photosynthesis [11] , CO2 loss rate and good plant growth, the graphs on the growth of tomato in their various stages of growth are as follows.
Figure 1 relates the behavior of the stem with respect to the days of sowing with upward growth. When it starts the period of physiological ripening of fruits, there is a downward growth in stems by the quiet power that is stimulating the ripening of fruits.
Leaves growth factor is based on the development of plant tissue in specific time when the plant is down in growth.
Figure 2 shows the growth of the leaves through the passage of time; Figure 3 shows the increasing weight of the flower through the passage of time, Figure 4 presents the weight in grams of the fruit and its development in time.
Figure 5 shows the random temperatures employed in the 120 days after planting, taken with the datalogger team.

Figure 1. Days of planting in relation to the weight of the stem (g).

Figure 2. Days of planting in relation to leaf area (cm2).

Figure 3. Days of planting VS weight (g) flower.

Figure 4. Days of planting VS weight (g) fruit.

Figure 5. Days of planting VS temperature.
5. Conclusion
An important indicator in the developed mathematical model to predict the growth of the crop using the simulink Simulator is the dry weight depending on the physiological characteristics of vegetables including temperature, time of life, time of flowering and fruit; which can be evaluated as a function of time.
Cite this paper
Luz ElvaMarín Vaca,Martha LiliaDomínguez Patiño,NadiaLara Ruiz,MiguelAguilar Cortes, (2015) Simulaccion Processes of a Mathematical Model to Determine the Growth of Tomato under Plastic Cover. Agricultural Sciences,06,1532-1537. doi: 10.4236/as.2015.612146
References
- 1. INEGI. Sistema de Cuentas Nacionales, varios años (1995-2010).
- 2. Ortega Hernández, A., León Andrade, M. and Ramírez Valverde, B. (2010) Agricultura y Crisis en Mexico: treinta años de políticas Económicas Neoliberales. Ra XImhal, 6, 323-337.
- 3. SAGARPA (2012) Agricultura Protegida 2012.
http://2006-2012.sagarpa.gob.mx/agricultura/Paginas/Agricultura-Protegida2012.aspx - 4. Koenig, D., Jiménez-Gómez, J.M., Kimura, S., Fulop, D., Chitwood, D.H., Headland, L.R., et al. (2013) Transcriptómica comparativo revela patrones de selección en domesticado y tomate silvestre. Proceedings of the National Academy of Sciences, EE.UU, 110, e2655-e2662.
- 5. Bouzo, C.A., Favaro, J.C. and Astegionado, E.D. (2001) Estimación del área foliar en distintos cultivares de tomate (Lycopersicon esculentum Mill.) utilizando medidas foliares lineales. Investigación agraria. Producción y protección vegetales, 16, 249-256.
- 6. Wahundeniya, W.M.K.B., Ramanan, R., Wickramatunga, C. and Weerakkodi, W.A.P. (2009) Evaluación de cultivares de tomate bajo condiciones protegidas en las condiciones de la isla de la Bahía. Actas del Seminario Nacional de Producción Sistema en condiciones adversas para una mayor productividad en A & N Islas, 22 a 24 dic 2009, India.
- 7. Bertin, N. and Gary, C. (1993) Tomato Fruit-Set: A Case Study for Validation of the Model Tomgro. Acta Horticulturae, 328, 185-193.
http://dx.doi.org/10.17660/ActaHortic.1993.328.17 - 8. Bertin, N. and Heuvelink, E. (1993) Dry-Matter Production in a Tomato Crop: Comparison of Two Simulation Models. Journal of Horticultural Science, 68, 995-1011.
- 9. López Cruz, L., Ramírez Arias, A. and Rojano Aguilar, A. (2005) Modelos matemáticos de hortalizas en invernadero: trascendiendo la contemplación de la dinámica de cultivos. Revista Chapingo Serie horticultura, Universidad Nacional de Chapingo, México.
- 10. Bertin, N. (2005) Analysis of the Tomato Fruit Growth Response to Temperature and Plant Fruit Load in Relation to Cell Division, Cell Expansion and DNA Endoreduplication. Annals of Botany, 95, 439-447.
http://dx.doi.org/10.1093/aob/mci042 - 11. Cochrane, K., De Young, C., Soto, D. and Bahri, T. (2009) Climate Change Implications for Fisheries and Aquaculture. FAO Fisheries and Aquaculture Technical Paper, 530, 212.