Agricultural Sciences
Vol.06 No.08(2015), Article ID:59048,13 pages
10.4236/as.2015.68081
The Effect of Climate Change on Land and Water Use
Galina Stulina*, Georgiy Solodkiy
International Fund for the Aral Sea saving, Interstate Coordination Water Commission, Scientific-Information Center, Tashkent, Uzbekistan
Email: *galina_stulina@mail.ru
Copyright © 2015 by authors and Scientific Research Publishing Inc.
This work is licensed under the Creative Commons Attribution International License (CC BY).
http://creativecommons.org/licenses/by/4.0/


Received 2 June 2015; accepted 22 August 2015; published 25 August 2015
ABSTRACT
Climate warming is recognized as an objective reality all over the world. The typical characteristics of this warming include rise in soil and air temperature, more frequent and intensified extreme weather events (droughts, floods, storms) that especially became apparent in the recent decade, and, finally, change in precipitation patterns. In the arid areas, to which the Aral Sea basin, the research object, belongs too, more frequent dry years accompanied by decreased river water availability and precipitation and increased aridity of air are the most critical. This has a negative effect on agriculture in the basin’s countries, which is a source of livelihoods for almost half of the population. Most researchers studying the climate change effects note that the temperature rise leads to increased evaporation and, hence, to growth of water demands for irrigation of crops. The analysis made for the
Keywords:
Climate Change, Crop Development, Water Requirement

1. Introduction
Climate warming is recognized as an objective reality all over the world. The typical characteristics of this warming include rise in soil and air temperature, more frequent and intensified extreme weather events (droughts, floods, storms) that especially became apparent in the recent decade, and, finally, change in precipitation patterns. In the arid areas, to which the Aral Sea basin, the research object, belongs too, more frequent dry years are accompanied by decreased river water availability and precipitation and an increased aridity of air. Given the average total water resources of 133 km3 a year in the dry year 2008, their volume decreased to 96 km3 [1] . This has a negative effect on agriculture in the basin’s countries, which is a source of livelihoods for almost half of the population and accounts for 27% of gross regional product. Most researchers studying the climate change effects note that the temperature rise leads to increased evaporation and, hence, to growth of water demands for irrigation of crops. The 4th Assessment Report of the Working group to Intergovernmental Panel on Climate Change [2] warns that although the temperature rose steadily by 1 - 2 degrees over 100 years, there is no precipitation trend over 1900-1996. Moreover, certain growth of precipitation in winter in Central Asia is accompanied by an increase in frequency of droughts, including in spring, summer, and autumn. Growing demands for moistening as the main adaptation measure are indicated in works of [3] - [6] . It is suggested that business as usual may lead to 30% losses of grain yield in the region. Other numerous works suggest that water demand would grow with temperature rise. The authors have attempted to verify validity of this suggestion through some new approaches.
1.1. Research Objects and Methods
Given research was carried out within the framework of the project “Central Asian Water” (CAWA) financed by the Federal German Foreign Office. Scientifically, this work is a follow-up of the long-term research undertaken by Dr. Stulina G.V. in the area of climate change and adaptation to this change [7] - [9] . The present work had the following objectives:
- analyzing dynamics of agro-climatic parameters in light of climate change;
- assessing water use changes in the future scenarios.
The research was carried out mainly in Uzbekistan, though covered also some areas in Kyrgyzstan and Tajikistan within the territory of the Fergana Valley.
The Aral Sea Basin (Figure 1) is located in arid zone within the territory of the former Soviet Republics, such as Uzbekistan, Tajikistan, South Kyrgyzstan, South Kazakhstan, most of Turkmenistan, and partially Afghanistan.
The territory of the basin can be divided into three morphological zones: mountains, deserts and the Aral Sea
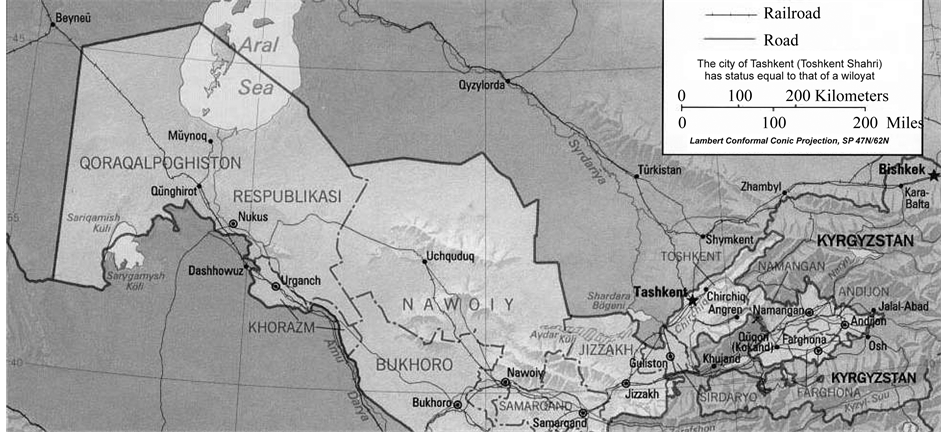
Figure 1. Map of Uzbekistan.
itself with the deltas. The peaks of the Pamirs and the Tien Shan are more than 7000 m above sea level. Annual precipitation is between 800 and 1600 mm. The annual precipitation in the lowlands―the Kara Kum and Kyzylkum deserts, which cover most of the area of the basin―is only 100 mm .
Moisture deficit as the difference between measured precipitation and evapotranspiration in the ancient oasis and submontane plateau is between 600 mm; in desert and steppe zone is between 1400 and 1600 mm.
Given such conditions and agricultural specialization of local economy, the population’s livelihood relies heavily on climate change and water availability, taking into account that majority of population (more than 60%) is rural and mainly employed in farming and related branches. In fact, since the ancient times, irrigation has been the base of economy and public administration system. A study of climate dynamics in the Aral Sea Basin indicated to changes in different components of the climate system; positive trends in the temperature series of cold and warm half year; increased atmospheric concentration of CO2 and the greenhouse effect. All these factors impact sustainable development in the region, and, first of all, the irrigated agriculture, which at present is the basis of the livelihoods of 70% - 90% population.
The irrigated area of the basin is 8.7 Mha. The catchment areas of the two main rivers of the Aral Sea Basin, the Amu Darya and the Syr Darya, extend to more than 1.5 Mkm2.
Initially, the dynamics of climate changes over recent years was examined. Subsequently, the results of the field studies and modeling on changes of agroclimatic indicators and water consumption were analyzed.
To have unbiased assessment of climate change, the observation data series since 1931 were used from 50 stations located under different physiographic conditions and human interventions. The positive trends in temperature series occur both during cold and warm half year. A comparative study shows the most significant warming over the territory in April, June, November, and December. In these months, the majority of stations (from 50.2% to 92%) showed a considerable increase in the average monthly temperature. A notable decrease of the mean temperatures (7.7% and 19.8%) is observed rarely and noted mainly during autumn season. Interestingly, during summer and autumn the increase of the minimum temperatures is more notable than the increase of maximum temperatures. The lowering of maximum temperatures is pronounced in the areas of intensive irrigation (Hunger and Karshi Steppes, Fergana and Surkhandarya). The average maximum temperatures in these areas dropped by more than 1˚C; this is comparable with natural variability of maximum temperatures in the given areas. The observations made during 1991-2013 show a continuous increase in the average annual air temperature with the considerable contribution of winter months. For example, the winter average temperature for 10-year period was higher than the base norm over the whole territory and even showed 1.2˚C - 1.5˚C growth in certain areas.
The long-term observations over air temperatures indicate to their continuous growth (Figure 2). As a whole, observations over 1991-2013 show that this air temperature trend keeps unchanged in the region. In the recent decade, winter months have contributed largely to warming process. For example, the decade mean air temperature in winter was above the norm practically throughout the territory, and increase in temperature was 1.2˚C - 1.5˚C even in some areas.
The maximum growth of precipitation is expected in mid-summer. The maximum growth will be 80% - 110%
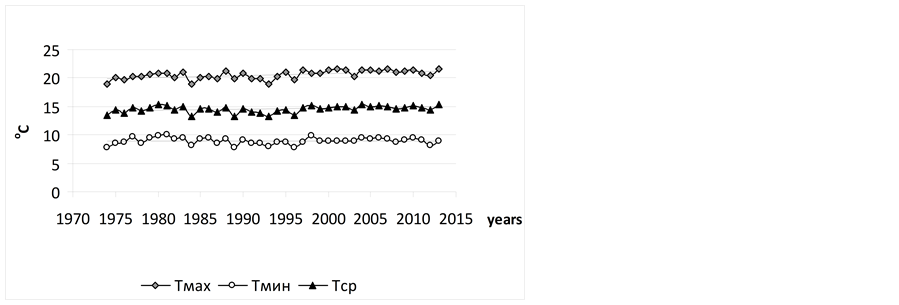
Figure 2. Dynamics of annual mean temperatures, weather station “Fergana”.
in the north (by 10% - 15% in winter), while in central part it will amount to 40% - 80%. In the north an increase in precipitation is expected one month earlier in summer. In winter, precipitation is expected to increase by 10% - 20%, while in autumn it will grow by 15% - 30%. Absolute values of forecasted precipitation will be increased by 5 - 10 mm during January-April and August-December.
The climate warming and precipitation growth will result in changes in altitudinal and latitudinal dimensions of climatic zones. Borders will move 150 - 200 m northward between dry tropical and temperate climate and 50 - 100 m between dry farming zone and dry lands with additional irrigation.
The findings of the past research completed together with the McGill University from Canada [7] were used as a working assumption. It was found that a cumulative increase of temperature potential should result in shortening of the growing season of crops. Similar results were published by us together with V. Usmanov [8] earlier. However, those only referred to changes in dates of transition through the threshold values of plant growth and development―5˚C, 10˚C, and 15˚C, respectively for various crops. Thus, in the present research it was decided to study an effect the changes in duration of growth phases of various plants and speeded up development of plants would have on crop water requirements, specifically on reduction of required irrigation days. Nevertheless, this work also took into account high temperatures that slow down development of plants until full cessation of cell growth. Such threshold temperature, for example, for cotton is 35˚C.
The Wurzburg University’s REMO model was used for forecasts of climate change. This climatic model is based on the ECHAM 5 model developed at the Max Plank Institute (Germany). That is the model of global atmosphere circulation. It is used for calculation of global and regional models of climate change. The A1B scenario of average warming as a result of greenhouse gas emission was played in the model. Given model allowed constructing the artificial temperature and rainfall series until 2100. The modeling results were calibrated. The calibration consisted in finding of coefficients that linked the modeled climatic data (REMO) to real observations. The coefficients were determined for a period of time, for which the observation data were available. The calibration was made against the calculated values of evapotranspiration and separately against temperature and rainfall.
The REMO modeling data were provided for the Fergana Valley. Water requirements were modeled using the REQWAT model developed on the basis of the CROPWAT model. REQWAT [9] is used for calculation of water requirements for a specific area. A planning zone map, an irrigated area map, the radar surveying data, a soil map, a groundwater well location map, the observations data on groundwater levels for a series of years, a salinization map of the studied area or statistical data on distribution of saline areas, climatic data associated with the nodes of regular grid, and crop parameters were used in those calculations. The results are displayed in form of ten-day or monthly crop water requirements averaged for the studied area or as maps of annual crop water requirements.
This model differs from the CROPWAT in that the former has a groundwater contribution module.
1.2. Research Results
Growth of greenhouse gases seems to increase productivity of crops, on the one hand, and would lead to more droughts as AOGCM predict, on the other hand.
The changes in temperature and rainfall would impact growth and development of crops and this was taken into account in calculation and forecasting of crop water requirements.
1.2.1. Changes in the Date of Steady Temperature Transition
The date of steady spring temperature determines the main parameters, such as the beginning of growing and seeding dates.
In the Fergana Valley, the steady transition of air temperature through 0˚C, corresponding to the beginning of growth of early fruits (apricot, almond), is observed in the 2nd ten-days of February. Autumn transition through 0˚C is observed in 2nd and 3rd ten-days of December. The duration of the period, when the air temperature is above 0˚C is 280 - 310 days.
Renewed growth of alfalfa, cereals and most fruits and spring growth of pasture grasses start when air temperature passes 5˚. This transition occurs in plain area of the Valley in the first ten-days of March. Duration of the period, when the air temperature is above 5˚C varies between 235 and 265 days.
An active growth of most crops coincides with steady transition of air temperature through 10˚C. This time we have favorable conditions for sowing of heat-loving crops, such as cotton and maize.
Spring transition of air temperature through 10˚C is observed in the Fergana Valley in the 3rd ten-day of March, while autumn one occurs in the 3rd ten-days of October. The period when the air temperature is above 10˚C lasts 200 - 220 days on average.
Figure 3 shows dynamics of changes in the date of steady temperature transition through 10˚C, which is recommended for sowing of many crops (Table 1), including cotton, maize, and rice.
The dates of steady temperature were determined from actual climatic data of the reference period and from REMO modeling results.
A clear trend of earlier approached date for recommended sowing is observed. In the REMO scenarios, the deviations from the base scenario of steady temperature transition through 5˚C are 3 days shift closer to winter and 6 days in the last days of growing season by 2030, more notable are 17 days and 3 days, respectively by 2050, and 9 days and 4 days shift by 2080.
By 2080, the steady temperature transition through 10˚C would be shifted to 17 days in spring season and 19 days at the end of growing season, while transition through 15˚C would be shifted to 20 days and 12 days, respectively.
According to Uzbek Hydromet data on the Fergana weather station, the change in duration of the periods between steady temperature transition through 10˚C under the A2 scenario will be 9 days by 2030, 20 days by 2050, and 38 days by 2080, while under the B2 scenario, this change in duration will be 12 days, 21 days, and 29 days, respectively.
Although the results from different scenarios vary, the tendency in all options is the same.
Figures 4-6 demonstrate the results of the analysis of change in the date of steady temperature transition using the moving average method.
The moving average was used in order to exclude weight of any specific year in trends and describe temperature dynamics over longer period more reliably. In this case the observed data are smoothed, i.e. first records are taken along the whole length of the database and then sample is shifted to one value for further calculations.
Figure 3. Change in the date of steady temperature transition through 10˚C.

Table 1. Minimum (1), optimal (2) and maximum (3) air temperatures by crop development phase.
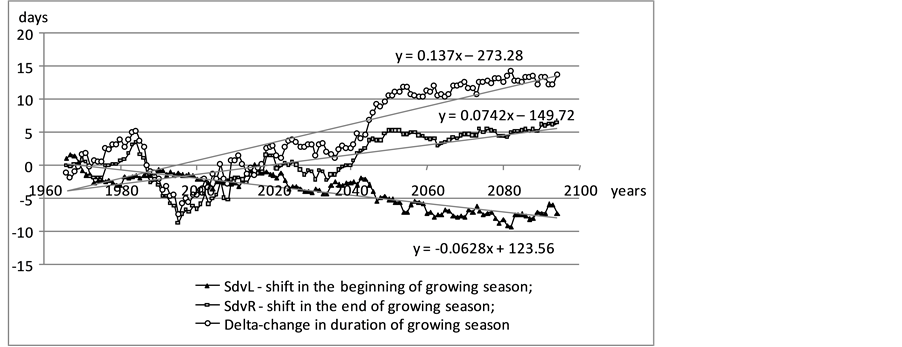
Figure 4. Expected change in the dates of steady temperature transition through 5˚C.
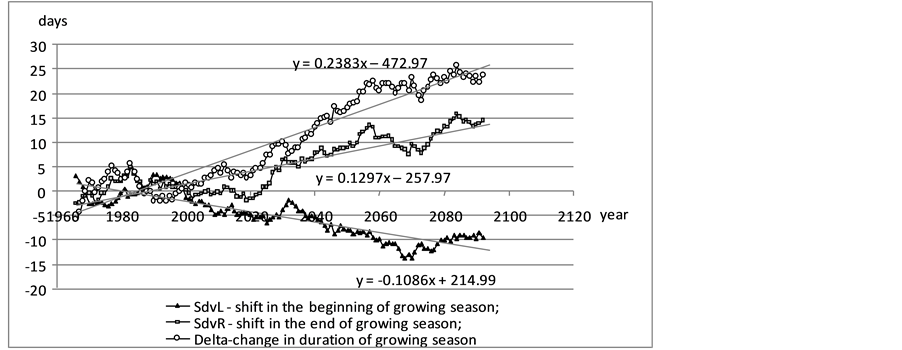
Figure 5. Expected change in the dates of steady temperature transition through 10˚C.
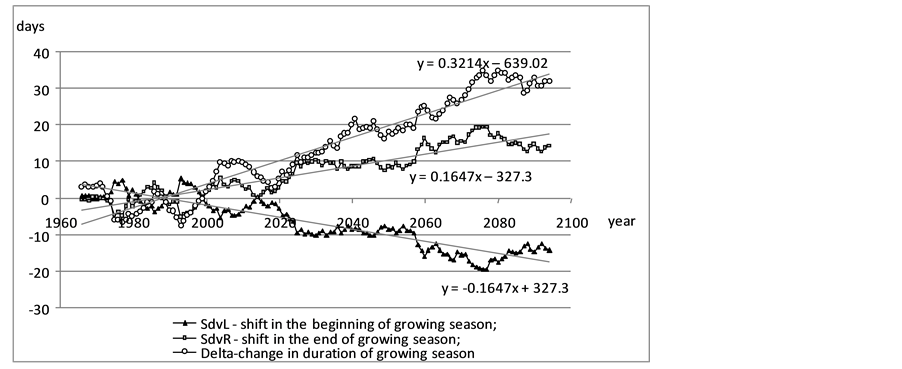
Figure 6. Expected change in the dates of steady temperature transition through 15˚C.
For earlier sowing of crops, soil moisture should be at sufficient level, i.e. either through rainfall or planned recharge irrigation.
Figure 7 demonstrates dynamics of temperature and rainfall in the dry year 2000. It should be noted that
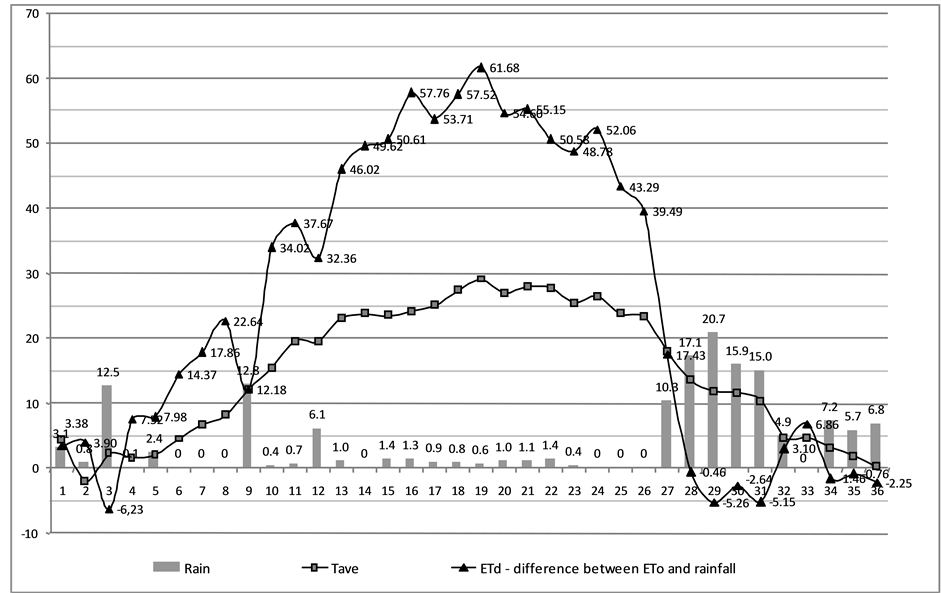
Figure 7. Ratio between temperature and rainfall, 2000.
during the dry year, there were no rainfall when the temperature reached more than 10˚C and showed steady increase. Unfortunately, the modeling of future rainfall still does not produce accurate distribution of rainfall during the growing season.
1.2.2. Assessment of Thermal Resources and Their Forecast
The following thermal zones were singled out in Central Asia [10] :
I. Hot zone―the sum of temperatures above 10˚C is more than 4000˚C (thermal resources are enough for growth and good ripening of cotton).
II. Warm zone―the sum of temperatures above 10˚C ranges from 2800˚C to 4000˚C (heat is not enough for good bearing of cotton but is sufficient for grapes, including early varieties).
III. Cool zone―the sum of temperatures varies from 1000˚C to 2800˚C (thermal resources are not enough for ripening of grapes but are sufficient for growth of spiked cereals).
IV. Cold area―the sum of temperatures is less than 1000˚C (non-agricultural area).
The rate of crop development is related closely to effective temperature. The effective temperature is the difference between the mean daily temperature and the temperature at which development of any crop starts - lower limit of temperature. The sum of the mean daily temperatures that are higher than the lower limit of temperature for one or another period (from sowing to sprouting, from sprouting to formation of 1st leaf, for growing season) is the sum of effective temperatures. The lower limit of temperature varies depending on crop. For example, it is 5˚C for cereals and most fruits and 10˚C for cotton.
At the same daily air temperature, effective temperatures for crops having different temperature limits for start of their growth will vary.
As follows from Figure 8, which demonstrates dynamics of effective temperatures under various temperature limits (5˚C, 10˚C, 15˚C), thermal resources would increase by 2050 and further by 2100 by 1133˚C, 1041˚C, and 878˚C or by 30%, 41% and 58%, respectively.
According to REMO forecast, thermal resources will increase by 28%, 38% and 56%, respectively, during the growing season (Figure 9).
Thus, thermal resources increase and reduce the risks for growing of heat-loving crops, such as cotton, in case
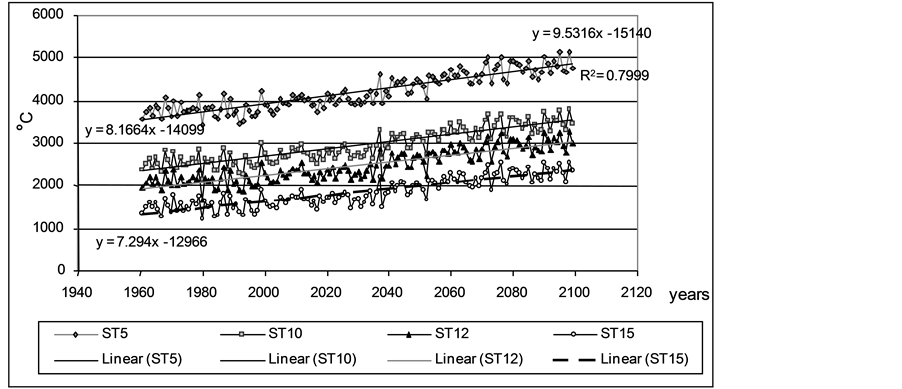
Figure 8. Sum of effective temperatures per year, Fergana weather station (Fergana planning zone), REMO forecast.
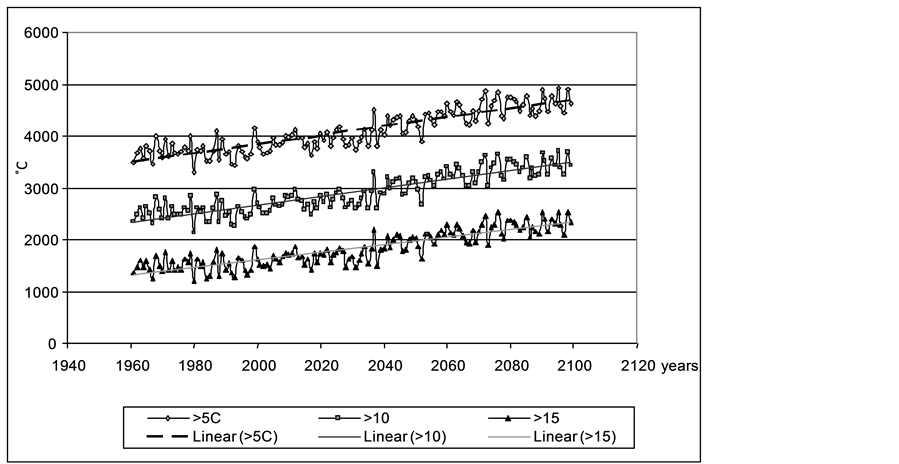
Figure 9. Sum of effective temperatures during the growing season, Fergana weather station (Fergana planning zone), REMO forecast.
of sufficient water availability.
The UzHydromet Institute made similar analysis for 50 stations in Uzbekistan for both the reference climatic period and for 2030, 2050 and 2080, using the emission scenarios А2 and В2 and the annual temperature curves constructed on the basis of monthly data [11] .
Table 2 shows temporal dynamics of the sum of effective temperatures for Fergana station for various scenarios against the base period of 1961-1990.
Scenarios А2 and В2 also show an increase in the sum of effective temperatures above 5˚C, 10˚C and 15˚C for the whole Uzbekistan. The sum of effective temperatures above 5˚C will increase by 10% in the scenario А2 and by 10% - 15% in the scenario В2 by 2030, by 14% - 19% in all emission scenarios by 2050, and by 24% - 30% up to 2080. The sum of temperatures above 10˚C will account for 20% - 30% by 2030 and 24% - 35% by 2080.
According to UzHydromet’s data on the scenarios А2 and В2 for the whole Uzbekistan and from the REMO data, the relative increase in the sum of temperatures above 15˚C exceeds the relative increase in the sum of
Table 2. Sum of effective temperatures for various scenarios against the base period of 1961-1990.
temperatures above 10˚C. The UzHydromet’s data show the largest increase of this value for mountain stations. In the plain area, the range of increase of the sum of effective temperatures above 15˚C will be 20% - 30% by 2050 and 30% - 50% by 2080, i.e. the results of the scenarios А2 and В2 and those of REMO indicate to close trends.
1.2.3. Length of Crop Growing Season
Thermal resources are to provide annual ripening of different crop varieties cultivated in the region.
The climate change and temperature rise will lead to alterations in duration of the accumulation of the sum of effective temperatures, which is necessary for ripening of crops.
Table 3 shows the sums of effective temperatures needed for phenological phases of plant development and complete ripening till harvesting.
The comparison of historical data with REMO simulations shows that changes in the growth and development of plants should be expected in the future. Subsequently, this will entail modification of the whole agronomic cycle.
There are 4 phases of plant development, which are described below (Table 4).
According to this classification and the sum of effective temperatures, the length of crop development phases was calculated for main crops and for different years and forecast for the future made.
Analysis made for cotton and maize shows the results. Figure 10 and Table 5 show changes in duration of development phases of mid-season cotton.
The derived results indicate to shortening of cotton growth season in general and of every phase in particular.
The duration of phases considerably changes over the analyzed and predicted years depending on climate. The length of growing season in 2050 will become 32 days shorter as compared to 1961. In comparison with the base period 1961-1990, the length of growth of mid-season cotton will shorten by 6 days during 2000-2030 and by 14 days during 2030-2050.
Similarly the growing season of fast-ripening cotton decreases. By 2050, maize growth will shorten by 18 days, and, accordingly, by development phases: 2, 9, 5 and 7 days.
Based on the analysis made above, temperature rise has a positive effect, stimulating physiological processes, thus shortening the length of crop development and growth. However, temperature rise entails the risk of occurrence of extremes, which negatively impact agricultural production. The rise of temperature above critical value will provoke plant stress. The analysis of temperature dynamics over 2000-2030 and 2030-2050 showed that the number of days with temperature above 35˚C was on average 57 and 72 days, respectively. Meanwhile, during the base period 1961-1990 this number of days with critical temperature was 48. Naturally, excluding the period with temperature above 35˚C out of the whole growing season will prolong it and reduce positive effect of climate change.
Figure 11 and Figure 12 show changes in growing season duration as considered in two options: with account of an effect of critical temperature and excluding it.
In the future farming practices under conditions of climate change one should use agricultural methods that reduce a risk of crop burns. Among such methods could be dispersion of water, application of mesh covers, etc. Those methods should be applied especially during stress-sensitive periods of plant development in order to make effective use of thermal resources.
The degree of utilization of thermal resources can be expressed via a coefficient of thermal resource utilization, which is a percentage ratio of available average sum of effective temperatures over the growing season to the average sum of effective temperatures needed for start of ripening. The data show by which percentage the
Table 3. Sum of effective temperatures above 10˚ for crop development phases under sufficient soil moisture.
1: Sowing-sprouting; 2: Sprouting-budding; 3: Budding-flowering; 4: Flowering-opening of 1st cotton bolls; 5: Sowing-opening of 1st cotton bolls.
1: Sowing ?sprouting; 2: Sprouting ?paniculation; 3: Milky ripeness; 4: Wax ripeness.
Table 4. Description of plant development phases.
Table 5. Change in the length of mid-season cotton development phases over periods of time.
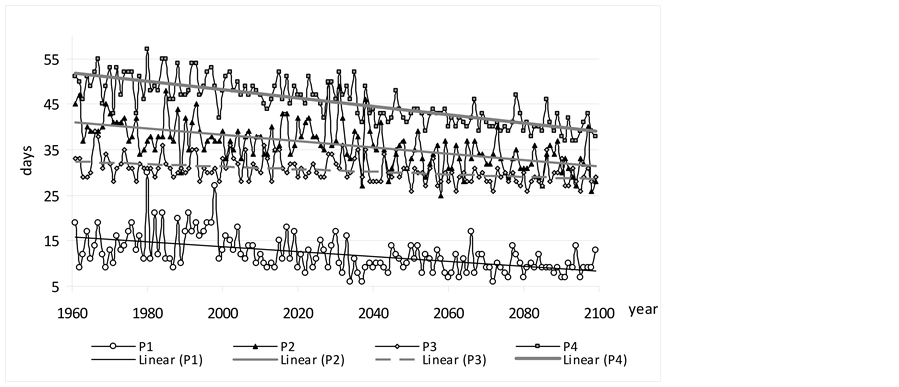
Figure 10. Change in the length of cotton development phases over years.
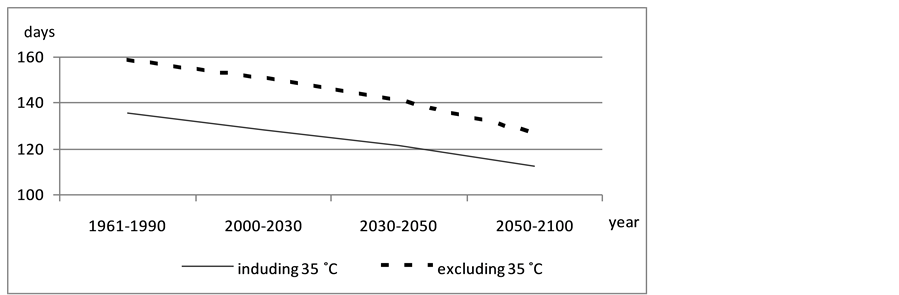
Figure 11. Duration of growth of mid-season cotton.
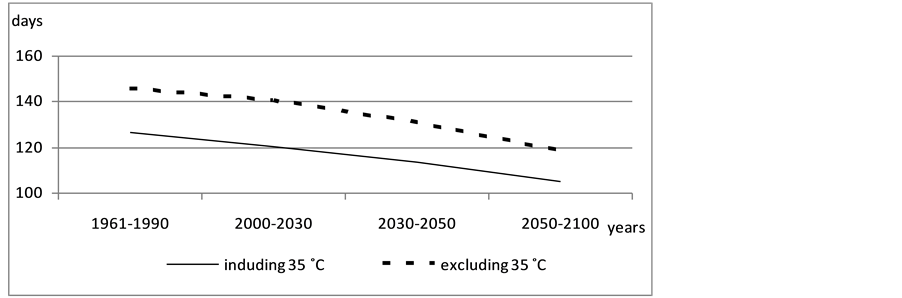
Figure 12. Duration of growth of early cotton.
sums of temperatures exceed the needs of one or another crop (100%) and what share can be used additionally by the crop itself or another, double crop.
The coefficient of thermal resource utilization for medium-stapled cotton is high and averaged 1.3 over 1961- 1990; it would increase up to 1.8 by 2050.
Yellow ripeness of spring-sown maize is 100% guaranteed for mid-season, late and very late varieties. The coefficient of thermal resource utilization rises from 1.6 to 2.03 throughout the area.
Abundance of thermal resources in the Fergana Valley allows collecting 5 harvests of alfalfa and even 6 harvests in favorable years during the season, ensures ripening of all rice varieties, irrespective of their ripening rate, cucurbits, vegetables, fruits, mulberry and grapes, and enables growing perennial crops after grain and early vegetable harvests.
2. Assessment of Water Requirements in Future Scenarios
2.1. Assessment of Moisture Deficit
As a whole, according to a climate change forecast, the moisture deficit will grow progressively, especially during growing season.
We have calculated potential water requirements for the study area. The actual climatic data for 1990-2000 and REMO simulation results for 2020-2030 were used in the calculations. The years for comparison were selected so that to avoid inaccuracy of the forecast (i.e. ensure validity) of rainfall for long-term and, at the same time, show the rate of moisture deficit growth. The results show (Figure 13) that moisture deficit expressed via ETd (ET0-Rain) increases to 8 mm/day in summer months.
2.2. Changes in Water Requirements
Against the general background of moisture deficit growth, it is necessary to analyze the effects of climate change on water requirements of various crops.
The lowering of crop yields is a result of many factors, water availability in the Central Asian region being critical one. As the past research showed [12] , under our conditions, water was more important in agronomic process rather than, for example, fertilizers.
Therefore, climate change and adaptation to this change are viewed by us as a need to correct water requirements, taking into account all changed factors of plant development.
When analyzing water requirements of crop, we took into account probable changes in agroclimatic parameters, including corrected sowing dates, dates of crop development phases, related crop coefficients, and total duration of growing.
Figure 14 and Figure 15 demonstrate the results of water requirement calculations by the REQWAT model, using REMO’s climate forecasts, for different cotton varieties. Water requirement trends indicate to decrease in irrigation requirements of cotton. However, this takes place through shortened growing season of cotton as shown above (Table 5 and Table 6, Figure 11 and Figure 12).
For cotton, the growing season would become 30 days shorter and the water use would decrease by more than 100 mm by 2100. The thermal patterns should be considered as the basis for crop rotation and, hence, for water planning.
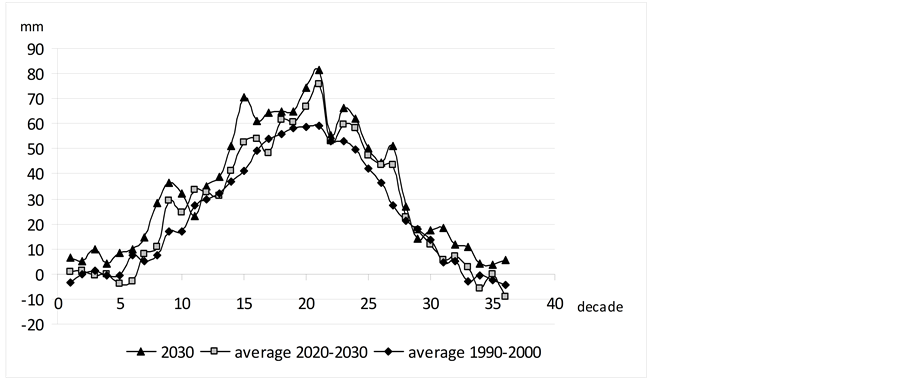
Figure 13. Dynamics of moisture deficit.
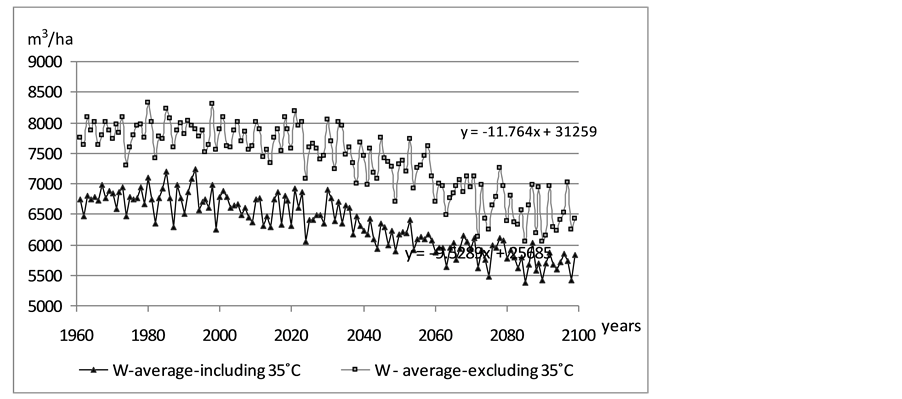
Figure 14. Scenario of changes in water requirements of mid-season cotton variety under climate change.
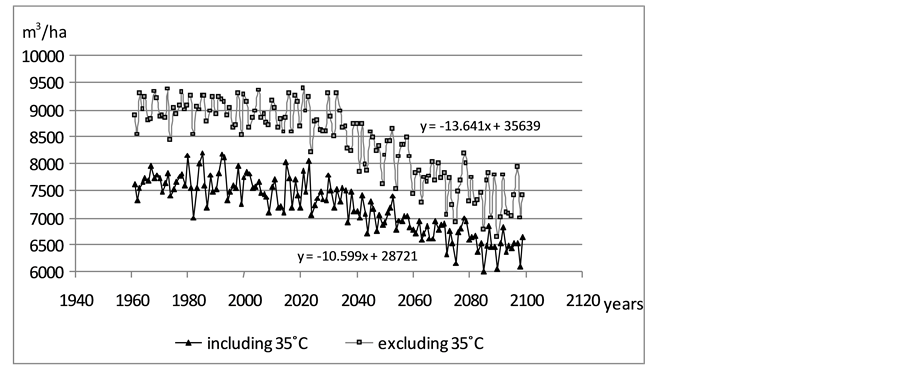
Figure 15. Scenario of changes in water requirements of early cotton variety under climate change.
Table 6. Change in the length of fast-ripening cotton development phases.
3. Conclusions
The analysis made for the Fergana Valley on the basis of potential evapotranspiration proves an increase in moisture deficit during growing season through the rise in air temperature. According to REMO modeling of climatic scenarios until 2100, evapotranspiration would increase significantly by 4 - 8 mm/day in summer months.
However, it is demonstrated also that the thermal capacity of given area would be changing. The growth of the thermal capacity causes that the sum of effective temperatures is reached in shorter period of time and the crops can be sown earlier. This, first, would reduce the crop development phases and the growing season as a whole, and, consequently, would decrease the total water requirements of cotton by more than 100 mm . The thermal patterns should be considered as the basis for crop rotation and, hence, for water planning.
From this point scheduling of water consumption should be organized on the basis of detailed network of local meteostations with permanent registration of principal weather indicators and their transfer to farmers. Such new practice will allow reducing water demands in water scarce conditions and extend time for second crops.
Cite this paper
GalinaStulina,GeorgiySolodkiy, (2015) The Effect of Climate Change on Land and Water Use. Agricultural Sciences,06,834-847. doi: 10.4236/as.2015.68081
References
- 1. Dukhovny, V.A., Sokolov, V.I., et al. (2012) Dynamics of the Present Water Balance in the Fergana Valley. Collection of SIC ICWC Scientific Papers, Issue 13, 5-27.
- 2. Climate Change 2007: Impacts, Adaptation and Vulnerability. In: Parry, M., Canziani, O., Palutikof, G., van der Linden, P. and Hanson, Eds., Contribution WG2 to the Fourth Assessment Report to Intergovernmental Panel of Climate Changes, Cambridge University Press, Cambridge, UK, 469-506.
- 3. Mannig, B., Müller, M., Starke, E., Merkenschlager, C., Mao, W., Zhi, X., Podzun, R., Jacob, D. and Paeth, H. (2013) Dynamical Downscaling of Climate Change in Central Asia. Global and Planetary Change, 110, 26-39.
http://dx.doi.org/10.1016/j.gloplacha.2013.05.008 - 4. Parry, M.L., Rozenzweig, C., Iglesias, F., Fisher, G. and Livermore, G. (1999) Climate Changes and World Food Security. Global Environment, 9, 51-67.
http://dx.doi.org/10.1016/S0959-3780(99)00018-7 - 5. Rozenzweig, C., Iglesias, A., Yang, V.B., Epshtein, P.Z. and Chevian, E. (2001) Climate Change and Extreme Weather Events: Implication for Food Production, Plant Diseases and Pest. Global Change and Human Health, 2, 90-104.
http://dx.doi.org/10.1023/A:1015086831467 - 6. Vleck, P.L.G., Rodríguez-Kuhl, G. and Sommer, R. (2004) Energy Use and CO2 Production in Tropical Agriculture and Means and Strategies for Reduction or Mitigation. Environment, Development and Sustainability, 6, 213-233.
http://dx.doi.org/10.1023/B:ENVI.0000003638.42750.36 - 7. Stulina, G. and Madramootoo, C. (2005) Adaptation Water Resources Management to Climate Change Condition in Aral Sea Basin, Alberta. Conference Proceedings CWRA (Canadian Water Resources Association) of “Reflections on Our Future”, Banff, Alberta, 14-18 June 2005.
- 8. Stulina, G. and Usmanov, V. (2002) What Is to Expert in Agriculture in View of Climate Change. Dialogue on Water and Climate: Aral Sea Basin case Study, Project N 12.130.021, Tashkent.
- 9. Stulina, G.V. and Solodkiy, G.F. (2011) Adaptation of Water Planning to Climatic and Hydrogeological Changes: The Use of Water and Land Resources and Environmental Problems in the EECCA Region in Context of Climate Change. Collection of Scientific Papers, SIC ICWC, Tashkent, 46-59.
- 10. Babushkin, L.N. (1957) Climatic Characterization of Aridity and Hot Dry Winds in Summer in the Cotton Area of Uzbekistan: Origin of Hot Dry Winds and Their Control. AN SSSR, Moscow, 59-64.
- 11. Chub, V.Ye. (2007) Climate Change and Its Impact on Hydrometeorological and Agroclimatic Processes and on Water Recourses in the Republic of Uzbekistan. “Voris-nashriyot”, Tashkent.
- 12. Dukhovny, V.A. (2008) Regional Model of Integrated Water Resources Management in Twinned River Basins— RIVERTWIN. SIC ICWC, Tashkent, 188.
NOTES

*Corresponding author.