Agricultural Sciences
Vol.5 No.6(2014), Article ID:46312,9 pages DOI:10.4236/as.2014.56057
Reduction in Nitrogen Prior to Harvest Increases Phenolic Content of Baby Red Lettuce Leaves
Dario Stefanelli*, Sonja Winkler, Christine Frisina, Rod Jones
Department of Environment and Primary Industries, Agriculture Research Division, Victoria, Australia
Email: *dario.stefanelli@depi.vic.gov.au
Copyright © 2014 by authors and Scientific Research Publishing Inc.
This work is licensed under the Creative Commons Attribution International License (CC BY).
http://creativecommons.org/licenses/by/4.0/


Received 6 February 2014; revised 28 April 2014; accepted 16 May 2014
ABSTRACT
This study investigated baby red lettuce leaves grown in an inert media and fertigated with 300 or 1000 mg∙L−1 CaNO3-N (19% Ca; 15.5% N), and the effects of altering CaNO3-N concentrations in the last 7 days prior to harvest on yield, antioxidant capacity, TPP and vitamin C content. Plants receiving 1000 mg∙L−1 CaNO3-N had a significantly higher leaf FW than those fertilized with 300 mg∙L−1 CaNO3-N after both 21 and 28 days. Pulsing plants with 1000 mg∙L−1 CaNO3-N for 7 days after 21 days at 300 mg∙L−1 CaNO3-N resulted in a significant increase in FW of 14%, compared with plants receiving 300 mg∙L−1 CaNO3-N. After 28 days plants fertilized with nitrogen at 300 mg∙L−1 CaNO3-N were significantly higher in TPP than those fertilized with 1000 mg∙L−1 CaNO3-N. While there was no significant effect on TPP of a 7-day 1000 mg∙L−1 CaNO3-N pulse added to 300 mg∙L−1 CaNO3-N, a 7-day pulse of 300 mg∙L−1 CaNO3-N added to 1000 mg∙L−1 CaNO3-N resulted in a significant increase in TPP. These results indicate that reducing the N availability for 7 days prior to harvest can result in a significant increase in plant phenolic content with no adverse effect on yield.
Keywords:Yield, Production, Vitamin C, Antioxidant Capacity

1. Introduction
In recent years there has been much interest in the study of the health benefits involved with regular consumption of fresh fruits and vegetables. Lettuce is one of the most economically important leafy vegetable crops in the world and is widely consumed in Western diets [1] . It is therefore an important source of dietary vitamin C and antioxidants, primarily in the form of phenolic compounds such as caffeic acid derivatives and flavonols [2] . There is an increasing evidence that antioxidants contained within fruits and vegetables may protect against serious diseases, including cardiovascular disease and certain cancers, if consumed regularly [3] [4] . The major flavonols contributing to antioxidant activity found in lettuce are quercetin and kaempferol derivatives [5] . Quercetin has been extensively studied in vitro and is known to be a potent free-radical scavenger and anti-oxidant [6] [7] . The closely related compound, kaempferol, has also been shown to possess antioxidant activity in its own right, albeit lower than quercetin [8] .
Nutrition during production can have a significant effect on antioxidant content in lettuce with low N availability tending to increase antioxidant activity which was attributed to increased phenolic content [9] . Limited N resulted in higher total plant phenolic (TPP) content in basil leaves [10] while, conversely, increased N via foliar urea application resulted in an increase in free radical scavenging activity in lettuce [11] . When grown under high N (>200 kg∙ha−1) vitamin C content declined in crisphead lettuce [12] . Growing lettuce under low N, however, results in poor yield. Reducing CaNO3-N applications to red lettuce from 1200 mg∙L−1 to 400 mg∙L−1 for 4 weeks resulted in a 39% reduction in yield, and a significant reduction in leaf nitrate content [13] . Maximum antioxidant capacity, as measured by TPP and the Ferric Reducing Antioxidant Power assay (FRAP), was measured in lettuce leaves fertilized with nitrogen at a concentration of 400 mg∙L−1 CaNO3-N, which is less than half of the commonly used commercial N rate in Australian hydroponic production but yield was significantly lower with this N application rate [9] .
To produce lettuces that could be marketed as high in antioxidants, it will be important to develop modified production practices that maintain an acceptable yield. Specifically, we hypothesize that a temporary reduction in CaNO3-N low enough to cause a stress response in plants will significantly increase phenolic content and antioxidant capacity but not reduce yield. This study investigated the effects of altering CaNO3-N concentrations in the last seven days prior to harvest on yield, antioxidant capacity and vitamin C content in immature red lettuce leaves.
2. Materials and Methods
2.1. Plant Material
Red oak lettuce seedlings (Lactuca sativa L. cv. Prunai) were sourced from a commercial seedling grower (Berwick, Victoria, Australia) at approximately six weeks of age. Prior to transplanting the seedling roots and crowns were treated with the fungicide Rovral (iprodione 250 g∙L−1) at the rate of 1 ml∙L−1 for 10 - 15 seconds. Three seedlings were planted into pots (200 mm diameter; 3.1 L volume) containing fine grade perlite. Plants were watered daily with 500 mL tap water and left to acclimate for seven days before beginning nitrogen treatments. Pots were watered using an automatic watering system containing drip irrigation lines. Irrigation was delivered three times per day with two drippers per pot, with 100 mL per dose giving a total water application of 300 mL per pot day−1, or 100 mL∙plant−1∙day−1. Saucers underneath the pots collected excess irrigation water and maintained medium (perlite) moisture. Two trials were conducted in October to November, 2011. Greenhouse temperature was maintained between 18˚C (night) and 24˚C (day) by an evaporative cooling system, with a mean relative humidity of between 40% to 50% at plant level.
The trial consisted of a randomised block design with 6 N treatments × 3 plants × 6 blocks = 108 plants. In addition nine plants per block (54 in total) were randomly assigned for evaluation at Day 0 (prior to N application) and the plants in the remaining twelve pots per block (two pots per treatment) were assessed at harvest at 21 or 28 days after transplanting. At harvest, the three plants from each pot were combined into one sample, were weighed for FW (g), fresh material for vitamin C analysis was removed and the remaining material was immediately frozen at −20˚C and freeze-dried for further processing.
2.2. Fertilizer Application
Liquid fertilizer was applied manually every three days for 21 or 28 days to each pot according to Table 1. A commercial lettuce hydroponic fertilizer (Hysol Twin, Duralite, Melbourne, VIC, AU) in which all traces of N were removed, was applied as a base fertilizer to each pot at the solution rate of 1.0 g∙L−1, in accordance to the Australian industry standards (1.0 to 1.2 g∙L−1). In addition, N was applied as CaNO3-N (19% Ca, 15.5% N) at either 300 or 1000 mg∙L−1 for 21 or 28 days according to Table 1. Fertilizer was applied as a solution at a rate of 30 ml CaNO3-N solution and 30 mL of modified Hysol base fertilizer (0% N, 5.7% P, 28.5% K) per plant in

Table 1. CaNO3-N fertilization treatments (mg∙L−1) applied to lettuce plants for 21 or 28 days. Plants supplied with treatments 3 and 6 were harvested after 21 days; all other plants were harvested after 28 days.
which nitrogen was removed. Plants were supplied with water on days when N was not applied. A total of nine applications were applied to plants harvested after 21 days, and 12 applications were applied to those harvested after 28 days. Water collected in the saucers under each pot was checked with an EC meter (NZ Hydroponics LTD, Tauranga, NZ) to avoid excessive build up of salts [14] . To avoid influencing elements absorption, EC was maintained at similar levels in all treatments (1.6 - 2.0 dS∙m−1) by periodically flushing excess salts from the high N concentrations with de-ionized water [14] .
2.3. Leaf Chlorophyll
Chlorophyll content of leaves was estimated every second day during the trial by SPAD (Konica-Minolta SPAD-502 Chlorophyll meter) on two fully expanded leaves before each fertilization event. This measurement was not intended to quantify chlorophyll in the plants but as an indicator of health.
2.4. Nitrate Content
NO3 content in leaves was assessed by weighing approximately 0.2 g of dried leaves into a plastic tube filled with 100 ml of distilled de-ionized water.
Tubes were shaken for 20 minutes and filtered through a 0.45 um filter disk. The collected solution was analyzed following the APHA method 4500- F [15] .
2.5. Ascorbic Acid (Vitamin C)
Determination of ascorbic acid was conducted on fresh leaf material, frozen with liquid nitrogen and blended to a fine powder. Approximately 10 g was weighed into a mortar and pestle where it was combined with 3% metaphosphoric acid and ground further to make a fine paste. Each sample was transferred to a 50 mL centrifuge tube and centrifuged at 4000 rpm for 10 minutes. The supernatant was transferred to a 50 ml volumetric flask. The pellet was washed with 3% metaphosphoric acid and centrifuged at 4000 rpm for 10 minutes. Supernatants were combined and the volume adjusted to 50 mL with 3% metaphosphoric acid. An aliquot of each sample was diluted and filtered into autosampler vials for measurement of L-ascorbic acid by HPLC. A separate aliquot of 100 µl of sample was combined with 300 µl of citrate buffer containing 10 mM dithiothreitol and allowed to stand for 30 min at room temperature. 800 µl of 3% metaphosphoric acid was then added and the samples were filtered into autosampler vials for HPLC analysis. This reaction provides the total ascorbic acid content. The difference between the total ascorbic acid content and the ascorbic acid content gives the dehydroascorbic acid content of the lettuce. All solutions and equipment were kept ice cold.
The HPLC analysis method was based on the European Committee for Standardization method EN 14130:2003 [16] . Analysis was performed on a Polaris C18 column, 5 µm, 250 × 4.6 mm, maintained at a temperature of 30˚C. The mobile phase was 0.1 M Potassium dihydrogen Phosphate, 0.005 M N-cetyl-N,N,Ntrimethylammoniumbromide in 15% (V/V) methanol. The flow rate was 1 mL∙minute−1, the program was isocratic and detection was at 264 nm. The area of the peak was used to calculate the ascorbic acid content, expressed as mg∙100g−1 FW.
2.6. Total Plant Phenolics (TPP) and Antioxidant Capacity by ORAC
Water soluble TPP, as an assessment of antioxidant activity, was measured following the Folin-Cioccalteau (FC) method [17] .
ORAC was measured using the microplate fluorescence reading method [18] using a Varioscan Flash (Thermoscientific Corp.).
2.7. Experimental Design and Statistics
The experiment was a randomised complete block design. Data were analysed using ANOVA by Genstat v13 and are presented as mean and lsd at P = 0.05. A total of 162 plants were used in the trial: 6 N treatments × 3 plants (per pot) × 6 replicates = 108 plants + Day 0 samples = 9 plants × 6 reps = 54 plants. Plants from each pot were weighed individually for FW measurements, but combined to create a single sample for all other measurements.
3. Results
Leaf fresh weight (FW) per plant was significantly affected by N fertilization with plants receiving 1000 mg∙L−1 CaNO3-N having a significantly higher FW than those fertilized with 300 mg∙L−1 CaNO3-N after both 21 and 28 days respectively (Table 2, Figure 1). Pulsing plants with 1000 mg∙L−1 CaNO3-N for 7 days after 21 days at 300 mg∙L−1 CaNO3-N resulted in a significant increase in FW of 14%, compared with plants receiving 300 mg∙L−1 CaNO3-N, while decreasing CaNO3-N to 300 from 1000 mg∙L−1 for 7 days prior to harvest had no significant effect on FW compared with plants receiving 1000 mg∙L−1 CaNO3-N (Table 2).
Leaf nitrate content was higher in plants fertilized with 1000 mg∙L−1 CaNO3-N compared with 300 mg∙L−1 after both 21 and 28 days, (Table 2). Nitrate decreased significantly in plants fertilized with 1000 mg∙L−1 CaNO3-N for 21 days and 300 mg∙L−1 for the next 7 days, compared with plants fertilized with 1000 mg∙L−1 CaNO3-N and harvested after 21 days.
Vitamin C content was not significantly different between the two CaNO3-N application rates after 21 days (Table 3). Lettuce harvested after 21 days however, had significantly more vitamin C than plants harvested at 28 days regardless of nitrogen application concentration (Table 3). There was no significant difference in vitamin C content between any of the treatments at the end of the 28 day growing period. Furthermore, an increased or decreased CaNO3-N application rate applied during days 22 and 28 had no significant effect on vitamin C (Table 3).
Antioxidant capacity, as measured by ORAC, was significantly higher after 21 and 28 days in plants fertilized continuously with 300 mg∙L−1 CaNO3-N compared with plants fertilized with 1000 mg∙L−1 CaNO3-N (Table 4). There was no significant effect on ORAC of a 7 day pulse with 1000 mg∙L−1 CaNO3-N added to 300 mg∙L−1, but a 7-day 300 mg∙L−1 CaNO3-N pulse added to the 21 days 1000 mg∙L−1 treatment resulted in significantly higher
Table 2. Leaf FW (g∙plant−1) and nitrate content (mg∙kg−1 FW) in lettuce plants fertilized with: 300 or 1000 mg∙L−1 CaNO3-N for 21 days or 28 days; or a combination of 300 mg∙L−1 CaNO3-N for 21 days + 1000 mg∙L−1 CaNO3-N for 7 days; or 1000 mg∙L−1 CaNO3-N for 21 days + 300 mg∙L−1 CaNO3-N for 7 days. *= Different letters represent significant differences between treatments.
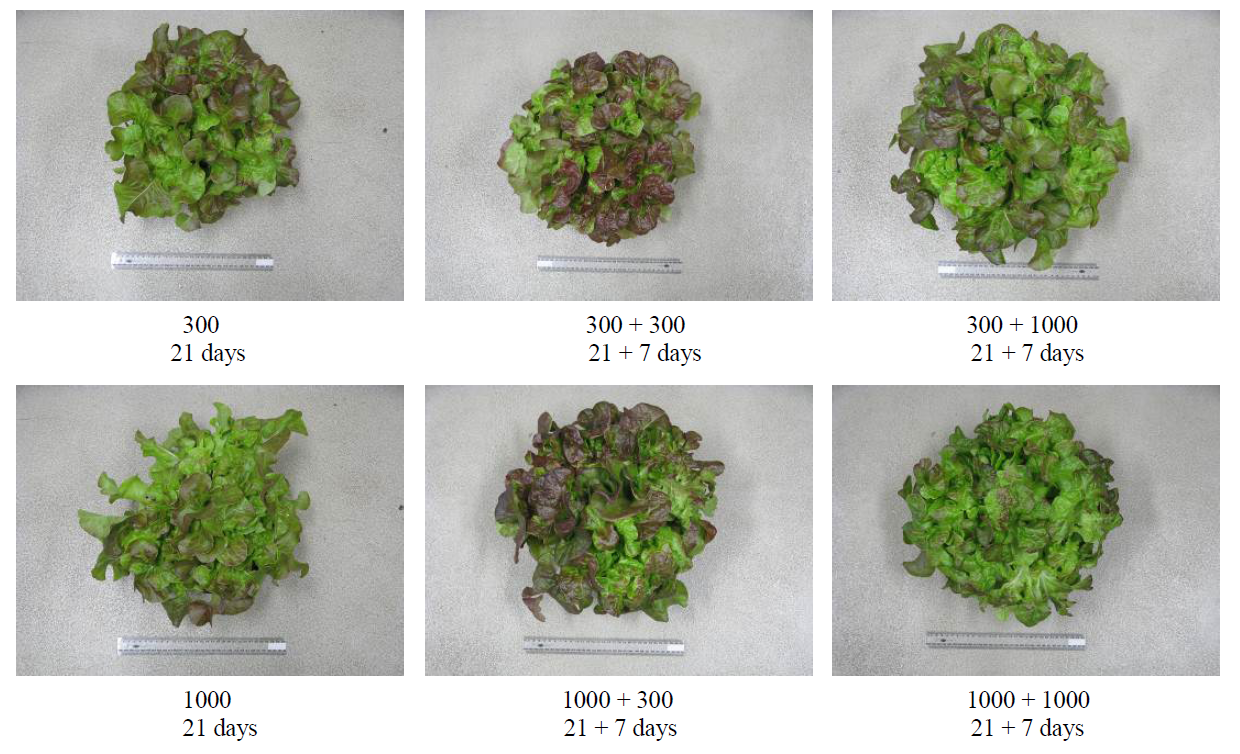
Figure 1. Representative images of each treatment after 21 and 28 days. Indicator is a 40 cm ruler. Numbers indicate the applied CaNO3-N (mg∙L−1) for the coresponsing period.
Table 3. Vitamin C content (mg∙100 g−1 FW) in lettuce plants fertilized with: 300 or 1000 mg∙L−1 CaNO3-N for 21 days or 28 days; or a combination of 300 mg∙L−1 CaNO3-N for 21 days + 1000 mg∙L−1 CaNO3-N for 7 days; or 1000 mg∙L−1 CaNO3- N for 21 days + 300 mg∙L−1 CaNO3-N for 7 days. *= Different letters represent significant differences between treatments.
Table 4. Antioxidant capacity, as measured by ORAC (μmol Trolox eqiv. 100 g−1 FW) and Total Plant Phenolics (TPP; mg GAE g−1 DW) in lettuce plants fertilized: 300 or 1000 mg∙L−1 CaNO3-N for 21 days or 28 days; or a combination of 300 mg∙L−1 CaNO3-N for 21 days + 1000 mg∙L−1 CaNO3-N for 7 days; or 1000 mg∙L−1 CaNO3-N for 21 days + 300 mg∙L−1 CaNO3-N for 7 days. *= Different letters represent significant differences between treatments.
ORAC compared to applying 1000 mg∙L−1 for 28 days (Table 4).
After 21 and 28 days, plants fertilized with 300 mg∙L−1 CaNO3-N had higher TPP compared with 1000 mg∙L−1 CaNO3-N (Table 4). While there was no significant effect on TPP of a 7 day 1000 mg∙L−1 CaNO3-N pulse added to 300 mg∙L−1 CaNO3-N, a 7-day reduction in CaNO3-N from 1000 mg∙L−1 to 300 mg∙L−1 resulted in a significant increase in TPP compared to 28 days at 1000 mg∙L−1 CaNO3-N (Table 4).
EC measurements showed that pots fertilized with 1000 mg∙L−1 CaNO3-N had a significantly higher EC than those receiving 300 mg∙L−1 CaNO3-N (data not shown). At 21 days EC peaked at 1.6 - 2.0 dS∙m−1 in pots fertilized with 1000 mg∙L−1 CaNO3-N and approximately 0.4 in pots fertilized with 300 mg∙L−1. Relative chlorophyll content in leaves (as measured by SPAD) increased significantly in all treatments in the first 5 days (Figure 2). At Day 21, chlorophyll content was significantly higher in plants fertilized with 1000 mg∙L−1 CaNO3-N compared with plants fertilized with 300 mg∙L−1 CaNO3-N. By the end of the trial (Day 28), chlorophyll content remained high in plants fertilized with 1000 mg∙L−1 but declined in plants fertilized with 300 mg∙L−1 (Figure 1).
4. Discussion
Yield is of primary importance to lettuce growers and new production methods that reduce yield will not be readily adopted. In an effort to improve both yield and antioxidant activity in this study, N availability was altered between days 22 and 28 in two treatments (Table 1). Reducing N to 300 mg∙L−1 CaNO3-N for 7 days after 21 days growth at 1000 mg∙L−1 CaNO3-N had no significant effect on fresh weight compared with plants kept on 1000 mg∙L−1 for 28 days (Table 2) but ORAC was significantly increased by 16% and TPP by 12% (Table 4). In contrast, adding 1000 mg∙L−1 for 7 days to plants previously fertilized with 300 mg∙L−1 CaNO3-N for 21 days did not affect ORAC or TPP (Table 4), but fresh weight significantly increased by 14% (Table 2).
Relative chlorophyll levels (as measured by SPAD; Figure 2), did not change significantly despite the observed decrease in leaf FW, indicating that the lowest applied CaNO3-N rate (300 mg∙L−1) was sufficient to maintain adequate photosynthesis. Nitrate content reflected greater N availability with highest content in plants fertilised with 1000 mg∙L−1 and at this rate exceeded the upper nitrate limits in lettuce leaves of between 3500 and 4500 mg∙kg−1 FW set by the European Community [19] .
Several reports over the past few years have shown that plant phenolic compounds associated with antioxidant capacity can be optimised under low N availability [20] . A variety of stresses, including N depletion, are known to result in increased activity in the phenolic synthetic pathway in plants [21] due to up-regulation of the phenylpropanoid pathway [22] . Accumulation of the flavonols quercetin and kaempferol, which would result in
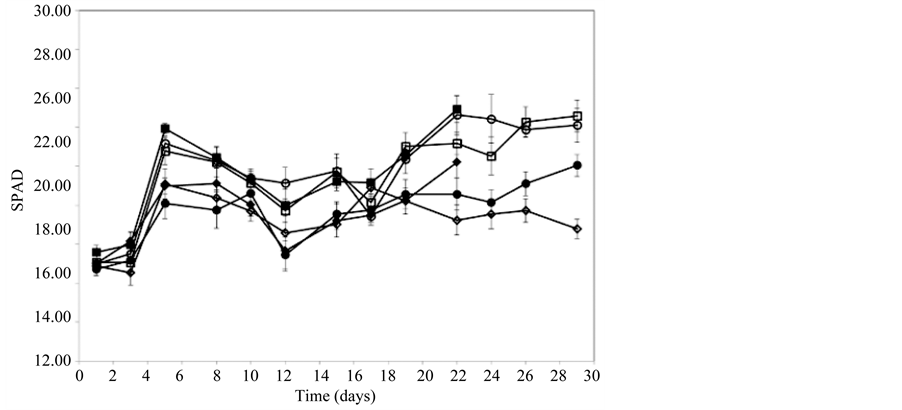
Figure 2. Relative leaf chlorophyll content (measured by SPAD) in lettuce plants fertilized with 300 or 1000 mg∙L−1 CaNO3-N for 21 days (♦300, ■1000) or 28 days (◊300, □1000) or a combination of 300 mg∙L−1 CaNO3-N for 21 days + 1000 mg∙L−1 CaNO3-N for 7 days (●) or 1000 mg∙L−1 CaNO3-N for 21 days + 300 mg∙L−1 CaNO3-N for 7 days (○).
both increased TPP and antioxidant capacity, is known to be induced by N depletion through enhanced synthesis via the phenylpropanoid pathway [20] [23] . Nitrogen-depleted Matricaria rosettes showed a significant increase in phenylalanine ammonia lyase (PAL) activity and a concomitant increase in phenolic content [24] ; an increase in PAL activity and TPP content was also seen in yarrow leaves grown with low N (0.1 mM) for four months [25] . Our data agree with these studies in that highest TPP and anti-oxidant capacity (ORAC) were recorded in plants supplied with low CaNO3-N, specifically 300 mg∙L−1 (Table 4). In addition, a seven day reduction in CaNO3-N application to 300 mg∙L−1 after 21 days at 1000 mg∙L−1 CaNO3-N, was low enough to cause N stress [9] in red lettuce leaves, leading to a possible up-regulation of the phenylpropanoid pathway and concomitant increased production of phenolic compounds. While a seven day period of low CaNO3-N was enough to induce phenolic synthesis (Table 4), it did not affect fresh weight (Table 2). Temporarily reducing CaNO3-N for 7 days before harvest, therefore, shows promise as a method to manipulate yield and phenolic content (Figure 1) but more research is necessary to optimise this method, particularly for leaves harvested at a more mature stage, or whole heads.
Quercetin, kaempferol, isorhamnetin and the anthocyanins are all commonly found in leafy vegetables and contribute significantly to antioxidant capacity [26] . Reference [9] reported that the largest increase in TPP in red lettuce grown under a range of CaNO3-N concentrations was not at the lowest rate (40 mg∙L−1), but between 75 and 400 mg∙L−1. For this reason the low CaNO3-N application rate in the present study was set at 300 mg∙L−1 CaNO3-N. The higher TPP content observed with 300 mg∙L−1 CaNO3-N (Table 4), therefore, could have resulted from increased levels of quercetin, kaempferol, and isorhamnetin, amongst other phenolic compounds, but a more targeted approach involving mass spectrometry is required to answer this question. Red lettuces also contain anthocyanins, which are known to increase in leaves with low N availability [27] . The lettuce plants growing under 300 mg∙L−1 CaNO3-N were noticeably more red in color compared with those supplied with 1000 mg∙L−1 CaNO3-N (Figure 1) but further quantitative measures are needed to confirm that the redder plants were higher in anthocyanins which were responsible for the observed increase in ORAC.
It appears that antioxidant capacity (measured as TPP) and vitamin C in lettuce leaves may also decline with age. TPP and vitamin C significantly declined between 21 and 28 days in plants fertilized with either 300 or 1000 mg∙L−1 CaNO3-N. In contrast, antioxidant capacity, as measured by ORAC, did not differ over the same time period (Table 4). Further studies are needed to fully understand the changes in antioxidant capacity in lettuce leaves during maturation.
Leaf vitamin C content was not significantly affected by CaNO3-N application rates after 28 days (Table 3). Furthermore, an increased or decreased in CaNO3-N application rate during days 22 and 28 had no significant effect on vitamin C. Reference [12] reported that increased N availability resulted in an increase in vitamin C in crisphead lettuce, while [27] found N fertilisation had no significant effect on vitamin C content in baby red lettuce, similar to our results. Our results indicate that low N availability does not affect regulation of the ascorbic acid biosynthetic pathway [28] as it does the phenylpropanoid pathway. Ascorbic acid detoxifies reactive oxygen species (ROS) in plants that can be generated by photosynthesis, respiration and a number of stresses [29] . It would appear that low CaNO3-N availability, at least in the range of 300 mg∙L−1 as tested in this study, may not have caused sufficient generation of ROS to elicit an up-regulation of the ascorbic acid biosynthesis pathway.
The observed increase in phenolic compounds due to low CaNO3-N availability, and not ascorbic acid synthesis, was likely responsible for the observed increased antioxidant capacity as measured by ORAC (Table 4). In a previous study [9] it was speculated that ascorbic acid may have contributed to the higher FRAP and ORAC values recorded in lettuce leaves supplied with CaNO3-N concentrations below 400 mg∙L−1 and this view has been supported in previous papers [30] . The present study does not support this view. As red lettuce leaves are high in anthocyanins [31] it may be that these compounds are primarily responsible for the observed changes in ORAC and TPP, but further research is needed to confirm this.
5. Conclusion
In conclusion, lowering the CaNO3-N supply from 1000 mg∙L−1 to 300 mg∙L−1 for 7 days prior to harvest in baby red lettuce resulted in a significant increase in ORAC and TPP, with no significant effect on yield. Vitamin C and leaf nitrate were not significantly affected. Temporarily reducing N for 7 days before harvest, therefore, shows promise as a method to manipulate yield and phenolic content but more researches are necessary to optimize this method, particularly for leaves harvested at a more mature stage, or whole heads.
Aknowledgments
This is a publication from Vital Vegetables, a Trans Tasman research project jointly funded and supported by Horticulture Australia Ltd., New Zealand Institute for Crop and Food Research Ltd., the New Zealand Foundation for Research Science and Technology, the Australian Vegetable and Potato Growers Inc., New Zealand Vegetable and Potato Growers Inc and the Victorian Department of Environment and Primary Industries. Thanks to Janet Tregenza and Bret Henderson for their technical assistance.
References
- Chiesa, A., Mayorga, I. and Leon, A. (2009) Quality of Fresh Cut Lettuce (Lactuca sativa L.) as Affected by Lettuce Genotype, Nitrogen Fertilisation and Crop Season. Advanced Hortorticultural Science, 23, 143-149.
- Nicolle, C., Cardinault, N., Gueux, E., Jaffrelo, L., Rock, E., Mazur, A., Amouroux, P. and Remesy, C. (2004) Health Effect of Vegetable-Based Diet: Lettuce Consumption Improves Cholesterol Metabolism and Antioxidant Status in the Rat. Clinical Nutrition, 23, 605-614. http://dx.doi.org/10.1016/j.clnu.2003.10.009
- Birt, D.F., Hendrich, S. and Wang, W. (2001) Dietary Agents in Cancer Prevention: Flavonoids and Isoflavonoids. Pharmacology & Therapeutics, 90, 157-177. http://dx.doi.org/10.1016/S0163-7258(01)00137-1
- Hu, F.B. (2003) Plant-Based Foods and Prevention of Cardiovascular Disease: An Overview. American Journal of Clinical Nutrition, 78, 544S-551S.
- Hollman, P.C.H. and Katan, M.B. (1999) Dietary Flavonoids: Intake, Health Effects and Bioavailability. Food and Chemical Toxicology, 37, 937-942. http://dx.doi.org/10.1016/S0278-6915(99)00079-4
- Larson, A.J., Symons, J.D. and Jalili, T. (2010) Quercetin: A Treatment for Hypertension? A Review of Efficacy and Mechanisms. Pharmaceuticals, 3, 237-250. http://dx.doi.org/10.3390/ph3010237
- Vargas, A.J. and Burd, R. (2010) Hormesis and Synergy: Pathways and Mechanisms of Quercetin in Cancer Prevention and Management. Nutrition Reviews, 68, 418-428. http://dx.doi.org/10.1111/j.1753-4887.2010.00301.x
- Kim, J.-D., Liu, L., Guo, W. and Meydani, M. (2006) Chemical Structure of Flavonols in Relation to Modulation of Angiogenesis and Immune-Endothelial Cell Adhesion. Journal of Nutritional Biochemistry, 17, 165-176. http://dx.doi.org/10.1016/j.jnutbio.2005.06.006
- Stefanelli, D., Winkler, S. and Jones, R.B. (2011) Reduced Nitrogen Availability during Growth Improves Quality in Lettuce Leaves by Minimizing Nitrate Content, and Increasing Antioxidant Capacity and Leaf Mineral Content. Agricultural Sciences, 2, 477-486. http://dx.doi.org/10.4236/as.2011.24061
- Nguyen, P.M. and Niemeyer, E.D. (2008) Effects of Nitrogen Fertilization on the Phenolic Composition and Antioxidant Properties of Basil (Ocimum basilicum L.). Journal of Agricultural and Food Chemistry, 56, 8685-8691. http://dx.doi.org/10.1021/jf801485u
- Mareczek, A. and Leja, M. (2005) Effect of Urea Foliar Application on Antioxidant Properties of Lettuce and Broccoli. Lithuanian Institute of Horticulture Arch, 24, 235-241.
- Poulsen, N., Johansen, A.S. and Sorensen, J.N. (1995) Influence of Growth Conditions on the Value of Crisphead Lettuce. Quality Changes during Storage. Plant Foods for Human Nutrition, 47, 157-162. http://dx.doi.org/10.1007/BF01089265
- Stefanelli, D., Brady, S., Winkler, S., Jones, R.B. and Tomkins, B.T. (2012) Lettuce (Lactuca sativa L.) Growth and Quality Responses to Applied Nitrogen under Hydroponic Conditions. Acta Horticulturae, 927, 353-360.
- Gent, M.P.N. (2003) Solution Electrical Conductivity and Ratio of Nitrate to Other Nutrients Affect Accumulation of Nitrate in Hydroponic Lettuce. HortScience, 38, 222-227.
- Eaton, A.D., Clesceri, L.S., Rice, E.W. and Greenberg, A.E. (2005) Standard Methods for the Examination of Water and Wastewater. 21st Edition, American Public Health Association, Washington DC.
- Anonimous (2003) Determination of Vitamin C by HPLC.
- Singleton, V.L., Orthofer, R. and Lamuela-Raventós, R.M. (1999) Analysis of Total Phenolics and Other Oxidation Substrates and Antioxidants by Means of Folin-Ciocalteu Reagent. Methods in Enzymology. Oxidants and Antioxidants Part A, 299, 152-178. http://dx.doi.org/10.1016/S0076-6879(99)99017-1
- Huang, D., Ou, B., Hampsch-Woodill, M., Flanagan, J.A. and Prior, R.L. (2002) High-Throughput Assay of Oxygen Radical Absorbance Capacity (ORAC) Using a Multichannel Liquid Handling System Coupled with a Microplate Fluorescence Reader in 96-Well Format. Journal of Agricultural and Food Chemistry, 50, 4437-4444. http://dx.doi.org/10.1021/jf0201529
- European Commission (EC) (2002) Commission Regulation. No. 563/2002 of April. Official Journal of the European Communities, No. L86/45, 2002.
- Stefanelli, D., Goodwin, I. and Jones, R. (2010) Minimal Nitrogen and Water Use in Horticulture: Effects on Quality and Content of Selected Nutrients. Food Research International, 43, 1833-1843. http://dx.doi.org/10.1016/j.foodres.2010.04.022
- Kang, H.M. and Saltveit, M.E. (2002) Antioxidant Capacity of Lettuce Leaf Tissue Increases after Wounding. Journal of Agricultural and Food Chemistry, 50, 7536-7541. http://dx.doi.org/10.1021/jf020721c
- Oh, M.M., Carey, E.E. and Rajashekar, C.B. (2009) Environmental Stresses Induce Health-Promoting Phytochemicals in Lettuce. Plant Physiology and Biochemistry, 47, 578-583. http://dx.doi.org/10.1016/j.plaphy.2009.02.008
- Olsen, K.M., Slimestad, R., Lea, W.S., Brede, C., Løvdal, T., Ruoff, P., Verheul, M.J. and Lillo, C. (2009) Temperature and Nitrogen Effects on Regulators and Products of the Flavonoid Pathway: Experimental and Kinetic Model Studies. Plant Cell and Environment, 32, 286-299. http://dx.doi.org/10.1111/j.1365-3040.2008.01920.x
- Kováčik, J. and Bačkor, M. (2007) Changes of Phenolic Metabolism and Oxidative Status in Nitrogen-Deficient Matricaria chamomilla Plants. Plant and Soil, 297, 255-265. http://dx.doi.org/10.1007/s11104-007-9346-x
- Giorgi, A., Mingozzi, M., Madeo, M., Speranza, G. and Cocucci. M. (2009) Effect of Nitrogen Starvation on the Phenolic Metabolism and Antioxidant Properties of Yarrow (Achillea collina Becker ex Rchb.). Food Chemistry, 114, 204-211. http://dx.doi.org/10.1016/j.foodchem.2008.09.039
- Rochfort, S.J., Imsic, M., Jones, R., Tomkins, B., Tomkins, B. and Trenerry, C.V. (2006) Characterisation of Flavonol Conjugates in Immature Leaves of Pak Choi [Brassica rapa L. ssp. chinensis L. (Hanelt.)] by HPLC-DAD and LCMS/MS. Journal of Agricultural and Food Chemistry, 54, 4855-4860. http://dx.doi.org/10.1021/jf060154j
- Bumgarner, N.R., Scheerens, J.C., Mullen, R.W., Bennett, M.A., Ling, P.P. and Kleinhenz, M.D. (2012) Root-Zone Temperature and Nitrogen Affect the Yield and Secondary Metabolite Concentration of Falland Spring-Grown, HighDensity Leaf Lettuce. Journal of the Science of Food and Agriculture, 92, 116-124. http://dx.doi.org/10.1002/jsfa.4549
- Smirnoff, N., Conklin, P.L. and Loewus, F.A. (2001) Biosynthesis of Ascorbic Acid in Plants: A Renaissance. Annual Review of Plant Physiology and Plant Molecular Biology, 52, 437-467. http://dx.doi.org/10.1146/annurev.arplant.52.1.437
- Conklin, P.L. and Barth, C. (2004) Ascorbic Acid, a Familiar Small Molecule Intertwined in the Response of Plants to Ozone, Pathogens, and the Onset of Senescence. Plant, Cell & Environment, 27, 959-970. http://dx.doi.org/10.1111/j.1365-3040.2004.01203.x
- Coria-Cayupán, Y.S., de Pinto, M.I.S. and Nazareno, M.A. (2009) Variations in Bioactive Substance Contents and Crop Yields of Lettuce (Lactuca sativa L.) Cultivated in Soils with Different Fertilization Treatments. Journal of Agricultural and Food Chemistry, 57, 10122-10129. http://dx.doi.org/10.1021/jf903019d
- Harnly, J.M., Doherty, R.F., Beecher, G.R., Holden, J.M., Hattowitz, D.B., Bhagwat, S. and Gebhardt, S. (2006) Flavonoid Content of U.S. Fruits, Vegetables and Nuts. Journal of Agricultural and Food Chemistry, 54, 9966-9977. http://dx.doi.org/10.1021/jf061478a
List of Abbreviations
CaNO3-N = Nitrogen Derived from Calcium Nitrate Fertilizer;
FW = Fresh Weight;
HPLC = High Pressure Liquid Chromato-graphy;
EC = Electric Conductivity;
TPP = Total Plant Phenolics;
FRAP = Ferric Reducing Anti-oxidant Power;
NOTES

*Corresponding author.